
Dividend Snapshot
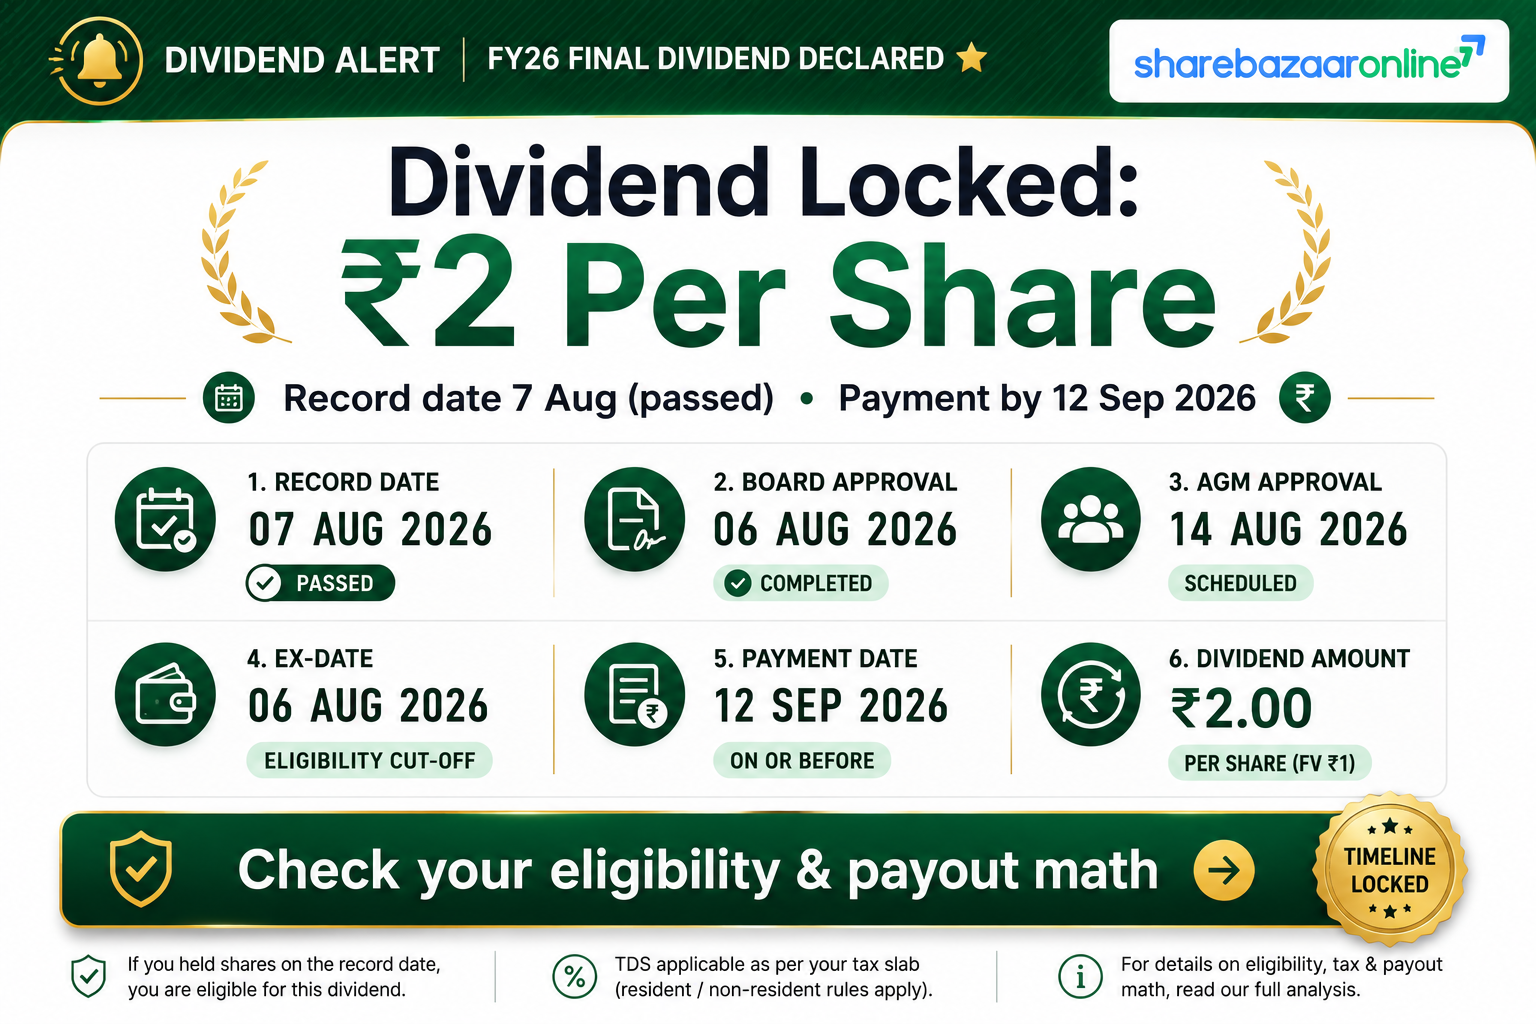
Aarvi Encon Limited (NSE: AARVI) declared a final dividend of ₹2 per equity share for the financial year ended 31 March 2026 (FY26). The payout was recommended by the Board on 22 May 2026 and approved by shareholders at the 38th Annual General Meeting held on 14 August 2026. On a face value of ₹10, ₹2 works out to a headline “20% dividend” — but at the current market price of about ₹156, the real cash yield is only 1.28%. Understanding that gap is the point of this analysis.
Dividend per share: ₹2.00
Dividend type: Final (FY26)
Face value: ₹10
Dividend rate on face value: 20%
Current dividend yield: ~1.28% (at CMP ₹156)
Record date: 7 August 2026 (passed)
AGM approval: 14 August 2026 (approved)
Payment: on or before 12 September 2026
Total outflow: ~₹2.96 crore
Consolidated EPS (FY26): ₹11.90
All financial figures in this report are drawn from the company’s audited FY26 consolidated results (filed with NSE on 22 May 2026) and Screener.in. Market price and yield figures are price-dependent and were last checked on 19 August 2026 — verify the live price before acting on any yield number.
Dividend Announcement Summary
At its board meeting on Friday, 22 May 2026, the Board of Directors of Aarvi Encon Limited approved the audited standalone and consolidated financial results for the quarter and year ended 31 March 2026 and recommended a final dividend of ₹2 per equity share of face value ₹10 each, i.e. a rate of 20% on face value. The statutory auditors, M/s Jay Shah & Associates, issued an unmodified (clean) opinion on both the standalone and consolidated results.
Because this is a final dividend, it required member approval. Shareholders approved it at the 38th AGM on 14 August 2026, alongside adoption of the FY26 accounts and the re-appointment of Mr Jaydev Sanghavi as a director. With approval now complete, the dividend has moved from “recommended” to declared, and payment is scheduled on or before 12 September 2026 (within 30 days of the AGM), subject to deduction of tax at source.
What the company does: Aarvi Encon is a Mumbai-based technical staffing and engineering-manpower outsourcing company (single reported segment: “Technical Manpower Outsourcing”). It supplies engineers, designers and technicians to oil & gas, power, refinery, petrochemical, infrastructure and renewable-energy clients in India and abroad, with subsidiaries in the UAE, Oman, UK and Saudi Arabia and associates/JVs in Indonesia and Qatar.
Key Dates Timeline
Board recommendation: 22 May 2026
Record date: Friday, 7 August 2026 (intimated to NSE on 13 July 2026 under Regulation 42)
Ex-date: On/around 7 August 2026 — under the T+1 settlement cycle the ex-date and record date typically fall on the same trading day (inferred; confirm against the NSE/BSE corporate-action circular).
38th AGM: Friday, 14 August 2026 (via video conferencing) — dividend approved
Payment date: On or before 12 September 2026 (within 30 days of AGM)
Eligibility: Shareholders on the register as of the record date (7 August 2026) qualified for the payout.
As this report is prepared after the record date and AGM, eligibility is now fixed. Investors buying the share today are not entitled to this particular FY26 final dividend.
Dividend Yield Analysis
The face-value illusion. A “20% dividend” sounds large, but the 20% is calculated on the ₹10 face value, not on what you pay for the share. The real, cash-in-hand yield is the dividend divided by the market price:
• At the current price of ₹156: ₹2 ÷ ₹156 = ~1.28% yield.
• At the approximate price on the announcement date (~₹120 in late May 2026, approximate — verify against NSE bhavcopy): ₹2 ÷ ~₹120 = ~1.67%.
So the headline “20%” is roughly 15 times the actual yield an investor earns at today’s price. This is normal for Indian equities and is not unique to Aarvi — but it is the single most misread number in any dividend headline.
Yield reality check. Aarvi’s ~1.28% yield is a product of a flat dividend meeting a rising share price. The stock is up roughly 35% over the past year (52-week range about ₹115–₹168), while the dividend stayed at ₹2. When the price rises and the dividend does not, the yield falls. This is a “good problem” (price appreciation), not a distress signal — the opposite of a high yield caused by a collapsing price.
Dividend History Analysis
Aarvi has paid a dividend every year since FY18, which marks it as a consistent payer. The table below shows dividend per share against consolidated EPS and the resulting payout ratio (DPS figures are derived from Screener payout data and rounded; confirm exact rupee amounts against company filings).
| Financial Year | DPS (₹) | Consol EPS (₹) | Payout % |
|---|---|---|---|
| FY26 | 2.00 | 11.90 | ~17% |
| FY25 | 2.00 | 6.78 | ~30% |
| FY24 | 2.00 | 7.67 | ~26% |
| FY23 | 2.00 | 9.81 | ~20% |
| FY22 | 2.00 | 8.16 | ~24% |
| FY21 | ~1.50 | 7.08 | ~21% |
| FY20 | ~1.00 | 4.86 | ~21% |
| FY19 | ~1.00 | 5.84 | ~17% |
| FY18 | ~0.50 | 5.26 | ~10% |
The key finding hiding in this table: the dividend has been frozen at ₹2 for five straight years (FY22–FY26) even though consolidated EPS nearly doubled from ₹6.78 in FY25 to ₹11.90 in FY26 (PAT up ~75%). As a result, the payout ratio compressed from ~30% to ~17%. Shareholders received the same rupee dividend despite a much bigger profit — the extra earnings were retained, not distributed. There have been no dividend cuts or suspensions in the visible history, and no special dividends.
Financial Performance Analysis
Revenue (consol, FY26): ₹649.85 crore, up 27.3% from ₹510.39 crore
Operating profit (EBITDA-ish): ~₹22.7 crore vs ~₹14 crore
PAT (owners): ₹17.62 crore, up 75.4% from ₹10.04 crore
Consolidated EPS: ₹11.90 (diluted ₹11.79)
Standalone PAT: ₹11.40 crore; standalone EPS ₹7.70
Operating leverage: revenue grew 27% but operating profit grew ~64% and PAT ~75% — profits rose faster than sales, so margins expanded. This is a thin-margin business (operating margin only about 3.5%), so small improvements in cost control move the bottom line sharply. Employee benefit expense of ₹488.8 crore is by far the largest cost, as expected for a manpower supplier.
Earnings-quality caveats (read these before celebrating the 75% PAT jump):
• Low tax rate. The effective tax rate was only ~12% (Screener flags “tax rate seems low”). A normalised tax rate would have reduced reported PAT and lifted the payout ratio.
• Exceptional items. FY26 PAT includes a net exceptional charge of just ₹0.34 crore — a ₹1.48 crore new-labour-code gratuity hit partly offset by a ₹1.14 crore gratuity-provision write-back. The write-back is a one-off, non-operating credit.
• Consolidated vs standalone gap. Consolidated EPS (₹11.90) is well above standalone EPS (₹7.70); overseas subsidiaries contributed a large share of group profit. The dividend, however, is paid out of the standalone parent, whose cash balance is much smaller.
Cash Flow Analysis
Reported profit is an opinion; cash is a fact. Here the two diverge. FY26 consolidated PAT was ₹17.62 crore, but net cash from operations was only ₹8.05 crore — operating cash flow converted just ~46% of accrual profit into cash.
Why the gap? Cash from operations before working-capital changes was actually strong at ₹25.28 crore. Two things pulled it down: (1) income tax paid of ₹12.28 crore during the year, and (2) working-capital absorption in a receivables-heavy staffing model (consolidated trade receivables of ₹102.4 crore). Encouragingly, debtor days improved from 83 to 58 in FY26, which is why operating cash flow recovered from a negative figure in FY25.
Operating cash flow (FY26): ₹8.05 crore
Capex (PPE + CWIP): ₹0.97 crore
Free cash flow: ~₹7.07 crore
Dividend outflow: ~₹2.96 crore
FCF cover of dividend: ~2.4x
Funding source: current-year free cash flow (not borrowings or asset sales)
Bottom line: despite the cash-vs-profit gap, FY26 free cash flow of ~₹7.07 crore comfortably covers the ~₹2.96 crore dividend about 2.4 times over. The payout is funded by genuine operating cash, not by leverage — a healthier signal than the raw OCF/PAT ratio alone would suggest. Note that in FY25 free cash flow was negative (about –₹12 crore), so cash generation in this business is volatile year to year.
Balance Sheet Strength
Equity (owners): ₹142.07 crore; book value ~₹95.9/share
Total borrowings: ₹26.70 crore (long-term ₹2.35 cr + short-term ₹24.35 cr)
Cash + bank + current investments: ~₹17.26 crore
Net debt: ~₹9.44 crore
Debt-to-equity: ~0.19x (low)
Net debt-to-equity: ~0.07x (near net-cash)
ROE (FY26): ~13.4%; 3-yr average ~10.7%
ROCE (FY26): ~14.4%
The balance sheet is lightly leveraged. Borrowings are mostly short-term working-capital lines (natural for a receivables-funded staffing business), and net debt is small relative to equity. The main balance-sheet story is not debt but working capital: trade receivables of ~₹102 crore dwarf the ~₹17 crore cash pile, so the company’s liquidity depends on collecting from clients on time. The soft spot is return ratios: a 3-year average ROE near 10.7% is modest, meaning the heavy profit retention (low payout) has not yet translated into high returns on the retained capital.
Dividend Sustainability Analysis
We apply a four-test scorecard to the FY26 final dividend of ₹2 (~₹2.96 crore total outflow):
• Earnings coverage: consolidated EPS ₹11.90 ÷ DPS ₹2 = 5.95x (standalone 3.85x). Very comfortable.
• Operating cash flow coverage: OCF ₹8.05 crore ÷ ₹2.96 crore = ~2.7x. Adequate.
• Free cash flow coverage: FCF ~₹7.07 crore ÷ ₹2.96 crore = ~2.4x. Adequate.
• Liquidity/cash coverage: cash + investments ~₹17.26 crore ÷ ₹2.96 crore = ~5.8x. Strong.
Verdict: Sustainable. On every test the dividend is well covered, the payout ratio is conservative (~17%), and leverage is low. The only nuances a careful reader should hold in mind: cash generation is volatile (FY25 FCF was negative), the parent’s standalone cash is thin (~₹1.31 crore) even though group cash is larger, and part of FY26 profit growth leaned on a low tax rate. None of these threaten a ₹2 dividend, but they explain why management keeps the payout modest rather than raising it in line with EPS.
Peer Comparison
Aarvi sits in the diversified commercial services / staffing space. Larger listed staffing peers include Quess Corp, TeamLease Services and SIS Limited; smaller comparables include ITCONS E-Solutions. As a group, staffing companies are low-yield, growth-oriented businesses that pay little or no dividend, so Aarvi’s ~1.28% yield is actually at the higher end for the segment. Cells below are left blank where we could not independently verify a current figure, rather than filled with an estimate.
| Company | Div Yield | Payout | ROE | ROCE |
|---|---|---|---|---|
| Aarvi Encon | ~1.28% | ~17% | ~13.4% | ~14.4% |
| Quess Corp | — | — | — | — |
| TeamLease Services | — | — | — | — |
| SIS Limited | — | — | — | — |
| ITCONS E-Solutions | — | — | — | — |
Peer yield, payout, ROE and ROCE figures are marked “—” pending independent verification and should be completed by the desk from current filings before publishing.
Promoter Impact Analysis
Promoter holding: ~73.36% (June 2026)
FII holding: ~0% — negligible institutional interest
Public/others: ~26.65%
Promoter share of dividend: ~₹2.17 crore of the ~₹2.96 crore outflow
Public shareholders’ share: ~₹0.79 crore
Because the promoter family (the Sanghavis) owns about 73%, roughly ₹2.17 crore of every dividend rupee-pool flows back to the promoters. That alignment can cut two ways. On one hand, a promoter-heavy register that keeps the payout modest signals a preference for reinvesting profits rather than extracting cash — consistent with the frozen ₹2 dividend despite doubled EPS. On the other hand, the near-total absence of institutional (FII/DII) ownership means there is little external pressure on capital-allocation discipline, and low free float can amplify share-price swings.
Taxation Analysis
Since the removal of the Dividend Distribution Tax in 2020, dividends in India are taxable in the hands of the investor at their applicable income-tax slab rate. The company also deducts TDS at 10% under the Income-Tax rules if the total dividend paid to a resident shareholder in a financial year exceeds ₹5,000 (a valid PAN is required; without PAN, TDS is higher). TDS is not an extra tax — it is an advance credit you adjust against your final liability when filing your return.
Worked example — investor holding 1,000 shares, dividend ₹2/share, 30% tax slab:
• Gross dividend = 1,000 × ₹2 = ₹2,000
• TDS @10% = Nil here, because ₹2,000 is below the ₹5,000 threshold
• Tax at 30% slab = ₹2,000 × 30% = ₹600 (plus applicable cess)
• Net dividend in hand after tax = ₹1,400
• Post-tax yield on an investment at ₹156/share = ~0.90%
This is an illustration, not tax advice. Your actual tax depends on your total income, slab, surcharge and cess. Consult a qualified tax professional.
Key Risks
• Wafer-thin margins. Operating margin is only ~3.5%. In a manpower-outsourcing model, rising employee costs or client pricing pressure can quickly erode the small profit spread. Q1FY27 already showed EBITDA margin contracting on higher employee costs.
• Receivables and cash-conversion volatility. Trade receivables (~₹102 crore) are large versus profit, and free cash flow swung from about –₹12 crore (FY25) to +₹7 crore (FY26). A slowdown in client collections could squeeze the cash that funds dividends.
• Earnings-quality dependence on non-operating items. A low ~12% effective tax rate flattered FY26 PAT, and in Q1FY27 a large slice of profit before tax reportedly came from government incentives/subsidies rather than core operations. Such items are not guaranteed to repeat.
• Client and sector concentration. Revenue is tied to capex cycles in oil & gas, power, refinery and infrastructure. A downturn in these end-markets, or the loss of a large client, would hit deputation volumes directly.
• Low liquidity and no institutional cover. With ~73% promoter holding and near-zero FII/DII ownership, the free float is small and the stock can be volatile; there is also limited external scrutiny of capital allocation.
• Regulatory / labour-code impact. Implementation of the new labour codes already produced a ₹1.48 crore gratuity-liability charge in FY26; further compliance costs could affect a labour-intensive business.
What To Monitor
• Operating margin trend. Watch whether the ~3.5% operating margin holds or slips as employee costs rise; Q1FY27 already flagged a margin dip.
• Debtor days and operating cash flow. The improvement to 58 debtor days drove the FY26 cash recovery; track whether collections and OCF stay positive rather than reverting to FY25’s cash outflow.
• Quality of profit. Monitor the effective tax rate and the share of profit coming from government incentives or other non-operating items — core operating profit is the number that sustains dividends.
• Payout policy. With EPS doubling but the dividend frozen at ₹2 and payout down to ~17%, watch whether management eventually raises the dividend or announces a buyback, or continues to retain aggressively.
• Order book and client wins. New contract wins (e.g. the multi-year EPC contracts announced through FY26–FY27) and client-retention rates drive deputation headcount and future revenue.
• Return ratios. Track ROE/ROCE for evidence that retained profits are earning better returns; the current ~11% 3-year ROE is the weak link in the story.
Conclusion
Aarvi Encon’s FY26 final dividend of ₹2 is a modest, well-covered, and sustainable payout from a company that has quietly grown revenue at ~27% and profit at ~75% in a single year. The headline “20% dividend” is a face-value figure; the real yield at today’s ~₹156 price is only about 1.28%. The more interesting story is what management chose not to do: with EPS nearly doubling, it held the dividend flat and let the payout ratio fall to ~17%, retaining the extra profit inside the business.
The positives — strong earnings and free-cash-flow coverage (2–6x on every test), low debt, a clean audit opinion and a consistent nine-year dividend record — are real. The negatives — a ~1.3% yield, wafer-thin margins, volatile cash conversion, a low tax rate flattering profit, modest ~11% ROE, and near-zero institutional ownership — are equally real. This report presents both sides and the risks; the decision on what to do with the shares is entirely the reader’s.
Frequently Asked Questions
What dividend has Aarvi Encon announced for FY26?
What is the actual dividend yield?
What was the record date?
What was the ex-date?
When will the dividend be paid?
Who was eligible for this dividend?
How is this dividend taxed?
Is the dividend sustainable?
What is Aarvi Encon’s dividend history?
Why has the dividend stayed at ₹2 despite higher profit?
Why is operating cash flow lower than reported profit?
What should investors monitor going forward?
How much of the dividend goes to promoters?
Disclaimer
This article is for informational and educational purposes only and does not constitute investment, financial, legal or tax advice, nor a recommendation to buy, sell or hold any security. ShareBazaar Online is a financial-publishing platform and is not registered with SEBI as an investment adviser or research analyst. Figures are compiled from the company’s audited FY26 filings, Screener.in and public sources; market price, yield and peer figures are time-sensitive and may have changed — independently verify the live price and official NSE/BSE corporate-action circulars before acting. The taxation example is illustrative and general. Investing in equities carries risk, including loss of capital. Readers should do their own research and consult a SEBI-registered adviser and a qualified tax professional before making any decision.