
Dividend Snapshot
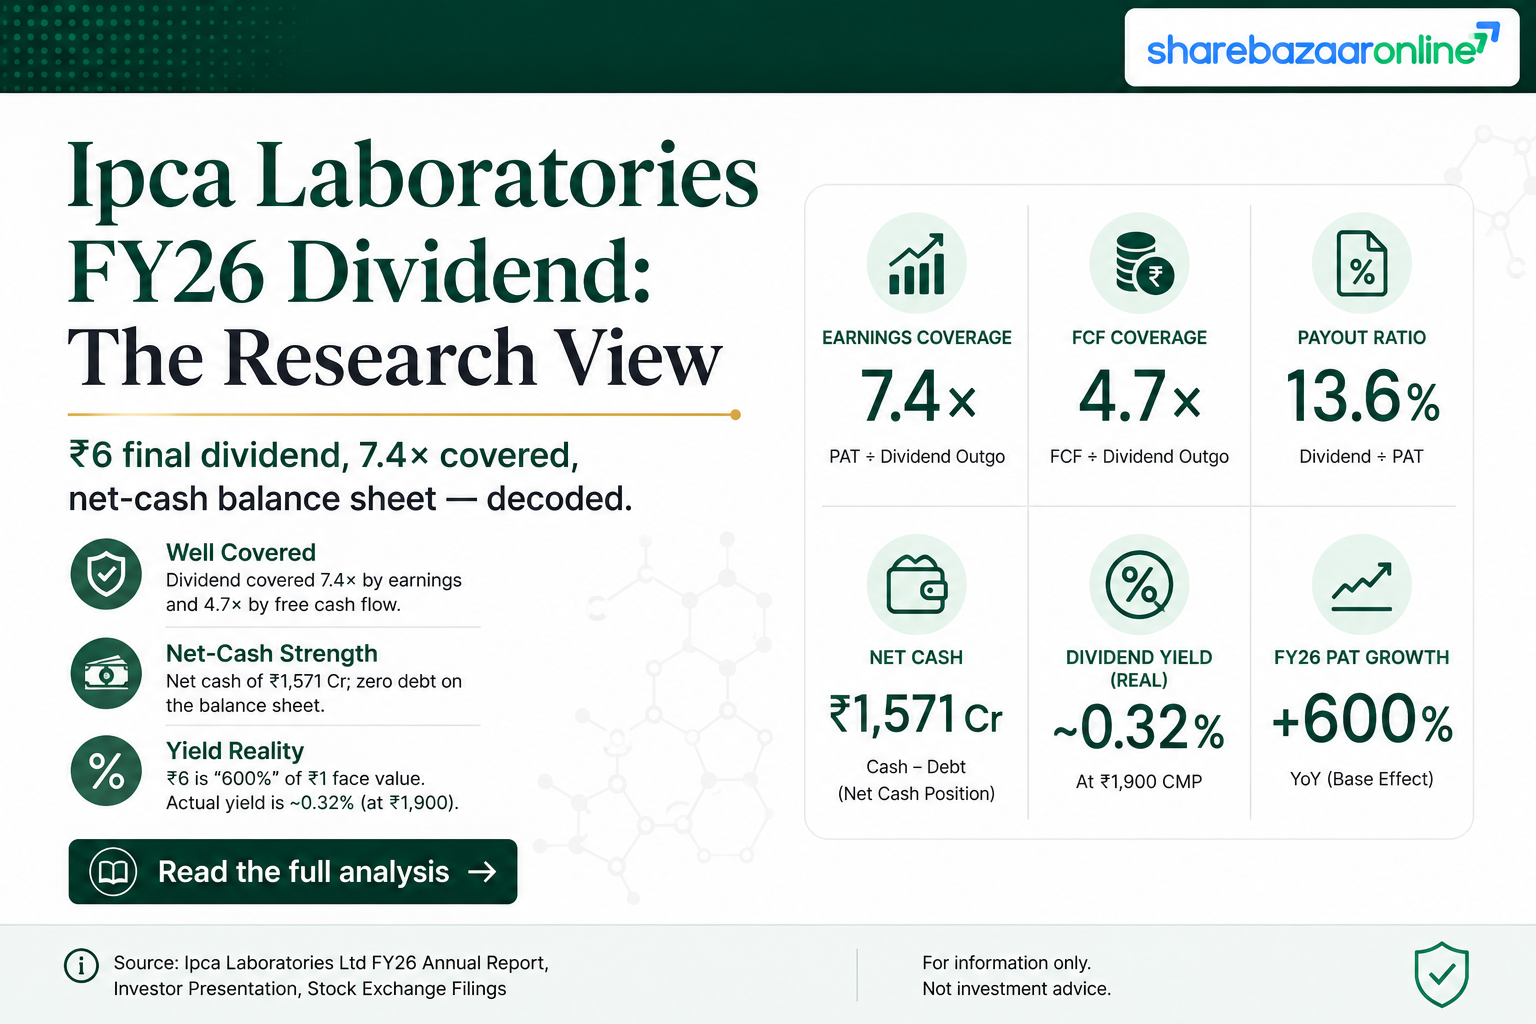
Dividend Per Share
₹6.00
Final dividend for FY2025-26 (600% of ₹1 face value).
Real Dividend Yield (at CMP)
~0.32%
₹6 ÷ ~₹1,886 CMP. The “600%” is a face-value figure, not a yield.
Total Dividend Outflow
₹152.22 Cr
₹6 × 25.37 crore shares outstanding.
Earnings Coverage
7.4x
EPS ₹44.64 (standalone) covers the ₹6 payout 7.4 times.
One-line takeaway: A comfortably-covered, cash-backed dividend that has stepped up sharply in absolute terms — but on a low base. Ipca remains a capital-appreciation stock, not an income stock. The payout ratio is roughly 13%, so the vast majority of earnings is being retained to fund growth.
Dividend Announcement Summary
At its board meeting on 29 May 2026 (11:30 a.m. to 1:45 p.m.), the Board of Directors of Ipca Laboratories recommended a final dividend of ₹6 per equity share of ₹1 each (600%) for the financial year ended 31 March 2026. The Board fixed Friday, 7 August 2026 as the record date for member entitlement.
The recommendation was placed “subject to the approval of shareholders at the ensuing Annual General Meeting.” Per exchange disclosures, Ipca held its 76th AGM on 13 August 2026 and shareholders passed all resolutions, including the dividend. The payout is therefore confirmed for eligible shareholders. This is a single final dividend; the company did not declare an interim dividend for FY26.
Company & Instrument
Ipca Laboratories Limited
NSE: IPCALAB • BSE: 524494
ISIN: INE571A01038
Face Value: ₹1 • Sector: Pharmaceuticals
Dividend Terms
Type: Final Dividend
Amount: ₹6 per share (600%)
Financial Year: FY2025-26
AGM approval: Obtained (13 Aug 2026)
Key Dates Timeline
| Event | Date | Note |
|---|---|---|
| Announcement / Board Meeting | 29 May 2026 | Dividend recommended |
| Record Date | 7 August 2026 (Fri) | Entitlement cut-off (from filing) |
| Ex-Date | 7 August 2026 (indicative) | Under T+1, ex-date generally equals record date — confirm against exchange circular |
| AGM Approval | 13 August 2026 | 76th AGM approved the dividend |
| Payment Date | Not disclosed by company | Statutory outer limit: within 30 days of AGM declaration (i.e. on or before ~12 Sep 2026) |
Editorial note: The company did not publish a separate ex-date or a firm payment date in the board outcome. The ex-date shown is the standard T+1 convention (same as record date) and must be verified against the NSE/BSE corporate-action circular before publication. The payment date reflects only the statutory outer limit, not a company-disclosed date.
Dividend Yield Analysis
The headline number — 600% — is the dividend expressed as a percentage of the ₹1 face value. It is not the return an investor earns. Because Ipca trades at roughly ₹1,886, the actual cash yield is a fraction of a percent.
Yield at Current Market Price
₹6 ÷ ~₹1,886 = ~0.32%
CMP is an external market figure (NSE, mid-August 2026) and must be re-verified live at publication.
Yield at Announcement
₹6 ÷ ~₹1,510 = ~0.40%
Around the 29 May 2026 board meeting the stock was near ₹1,510 (proxy). The subsequent yield fell because the share price rose, not because the dividend shrank.
Yield reality check: The yield here is low for a healthy reason, not a distressed one. It is driven by a high, appreciating share price against a deliberately modest payout — the opposite of the classic “high yield from a collapsing price” trap. Ipca’s yield sits below the pharma sector average of roughly 0.7–0.8%.
Dividend History Analysis
| Ex-Date (approx.) | Dividend / Share | Type |
|---|---|---|
| Aug 2026 (record 7 Aug) | ₹6.00 | Final — current |
| Aug 2025 | ₹2.00 | Final |
| Nov 2024 | ₹2.00 | Interim |
| Aug 2024 | ₹2.00 | Final |
| Nov 2023 | ₹2.00 | Interim |
| Nov 2022 | ₹4.00 | Annual |
| Nov 2021 | ₹4.00 | Annual |
| Nov 2020 | ₹4.00 | Annual |
| FY2018–2020 | ₹0.50 – ₹2.50 | See note on face-value split |
Pattern classification: Consistent but Variable Payer
Ipca has paid a dividend every year for well over a decade, but the amount has fluctuated — from ₹4 annual payments (FY21–FY23) down to ₹2 tranches (FY24–FY25), and now a single ₹6 final for FY26. The trajectory shows at least one reduction in the last decade, so this is not a smoothly-rising dividend record.
Corporate-action distortion (must-read)
Ipca’s face value was historically ₹2 and is now ₹1 (equity share count roughly doubled). Raw historical dividend-per-share figures from the ₹2 face-value era are not directly comparable with today’s ₹1 figures without halving. The exact split date and the FY24/FY25 interim-vs-final split should be reconciled against exchange circulars before treating this table as definitive.
The real story: The ₹6 final is the single largest dividend Ipca has declared in recent history — roughly 3× the ₹2 tranche paid a year earlier. Yet because earnings have grown even faster, the payout ratio has barely moved (still ~13%). The step-up signals management comfort with cash generation, not a shift to a high-distribution policy.
Financial Performance Analysis
| Metric (Consolidated) | FY26 | FY25 | Growth |
|---|---|---|---|
| Revenue from Operations | ₹9,646.33 Cr | ₹8,939.59 Cr | +7.9% |
| EBITDA (pre-forex/OI/exceptional) | ₹1,998.96 Cr | ₹1,693.13 Cr | +18.1% |
| PAT to owners (after exceptional) | ₹1,141.12 Cr | ₹737.68 Cr | +54.7% |
| PAT (before exceptional) | ₹1,277.80 Cr | ₹992.58 Cr | +28.7% |
| EPS after exceptional | ₹44.98 | ₹29.08 | +54.7% |
Base-effect flattery — the headline overstates the trend
The reported +54.7% jump in consolidated profit (and +74% at standalone level) looks spectacular, but it is heavily inflated by a depressed prior-year base. FY25 absorbed roughly ₹205 Cr of exceptional charges (impairments of overseas subsidiary/associate exposure and an EU fine settlement), versus only ₹86.43 Cr of exceptionals in FY26. Stripping those out, the cleaner before-exceptional profit growth is about +29% consolidated. Revenue grew a more pedestrian ~8%. The genuine operating story is EBITDA margin expansion (roughly 18% EBITDA growth on 8% revenue growth), not a doubling of the business.
Operating leverage
Consolidated EBITDA margin (pre-forex, other income and exceptional items) improved to 20.72% in FY26 from 18.94% in FY25. Revenue rose ~8% but EBITDA rose ~18%, confirming positive operating leverage — cost lines grew slower than the top line.
Revenue mix
Standalone FY26 domestic formulations grew ~10% to ₹3,817.24 Cr and exports rose ~11% to ₹3,129.43 Cr. Growth is broad-based across formulations and APIs, with the single reportable segment being Pharmaceuticals.
Cash Flow Analysis
Reported profit is an accounting opinion; the dividend is paid in cash. On this test Ipca screens well. Standalone operating cash flow of ₹1,378.12 Cr comfortably exceeds standalone profit of ₹1,132.52 Cr — an OCF-to-PAT ratio of ~1.22x, indicating high-quality, cash-backed earnings rather than paper profit.
Free cash flow (standalone)
OCF ₹1,378.12 Cr − Capex ₹665.45 Cr = FCF ₹712.67 Cr
FCF covers the ₹152.22 Cr dividend outflow 4.7 times over.
Free cash flow (consolidated)
OCF ₹1,141.97 Cr − Capex ₹652.26 Cr = FCF ₹489.71 Cr
Group FCF covers the dividend 3.2 times. Capex is heavy (~₹650 Cr), consistent with an expanding manufacturing base.
How the dividend is funded: Entirely from current-year free cash flow. There is no evidence the payout relies on drawing down reserves, selling assets, or raising borrowings. Even after ~₹650–665 Cr of capex, the business threw off enough surplus cash to fund the dividend several times over.
Balance Sheet Strength
Liquidity (standalone)
Cash & equivalents: ₹311.51 Cr
Current investments: ₹348.03 Cr
Other bank balances: ₹51.67 Cr
Total liquid: ₹711.21 Cr (4.7x the dividend)
Liquidity (consolidated)
Cash & equivalents: ₹437.12 Cr
Current investments: ₹633.42 Cr
Other bank balances: ₹127.47 Cr
Total liquid: ₹1,198.01 Cr (7.9x the dividend)
Net cash position — not net debt
Standalone borrowings total ₹235.16 Cr against ₹711.21 Cr of liquid assets — a net cash position of ~₹476 Cr. On a consolidated basis, borrowings of ₹703.94 Cr are still exceeded by liquid assets of ₹1,198.01 Cr, a net cash position of ~₹494 Cr. Consolidated net worth attributable to owners stands at ₹8,063.81 Cr. The dividend is not being paid by a leveraged balance sheet.
Dividend Sustainability Analysis
| Sustainability Test | Result | Verdict |
|---|---|---|
| 1. Earnings coverage (EPS ÷ DPS) | 7.4x | Pass |
| 2. Operating cash flow coverage | OCF ₹1,378 Cr vs ₹152 Cr | Pass |
| 3. Free cash flow coverage | 4.7x (SA) / 3.2x (Con) | Pass |
| 4. Liquidity / cash coverage | 4.7x–7.9x | Pass |
Classification: Sustainable. All four coverage tests pass with wide margins, the balance sheet is in net cash, and the payout ratio (~13%) leaves ample buffer. The principal caveat is not affordability but consistency of policy — Ipca’s dividend has historically been variable, so a ₹6 payout in FY26 does not guarantee a ₹6 (or higher) payout in FY27. Sustainability of the amount is high; predictability of the trajectory is only moderate.
Peer Comparison
| Company | FY26 Dividend | Approx. Yield | Approx. Payout |
|---|---|---|---|
| Ipca Laboratories | ₹6 (final) | ~0.32% | ~13% |
| Sun Pharmaceutical | ₹16 (₹11 int + ₹5 fin) | ~0.9% | ~33% |
| Cipla | ₹13 (final) | ~0.8% | — |
| Dr Reddy’s | ₹8 (final) | ~0.5% | — |
| Torrent Pharma | ₹38 (total, FV ₹5) | ~1.0% | — |
Peer dividend, yield and payout figures are external, drawn from public sources for FY26 and must be independently re-verified; blank cells are left blank rather than estimated. The takeaway is directional: Ipca is among the lowest-yielding names in the large-cap pharma set, with a payout ratio well below Sun Pharma’s ~33%. This reflects Ipca’s reinvestment-heavy, capital-appreciation profile rather than any inability to pay.
Promoter Impact Analysis
Promoter dividend income
Promoter holding: 44.72%
Promoter share of ₹152.22 Cr outflow: ~₹68.07 Cr
Public / minority income
Non-promoter holding: ~55.28% (FII ~10.7%, DII ~37%, public ~7.5%)
Public share of outflow: ~₹84.15 Cr
A little under half the dividend flows to the promoter group (the Godha family). Because promoter holding is under 50%, the majority of the cash reward — roughly ₹84 Cr — goes to non-promoter shareholders, led by domestic institutions. There is no pledged-promoter distortion; the payout is a straightforward pro-rata distribution.
Taxation Analysis
Since the abolition of the Dividend Distribution Tax (FY2020-21 onwards), dividends are taxed in the hands of the shareholder. Key rules:
• Dividend is added to “Income from Other Sources” and taxed at the investor’s applicable slab rate.
• The company deducts TDS at 10% if total dividend paid to a resident shareholder exceeds ₹10,000 in a financial year (20% if PAN is not furnished).
• Non-resident (NRI) shareholders face 20% TDS or the applicable DTAA rate.
Worked example — 1,000 shares at 30% slab
Gross dividend: 1,000 × ₹6 = ₹6,000
TDS at source: ₹0 (below the ₹10,000 threshold, so no TDS is deducted here)
Tax at 30% slab (plus applicable cess): ~₹1,800 + cess, payable via the investor’s return
Net in-hand after tax: ~₹4,200 (approx., before cess)
Effective post-tax yield at a ₹1,886 price: roughly 0.22%. A shareholder holding enough stock for dividends above ₹10,000 would see 10% TDS withheld upfront and adjust the balance in their return.
This is general information, not tax advice. Investors should consult a qualified tax professional for their specific situation.
Key Risks
1. Low structural yield. At ~0.32%, the dividend is negligible as an income source. Total return depends almost entirely on share-price appreciation, which is not guaranteed.
2. Variable dividend policy. Ipca’s payout has been cut before and has fluctuated between ₹2 and ₹6-equivalent levels. The ₹6 FY26 payout may not repeat; there is no formal dividend-distribution policy target visible in this filing.
3. Exceptional-item volatility. Reported profit has been repeatedly distorted by impairments (overseas subsidiary/associate), an EU competition fine settlement, and new labour-code charges. This makes headline earnings — and by extension coverage ratios — noisier than they appear.
4. Regulatory & export dependence. Ipca earns a large share of revenue from exports and regulated markets. USFDA/regulatory actions, price controls, and slower ramp-up of new launches (a risk flagged by sell-side analysts) could pressure earnings and future payouts.
5. Heavy capex intensity. With ~₹650–665 Cr of annual capex, a large share of cash is committed to reinvestment. If capex rises or cash generation weakens, the buffer over the dividend narrows.
6. Valuation risk. The stock trades at a rich P/E (high-30s) and ~5.9x book. A de-rating would hurt total return far more than the small dividend cushions it.
What To Monitor
1. FY27 dividend decision. Whether Ipca holds, raises, or trims the ₹6 level — the clearest signal of whether the step-up is structural or one-off.
2. Before-exceptional profit trajectory. Track the clean ~₹1,278 Cr consolidated base, not the exceptional-flattered headline, to judge true earnings momentum.
3. EBITDA margin trend. The FY26 story was margin expansion (consolidated ~20.7%). Sustained margin gains would support future payout growth; reversal would pressure it.
4. Free cash flow after capex. Watch whether FCF stays comfortably above the dividend as the capex cycle continues. Early Q1 FY27 commentary pointed to raised growth and margin guidance — verify it flows through to cash.
5. Export / US business ramp and regulatory status. New-launch traction and any regulatory observations at manufacturing sites directly shape the earnings that fund dividends.
6. Unichem and overseas subsidiary performance. Consolidated results carry acquired entities (Unichem, US step-downs). Their turnaround or further impairment will move consolidated coverage.
Conclusion
Ipca Laboratories’ FY26 final dividend of ₹6 per share is genuine, cash-backed and comfortably affordable — covered 7.4 times by earnings, 4.7 times by standalone free cash flow, and sitting on a net-cash balance sheet. In absolute terms it is a landmark payout, roughly triple the prior year’s tranche.
But two realities temper the headline. First, the “600%” is a face-value optical effect — the real yield is about 0.32%, below the pharma sector average. Second, the eye-popping ~55% profit jump is substantially a base effect: strip out the prior year’s heavy impairment and fine charges, and underlying growth is a healthy-but-normal ~29%. Ipca remains, unambiguously, a growth and capital-appreciation stock that pays a modest, well-covered dividend — not an income play. The positives (coverage, cash, margin expansion) and the watch-items (yield, policy consistency, exceptional-item noise, valuation) are laid out above for readers to weigh themselves.
Frequently Asked Questions
What dividend has Ipca Laboratories announced for FY26?
What is the Ipca Laboratories dividend yield?
What is the record date for the Ipca dividend?
What is the ex-date for the Ipca Laboratories dividend?
When will the Ipca dividend be paid?
Who is eligible to receive the Ipca dividend?
How is the Ipca dividend taxed?
Is the Ipca Laboratories dividend sustainable?
What is Ipca Laboratories’ dividend history?
Why did Ipca’s profit jump so much in FY26?
Is Ipca Laboratories a good dividend (income) stock?
What should investors monitor after this dividend?
Disclaimer
This article is for informational and educational purposes only and does not constitute investment, financial, legal or tax advice, nor a recommendation to buy, sell or hold any security. ShareBazaar Online is not a SEBI-registered investment adviser or research analyst. Dividend figures, dates and board recommendations are sourced from Ipca Laboratories’ exchange filing dated 29 May 2026. Market price, dividend yield, shareholding, peer data and other non-filing figures are drawn from public third-party sources, may be time-sensitive, and must be independently verified against live data and official exchange records before any decision. All ratios have been computed from disclosed figures; items not disclosed by the company are marked accordingly. Investments in securities are subject to market risks. Please consult a SEBI-registered adviser and a qualified tax professional before investing.