
Dividend Snapshot
Cholamandalam Financial Holdings Limited (NSE: CHOLAHLDNG, BSE: 504973) has declared a final dividend of ₹1.30 per equity share for FY2025-26, a payout of 130% on the face value of Re 1. On the surface a triple-digit percentage looks generous, but on the live market price of roughly ₹1,553 the real cash return works out to only about 0.08%. This is the classic face-value illusion that separates a headline from a yield.
Dividend Per Share
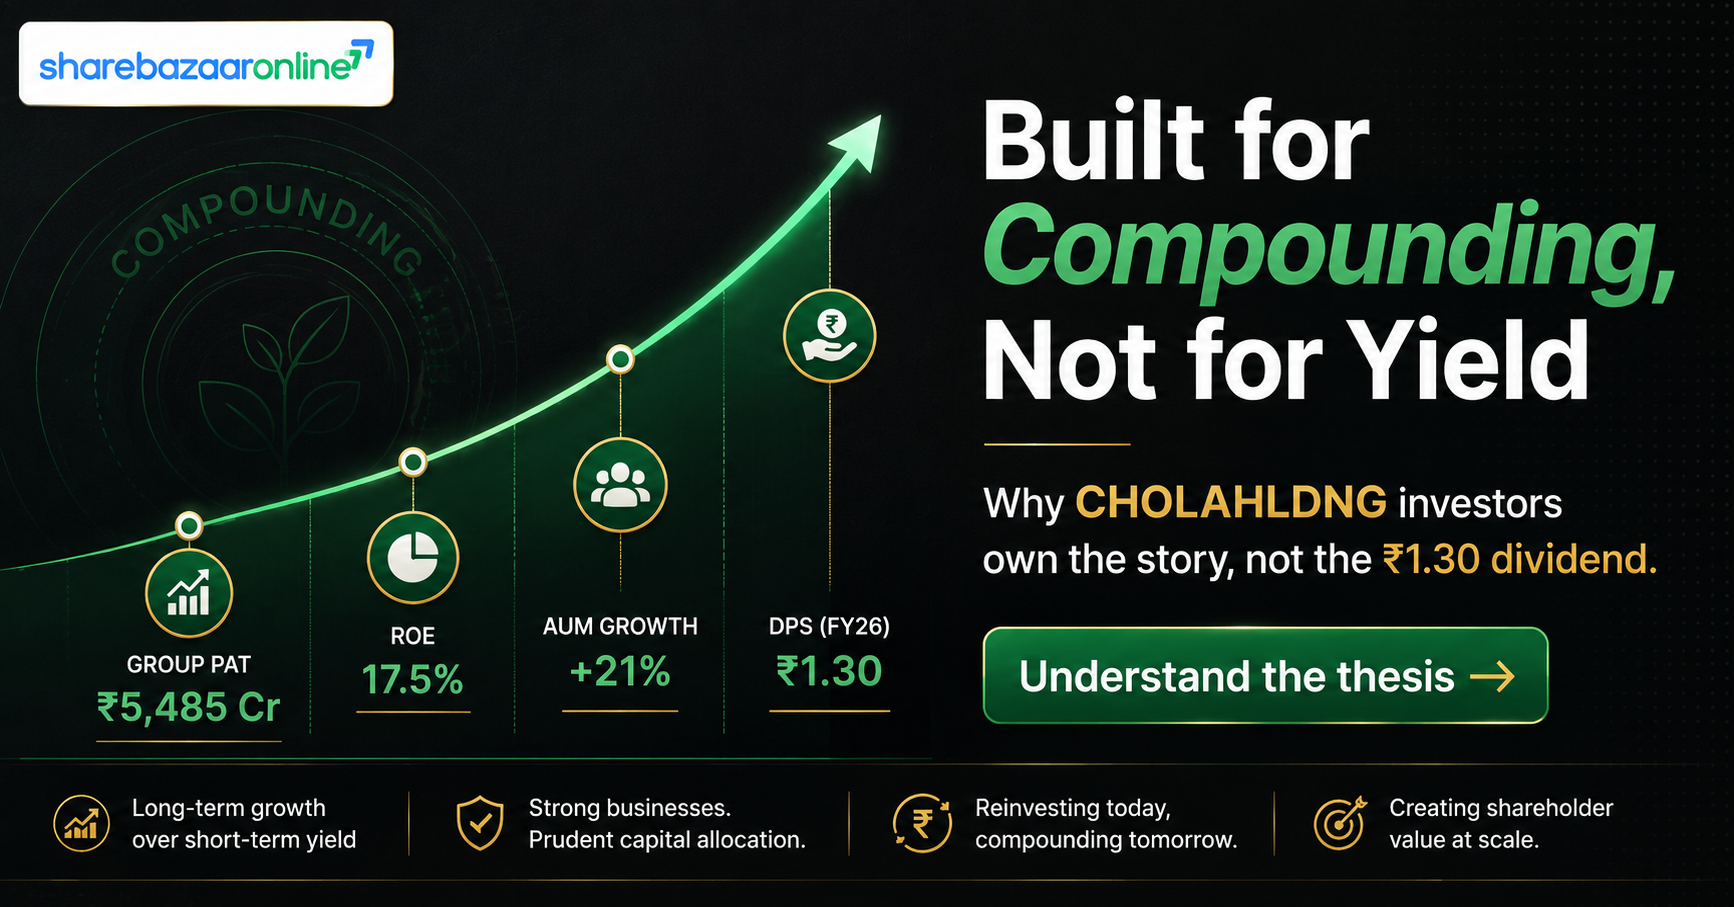
₹1.30
Final dividend, FY26 (130% of Re 1 face value)
Dividend Yield (at current price)
~0.08%
On CMP of ~₹1,553 (NSE, 19-Aug-2026)
Record Date / Ex-Date
07-Aug-2026
Both fall on the same day under the T+1 cycle
Payment
By 12-Sep-2026
Approved by shareholders at the 77th AGM on 14-Aug-2026
The single most useful thing to understand about this stock is that Cholamandalam Financial Holdings is a holding company (a Core Investment Company registered with the RBI). It does not run an operating business of its own; it owns stakes in the NBFC Cholamandalam Investment & Finance (CIFCL) and in Cholamandalam MS General Insurance. That structure changes how every dividend number below should be read, which is exactly what this analysis works through.
Dividend Announcement Summary
At its board meeting on 8 May 2026, the Board of Directors of Cholamandalam Financial Holdings recommended a final dividend of ₹1.30 per equity share (130%) of face value Re 1, out of the profits for the year ended 31 March 2026. The recommendation was placed before shareholders for approval at the company's 77th Annual General Meeting.
The 77th AGM was held via video conference on 14 August 2026, and the company has confirmed to the exchanges that all resolutions, including the final dividend, were approved by shareholders with the requisite majority. The dividend has therefore moved from "recommended" to declared and approved. The same board meeting also noted a change in Key Managerial Personnel: Mr N Ganesh stepped down as CFO and Manager (close of business 14 June 2026) and Mr Shyam Shankar was appointed CFO and Manager from 15 June 2026.
Key Dates Timeline
| Event | Date | Notes |
|---|---|---|
| Board Recommendation | 08-May-2026 | Announced with FY26 audited results |
| Record Date | 07-Aug-2026 (Fri) | For AGM and dividend eligibility |
| Ex-Date | 07-Aug-2026 (Fri) | Same as record date under T+1 |
| 77th AGM | 14-Aug-2026 (Fri) | Dividend approved by shareholders |
| Payment | On or before 12-Sep-2026 | Electronic mode, within 30 days of AGM |
A quick note on eligibility: because the ex-date and record date are the same day (a feature of the T+1 settlement cycle), any investor who bought the share on or after 7 August 2026 does not receive this dividend. The eligibility window has already closed.
Dividend Yield Analysis
The dividend percentage quoted by the company (130%) is calculated on the face value of Re 1, not on what you pay to buy the share. That is why "130%" and "0.08% yield" can both be true at the same time. Translating the payout to the real market price is the single most important reframing for any reader.
Yield on Face Value
130%
₹1.30 on Re 1 — a headline number, not a return
Yield on Market Price
~0.08%
₹1.30 ÷ ~₹1,553 CMP
Yield reality check. On the announcement-day price of roughly ₹1,785 the yield was about 0.07%; on the current price of ~₹1,553 it is about 0.08%. That small rise in yield is not the result of a bigger dividend — the per-share payout is unchanged from last year. It reflects a falling share price (the stock is down roughly 15% over the past year, well off its 52-week high near ₹2,064). A yield that rises because the price fell is a very different signal from a yield that rises because the dividend grew.
Announcement-day CMP of ~₹1,785 is an approximate intraday figure and should be re-verified against the exchange closing price of 8 May 2026 before publication.
Dividend History Analysis
| Financial Year | Dividend / Share | Change vs Prior Year |
|---|---|---|
| FY21 | ₹0.55 | — |
| FY22 | ₹0.55 | Flat |
| FY23 | ₹0.55 | Flat |
| FY24 | ₹0.55 | Flat |
| FY25 | ₹1.30 | +136% (step-up) |
| FY26 | ₹1.30 | Flat |
The pattern here is important and easy to misread. The dividend sat at ₹0.55 for four straight years (FY21–FY24), then more than doubled to ₹1.30 in FY25, and has now been held flat at ₹1.30 in FY26. In other words, this year's dividend is not an increase — it repeats last year's amount. The company is best described as a consistent but conservative payer that resets the payout in occasional steps rather than raising it every year.
Corporate action caution. Comparisons that stretch back before FY17 are misleading for this stock. The company (then TI Financial Holdings) demerged Tube Investments of India in 2016, after which its equity capital and profile changed materially — it became a pure financial holding company. Dividend and per-share figures from that earlier era are not on a like-for-like basis and have been excluded from the table above.
Financial Performance Analysis
Because Cholamandalam Financial Holdings is a holding company, its numbers come in two very different flavours. The consolidated accounts roll up the giant NBFC and insurance subsidiaries; the standalone accounts show only the tiny parent whose income is essentially the dividends it collects from those subsidiaries. Both matter, for different reasons.
Consolidated (FY26)
- Total income: ₹39,576 Cr (+18% YoY)
- Profit before tax: ₹7,333 Cr
- Net profit (total): ₹5,485 Cr (+16%)
- Attributable to owners: ₹2,441 Cr
- Consolidated EPS: ₹130.01
Standalone (FY26)
- Total income: ₹89.79 Cr
- — of which dividend income: ₹74.88 Cr
- Net profit: ₹70.41 Cr
- Standalone EPS: ₹3.75
- Net worth: ₹1,400 Cr (debt-free)
The minority-interest gap you must not ignore. Of the ₹5,485 Cr consolidated profit, only about ₹2,441 Cr (44.5%) actually belongs to CFHL's own shareholders; the remaining ₹3,044 Cr (55.5%) is non-controlling (minority) interest — the share of profit owned by other CIFCL and insurance shareholders. This is why the correct earnings-per-share for dividend coverage is ₹130.01 (owners' EPS), and not the far larger figure you would get by dividing total group profit by the share count. Group headline profit flatters the parent's true entitlement.
Cash Flow Analysis
Reported profit is an accounting opinion; cash is a fact. For most companies we would ask whether operating cash flow covers the dividend. For this group that question needs to be asked at the right level, because the two sets of accounts tell opposite-looking stories.
Consolidated cash flow
Consolidated operating cash flow was negative ~₹30,033 Cr and free cash flow negative ~₹30,365 Cr in FY26. For a lending group this is structurally normal, not a red flag: an NBFC consumes cash as it grows its loan book (CIFCL's assets under management grew about 21% to ~₹2.42 lakh crore). The negative number funds new loans, which are financed by borrowings, not by the parent's dividend.
Standalone cash flow (where the dividend is paid)
At the parent, operating cash flow was +₹24.13 Cr against a dividend outflow of ₹24.41 Cr — a coverage of about 0.99x. The current year's operating cash flow only just matches the payout, but the parent sits on ₹110.6 Cr of liquid balances plus ₹1,293 Cr of investments, so short-term coverage is not a concern.
Where does the dividend actually come from? The parent collected ₹74.88 Cr in dividend income from its group companies during FY26 and paid out ₹24.41 Cr to its own shareholders. So the dividend is funded out of current dividend receipts, covered about 3.07x — not from reserves, asset sales, or borrowings. The FCF-vs-earnings framework that we apply to operating companies is simply the wrong tool here; the right tool is the flow of dividends up from the subsidiaries.
Balance Sheet Strength
Parent (standalone)
- Net worth: ₹1,400 Cr
- Cash & bank: ₹110.6 Cr
- Investments: ₹1,293 Cr
- Borrowings: Nil (debt-free)
Group (consolidated)
- Consolidated book value: ~₹823 / share
- Return on Equity: ~17.5%
- Return on Capital Employed: ~9.75%
- Group borrowings: ~₹2.10 lakh Cr (mostly CIFCL)
The parent balance sheet is clean and debt-free — it is essentially a portfolio of shareholdings in group companies. The large consolidated borrowings sit inside the NBFC subsidiary and are matched by its loan book; they are not a claim on the holding company's dividend capacity. On a group basis the company earns a healthy ~17.5% return on equity, though ROE in FY26 eased slightly as the profit pool grew faster than the payout.
Dividend Sustainability Analysis
For a lending-group holding company, negative group free cash flow is normal, so we assess sustainability using earnings coverage, the flow of dividends up from subsidiaries, and liquidity — not consolidated FCF.
Test 1 — Earnings coverage
Standalone 2.88x · Owners' EPS 100x
₹1.30 covered comfortably by both standalone EPS (₹3.75) and consolidated owners' EPS (₹130)
Test 2 — Dividend-receipt coverage
3.07x
Dividends received (₹74.9 Cr) vs paid (₹24.4 Cr)
Test 3 — Operating cash flow (standalone)
~0.99x
Current-year OCF only just matches the payout — the one metric worth watching
Test 4 — Liquidity
4.5x liquid / 57x incl. investments
Ample parent-level cushion; debt-free
Verdict: Sustainable. The payout is small relative to the parent's earnings, is funded more than three times over by dividends flowing up from CIFCL and the insurance business, and is backed by a debt-free balance sheet with a large liquidity buffer. The only mild caveat is that standalone operating cash flow (₹24.13 Cr) barely exceeds the outflow this year; the ultimate driver of future dividends is how much cash the subsidiaries choose to send up to the parent.
Peer Comparison
| Company | Dividend Yield | Payout Ratio | Group ROE |
|---|---|---|---|
| Cholamandalam Fin. Holdings | ~0.08% | ~1% (consol.) / ~35% (standalone) | ~17.5% |
| Bajaj Holdings & Investment | ~1.4% | ~17% | — |
| Tata Investment Corporation | — | — | — |
Against other listed investment/holding companies, Cholamandalam Financial Holdings stands out as a very low-yield name. Peers such as Bajaj Holdings & Investment run trailing yields north of 1%. The difference is philosophical, not a defect: CFHL is a growth-and-retention holding company whose value comes from the compounding of its stakes (especially the fast-growing CIFCL), whereas classic investment companies distribute a larger slice of income. Blank cells are left blank rather than estimated where reliable peer data was not confirmed.
Promoter Impact Analysis
Promoter Holding (Mar-2026)
46.38%
Murugappa family / group entities
Promoter's Share of the Dividend
~₹11.3 Cr
of the total ~₹24.4 Cr outflow
On a total dividend outflow of about ₹24.4 Cr, the promoter group's 46.38% holding entitles it to roughly ₹11.3 Cr. Public (retail plus HNI) shareholders, at about 13.3% of the register, receive around ₹3.2 Cr between them, with domestic institutions (~26%) and foreign investors (~14%) taking the balance. The payout is modest enough that it does not meaningfully shift the promoter's cash position; this is not a case of a large dividend being used to route cash to promoters.
Taxation Analysis
Since the Finance Act 2020 abolished the Dividend Distribution Tax, dividends in India are taxed in the hands of the shareholder at their applicable income-tax slab rate. The company deducts TDS at 10% (Section 194) only where a resident individual's total dividend from that company in a financial year exceeds ₹10,000 (higher without a valid PAN). Non-resident holders face different withholding.
Worked example — 1,000 shares, 30% tax slab
- Gross dividend: 1,000 × ₹1.30 = ₹1,300
- TDS: ₹0 (below the ₹10,000 per-company threshold)
- Tax at 30% + 4% cess (≈ 31.2%): ~₹406
- Net dividend in hand: ~₹894
- Net effective yield on CMP: ~0.06%
For a top-slab investor, roughly a third of this already-small dividend is lost to tax, taking the after-tax yield to about 0.06%. The tax drag reinforces the point that CHOLAHLDNG is not held for income.
Key Risks
- Pass-through dependence. The parent has no operating business; its dividend capacity depends entirely on subsidiaries (chiefly CIFCL) continuing to pay dividends upstream. Any RBI-driven capital retention at CIFCL could reduce upstreamed cash.
- Holding-company discount. The stock trades at a discount to the look-through value of its stakes. That discount can widen, hurting price returns regardless of the dividend.
- NBFC credit cycle. The bulk of group profit is CIFCL's lending business. FY26 impairment included a ₹200 Cr management overlay for geo-political risk on the loan portfolio — a sign management sees downside scenarios.
- Insurance drag. The general insurance subsidiary's profit before tax fell to ~₹342 Cr from ~₹650 Cr, with a combined ratio above 100%, pointing to underwriting pressure.
- Low, price-sensitive yield. At ~0.08%, the dividend offers no cushion in a falling market; total return is almost entirely a function of the share price, which is down ~15% over the past year.
What To Monitor
- Dividend income received at the parent. Track the standalone dividend-income line (FY26: ₹74.88 Cr) — it is the true fuel for future payouts.
- CIFCL asset quality and disbursements. AUM grew ~21% and PAT ~23% in FY26; watch Stage-3 (GNPA) trends and whether growth stays profitable.
- Insurance combined ratio. A move back below 100% would signal the underwriting drag is easing.
- The holding-company discount. Watch the gap between market cap (~₹29,000 Cr) and the look-through value of the CIFCL and insurance stakes.
- Payout policy. Whether the board lifts the dividend above ₹1.30 (held flat for two years) or continues to prioritise reinvestment.
Conclusion
Cholamandalam Financial Holdings' FY26 final dividend of ₹1.30 is a headline "130%" that translates to a real yield of only about 0.08%. It is flat versus last year, not an increase, and its slightly higher yield reflects a weaker share price rather than dividend growth. Read through the holding-company structure, the payout is comfortably sustainable — funded roughly three times over by dividends flowing up from CIFCL and the insurance arm, backed by a debt-free parent with ample liquidity — but it is immaterial as an income stream. This is a stock investors own for the compounding of its underlying financial-services franchise, not for its dividend. The positives (strong group earnings, clean parent balance sheet, well-covered payout) and the negatives (near-zero yield, holding-company discount, insurance and credit-cycle risks) are laid out above for readers to weigh for themselves.
Frequently Asked Questions
What dividend has Cholamandalam Financial Holdings announced for FY26?
What is the dividend yield on CHOLAHLDNG?
What is the record date for the Cholamandalam Financial Holdings dividend?
What is the ex-dividend date?
When will the dividend be paid?
Who is eligible to receive this dividend?
How is this dividend taxed?
Is the Cholamandalam Financial Holdings dividend sustainable?
What is the dividend history of CHOLAHLDNG?
Why is the consolidated payout ratio only 1%?
Why is consolidated cash flow negative if the company is profitable?
What should investors monitor going forward?
Disclaimer
This article is for informational and educational purposes only and does not constitute investment, financial, legal, or tax advice, nor a recommendation to buy, sell, or hold any security. ShareBazaar Online is not registered with SEBI as an investment adviser or research analyst. Figures are drawn from the company's regulatory filings and publicly available sources; market prices, yields, and third-party data are indicative, change continuously, and should be independently verified. Certain items marked as approximate or "Not Independently Verified" require confirmation. Investments in securities are subject to market risks; please read all related documents carefully and consult a qualified, registered financial adviser before making any investment decision. ShareBazaar Online accepts no liability for any loss arising from the use of this information.