
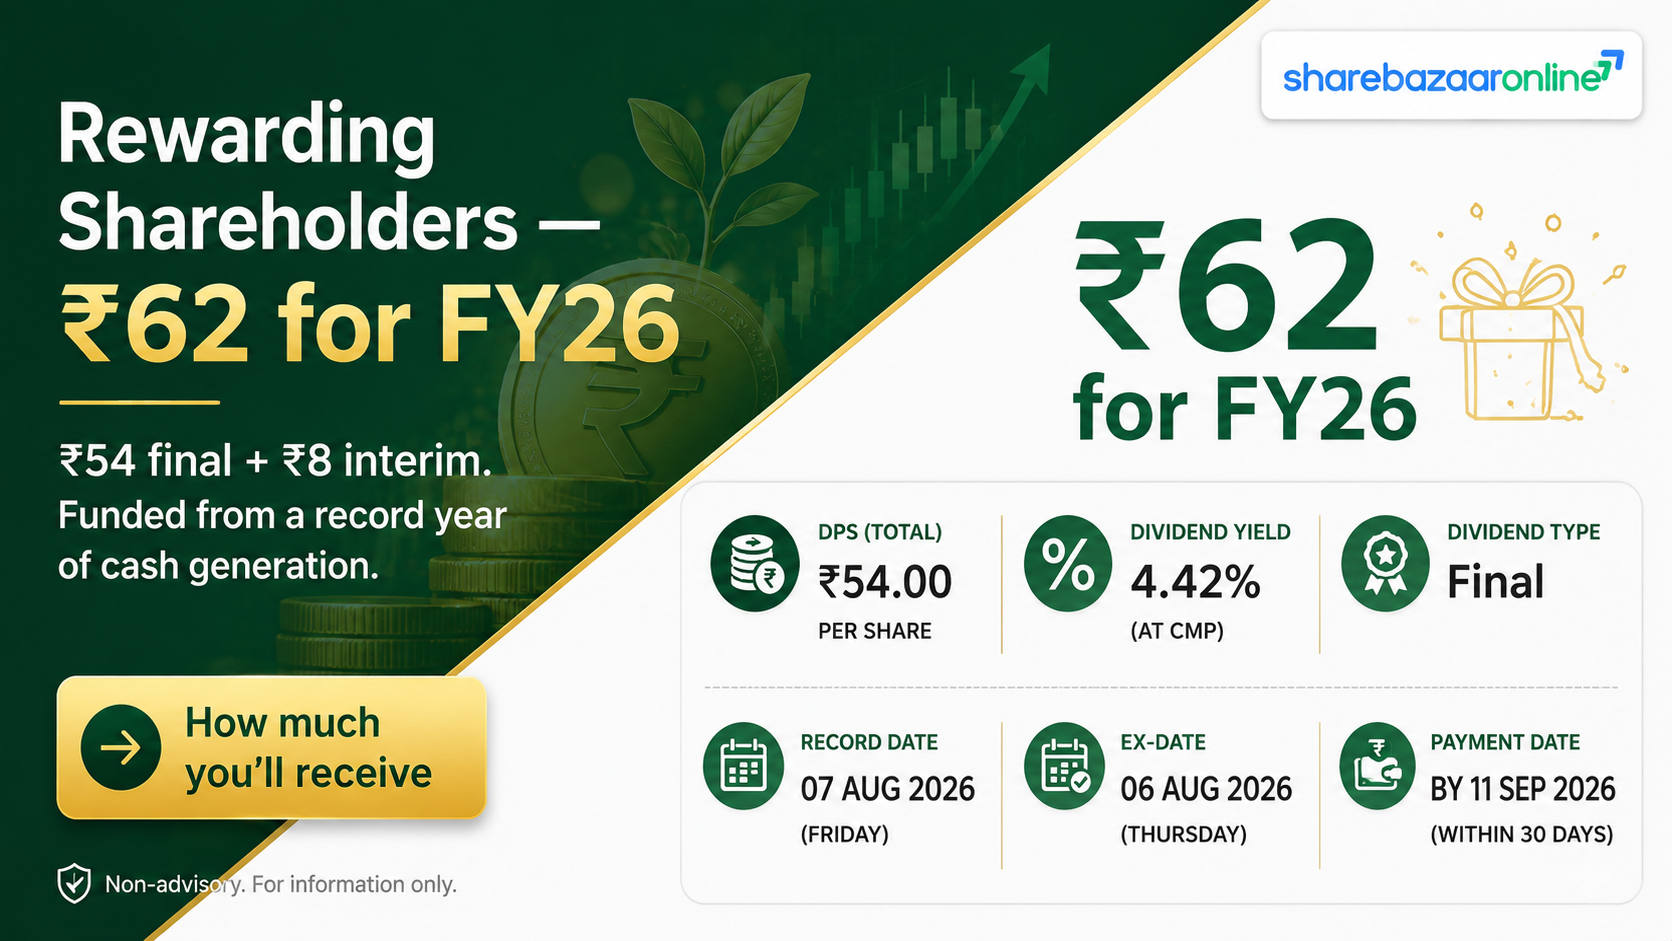
Dividend Snapshot
Chennai Petroleum Corporation Limited (CPCL) — the IOCL group refiner trading as CHENNPETRO (BSE: 500110) — has recommended a final equity dividend of 540%, i.e. ₹54 per share of face value ₹10 for FY2025-26. Read alongside the ₹8 interim dividend already paid during the year, the total Chennai Petroleum dividend for FY26 works out to ₹62 per share.
Final Dividend (recommended)
₹54.00 / share (540%)
Subject to shareholder approval at the AGM.
Total FY26 Equity Dividend
₹62.00 / share (620%)
₹54 final + ₹8 interim.
Dividend Yield (total, latest CMP)
4.42%
₹62 on CMP ~₹1,404. Final-only yield: 3.85%.
Consolidated PAT / EPS (FY26)
₹3,102.70 Cr
EPS ₹208.36 vs ₹14.38 in FY25.
The one thing to understand first: the eye-catching “540%” is a percentage of the ₹10 face value, not of the market price. On the current market price of roughly ₹1,404, the real cash return from the final dividend is about 3.85% — respectable, but a fraction of the headline number.
Dividend Announcement Summary
At its board meeting on 24 April 2026, the CPCL board recommended a final equity dividend of ₹54 per equity share (540% of ₹10 face value) for FY2025-26. The company stated the final dividend would be paid within 30 days of declaration at the AGM, and that the record date would be intimated separately.
Equity dividend
Final ₹54/share, in addition to the ₹8/share interim already declared during FY26. Total ₹62/share for the year.
Preference dividend
Separately, a 6.65% preference dividend of ₹15.94 Cr was recommended on preference shares outstanding up to their redemption on 23 September 2025.
The FY26 results carried an unmodified (clean) audit opinion from R.G.N. Price & Co. As a government company, the accounts remain subject to supplementary audit by the Comptroller and Auditor General (CAG) under Section 143(6)(a). One governance item is disclosed in the auditor’s “Other Matters”: the company did not have the minimum number of Independent Directors, including a Woman Independent Director, during the reporting year — the opinion is not modified for this, but it is a live governance flag.
Key Dates Timeline
Board Meeting / Announcement
24 April 2026
Record Date
7 August 2026
Ex-Dividend Date
7 August 2026
AGM (final approval)
26 August 2026
Payment Date
On/about 23 September 2026
Financial Year
FY2025-26
Important nuance on eligibility: under the T+1 settlement cycle, the ex-date and record date for a cash dividend typically fall on the same day. To be eligible for this Chennai Petroleum dividend, an investor needed to hold shares as of the record date of 7 August 2026. Because this is a final dividend, actual payment follows shareholder approval at the AGM. The record date, ex-date and AGM date were confirmed after the 24 April filing (which had left the record date open); readers and desks should verify each against the official NSE/BSE record-date circular before relying on them.
Dividend Yield Analysis
Dividend yield tells you the cash return relative to the price you pay. Here is the Chennai Petroleum dividend yield at different reference points:
Final ₹54 on latest CMP (~₹1,404)
3.85%
Total ₹62 on latest CMP (~₹1,404)
4.42%
Final ₹54 on announcement-window price (~₹1,028)
~5.25%
Total ₹62 on announcement-window price (~₹1,028)
~6.03%
Yield Reality Check
Notice how the yield falls as the price rises — from ~5.25% around the announcement window to 3.85% at the current price of ~₹1,404. That drop is not a dividend cut; it reflects the stock re-rating sharply higher (up roughly 120% over the past year) on the back of a refining-margin recovery. In other words, the lower current yield is a symptom of a rising share price, not a weaker payout. Anyone quoting a “5%+ yield” is anchoring to an older, lower price. CMP and therefore live yield must be re-checked at the moment of publication.
Dividend History Analysis
| Financial Year | Dividend Payout Ratio | Comment |
|---|---|---|
| FY2019 | 0% | Loss year — no dividend |
| FY2020 | 0% | Loss year — no dividend |
| FY2021 | 0% | No dividend |
| FY2022 | ~2% | Token resumption |
| FY2023 | ~11% | Strong profit year |
| FY2024 | ~30% | Healthy payout |
| FY2025 | ~35% | Payout high on a depressed profit base |
| FY2026 | ~30% | ₹62 total on record profit |
Payout ratios sourced from public financial databases; verify against annual reports before publication.
Classification: Cyclical / Irregular Payer
The Chennai Petroleum dividend history is not that of a steady dividend compounder. The company paid nothing in FY2019, FY2020 and FY2021, then resumed and scaled up as profits recovered. This is the classic signature of a standalone refiner: dividends track the refining cycle. The good news is that when profits are strong, management has been willing to share them — the FY26 total of ₹62 is the richest in the company’s recent history. The caution is that a single weak-margin year can compress or interrupt the payout, exactly as it did last cycle.
Financial Performance Analysis
Revenue from Operations (Consolidated)
₹78,610.79 Cr
vs ₹71,049.95 Cr in FY25 (+10.6%)
Profit Before Tax
₹4,162.47 Cr
vs ₹248.66 Cr (+1,574%)
Net Profit (PAT)
₹3,102.70 Cr
vs ₹214.09 Cr (+1,349%)
Gross Refining Margin (GRM)
US$9.28 / bbl
vs US$4.22 / bbl (+120%)
Operating Leverage & Base-Effect Decomposition
Here is where analysis beats the wire copy. Revenue rose a modest +10.6%, yet PAT exploded +1,349%. That gap is not a step-change in the business — it is refining operating leverage working off a depressed base. Two levers did the heavy lifting: the gross refining margin more than doubled from US$4.22 to US$9.28 per barrel, and crude throughput rose +12% to a record 11.71 MMT. Because a refiner’s fixed costs barely move, almost every extra margin dollar drops to the bottom line. The flip side is symmetry: FY2025 was a trough year (PAT just ₹214 Cr), so the “1,349% growth” is flattered by that low starting point. This is a margin-cycle recovery, not structural compounding — an essential distinction when judging whether the FY26 dividend is repeatable.
Cash Flow Analysis
Operating Cash Flow (FY26)
₹2,944.96 Cr
OCF is 94.9% of PAT — good cash conversion.
Free Cash Flow (OCF − Capex)
₹2,041.90 Cr
After capex of ₹903.06 Cr.
Reported profit is an accounting opinion; cash is a fact. On that test CPCL passes. Operating cash flow of ₹2,944.96 Cr converts nearly all of the ₹3,102.70 Cr profit into actual cash, and after capex the company generated ₹2,041.90 Cr of free cash flow. The total equity dividend of ~₹923 Cr is therefore funded out of current-year cash generation, not by drawing down reserves, selling assets, or fresh borrowing. One honest caveat: working capital swung heavily (inventory build of ~₹1,661 Cr), which is normal for a refiner riding higher crude volumes but does make a single year’s cash flow lumpy.
Balance Sheet Strength
Total Borrowings
₹1,951.18 Cr
Debt-to-Equity 0.18 (was 0.38 in FY25)
Cash + Bank + Current Investments
₹1,342.18 Cr
Net debt ~₹609 Cr against liquid assets.
Total Equity (Consolidated)
₹11,109.21 Cr
Book value ~₹746/share.
Current Ratio
1.43
Improved from 1.00 in FY25.
The balance sheet has visibly de-levered. Debt-to-equity roughly halved to 0.18, the current ratio improved to 1.43, and the company redeemed ₹810 Cr of non-convertible debentures in July 2025 alongside ₹500 Cr of preference capital. Net debt against liquid assets is modest at ~₹609 Cr. A stronger, lighter balance sheet is precisely what gives the board room to pay a record dividend while still funding capex.
Dividend Sustainability Analysis
| Sustainability Test | Coverage | Verdict |
|---|---|---|
| Earnings coverage (EPS ₹208.36 / total DPS ₹62) | 3.36x | Comfortable |
| Operating cash flow / total equity dividend | 3.19x | Comfortable |
| Free cash flow / total equity dividend | 2.21x | Comfortable |
| Liquidity (cash+bank+inv) / total equity dividend | 1.45x | Adequate |
Verdict: Sustainable for FY26 — but cyclically conditional
On all four tests the FY26 payout is well covered: earnings cover it 3.36x, free cash flow 2.21x, and the payout ratio of ~30% is conservative. So for this year, the dividend is comfortably affordable and internally funded. The honest qualification is that this comfort is a function of an unusually strong refining margin. Sustainability here means “sustainable while the cycle holds.” If GRMs revert toward the FY25 trough, both profit and the dividend would likely compress — which is exactly what the company’s own history shows. Treat the ₹62 as a peak-cycle payout, not a floor.
Peer Comparison
| Metric | CPCL (CHENNPETRO) | MRPL | IOCL (parent) |
|---|---|---|---|
| Dividend Yield | 4.42% | ~2.0% | Not Independently Verified |
| Return on Equity | 31.8% | 31.9% | Not Independently Verified |
| Return on Capital Employed | 34.9% | 25.8% | Not Independently Verified |
| Dividend Payout Ratio | ~30% | ~36% | Not Independently Verified |
| Stock P/E | ~5.0x | Not Independently Verified | Not Independently Verified |
MRPL is the closest structural peer (the other listed standalone refiner). IOCL is the parent/marketing arm; its yield and returns operate on a different, marketing-heavy model and current figures are left unverified rather than estimated.
Against its nearest peer MRPL, CPCL screens as the higher-yield, higher-ROCE option this cycle, with a comparable return on equity but a lower valuation multiple (~5x P/E). Both are cyclical standalone refiners, so their dividend attractiveness rises and falls together with refining margins.
Promoter Impact Analysis
Promoter Holding
67.29%
IOCL 51.89% + Naftiran Intertrade (NICO) 15.40%.
Promoter Dividend Income (total equity)
~₹621 Cr
67.29% of the ~₹923 Cr equity outflow.
With a 67.29% promoter block, the majority of every dividend rupee flows to the promoters. Of the ~₹923 Cr total equity dividend, roughly ₹621 Cr goes to the promoter group. Parent IOCL alone receives about ₹479 Cr from the equity dividend, plus the entire ₹15.94 Cr preference dividend — around ₹495 Cr in total. The Iranian promoter entity NICO’s 15.40% maps to roughly ₹142 Cr. Public and institutional shareholders (the ~32.7% free float) share the remaining ~₹302 Cr. The key takeaway for a minority investor: this is a high dividend, but it is also a substantial cash upstreaming to a cash-hungry parent — a recurring feature of PSU subsidiaries. It is a genuine benefit to minorities, just not a promoter-neutral one.
Taxation Analysis
Since April 2020, dividends are taxed in the hands of the investor at their applicable income-tax slab rate — there is no separate Dividend Distribution Tax. The company deducts TDS at 10% (Section 194) once total dividends to a resident shareholder cross the annual threshold of ₹10,000 in a financial year (20% if PAN is not furnished). That TDS is only an advance — final liability is settled at your slab when filing.
Worked Example — 1,000 shares, final dividend ₹54, 30% slab
| Gross dividend (1,000 × ₹54) | ₹54,000 |
| Less: TDS @ 10% | ₹5,400 (credited to you against final tax) |
| Amount credited to bank | ₹48,600 |
| Total tax @ 31.2% (30% + 4% cess) | ₹16,848 |
| Additional tax payable at filing | ₹11,448 |
| Net dividend after full tax | ₹37,152 |
| Effective post-tax yield (on ~₹1,404 CMP) | ~2.65% |
Illustrative for a top-slab resident individual; surcharge may apply at higher incomes. Not tax advice — consult a qualified professional for your situation.
Key Risks
- Refining-margin cyclicality. The entire FY26 story rests on GRMs jumping from US$4.22 to US$9.28/bbl. Margins are set by global product cracks and crude differentials outside the company’s control; a reversion would hit profit and the next dividend hard.
- Single-segment, single-refinery concentration. CPCL operates in one segment (petroleum) from its Manali refinery. Any planned or unplanned shutdown directly dents throughput and earnings.
- Crude sourcing / sanctions exposure. With an Iranian entity (NICO) in the promoter group and geopolitically sensitive crude procurement, sourcing and sanctions dynamics are a structural overhang.
- Related-party / parent dependence. The bulk of sales (over ₹73,800 Cr) is to parent IOCL, and a large slice of dividends flows back to IOCL — minority interests are structurally secondary.
- Governance gap. The auditor flagged a shortfall in Independent Directors, including the absence of a Woman Independent Director, during the reporting year — a board-composition compliance issue pending government appointments.
- Working-capital and crude-price swings. Large inventory movements (~₹1,661 Cr build in FY26) make cash flows lumpy and expose the P&L to inventory losses if crude prices fall sharply.
What To Monitor
- Quarterly GRM trajectory. The single most important number — track whether the gross refining margin holds near recent highs or starts sliding toward mid-cycle levels.
- Crude throughput and refinery utilisation. Watch for shutdown schedules; the FY26 record of 11.71 MMT is the benchmark to beat or defend.
- CBR Petrochemicals / Cauvery Basin project spend. Track the pace of the large capex programme, since heavier investment competes with dividends for free cash flow.
- Debt levels after capex. Monitor whether debt-to-equity stays near 0.18 or creeps up as the expansion draws funding.
- Board composition fix. Watch for government appointment of the required Independent Directors, including a Woman Independent Director, to close the governance gap.
- Dividend policy signals. Note management commentary on whether the elevated FY26 payout is a one-off peak-cycle event or a new baseline.
Conclusion
The Chennai Petroleum FY2025-26 final dividend of ₹54 per share (540%) — ₹62 including the interim — is a genuine, cash-backed reward built on a record refining year. It is comfortably covered by earnings (3.36x) and free cash flow (2.21x), funded from current operations, and paid off a de-levered balance sheet. On today’s price the real yield is about 4.42% total (3.85% on the final alone) — solid, but well short of what the “540%” headline suggests.
The balancing truth is that this is a cyclical, peak-margin payout from an irregular payer that paid nothing just a few years ago, with most of the cash flowing to promoter IOCL and a live governance flag on board composition. The positives (strong coverage, low debt, high ROCE, attractive yield) and the negatives (margin dependence, concentration, sanctions/crude risk, promoter skew) are both real. We present them side by side and leave the decision to you.
Frequently Asked Questions
What dividend has Chennai Petroleum (CPCL) announced for FY2025-26?
What is the Chennai Petroleum dividend yield?
What is the record date for the CPCL dividend?
What is the ex-dividend date for CHENNPETRO?
When will the Chennai Petroleum dividend be paid?
Who is eligible for the CPCL dividend?
How is the CPCL dividend taxed?
Is the Chennai Petroleum dividend sustainable?
What is CPCL’s dividend history?
What should investors monitor going forward?
How much of the dividend goes to promoter IOCL?
Why did CPCL’s profit jump over 1,300% in FY26?
Disclaimer
This article is published by ShareBazaar Online for informational and educational purposes only and is not investment advice. ShareBazaar Online is not a SEBI-registered investment adviser or research analyst. Nothing here is a recommendation to buy, sell or hold any security. Figures are drawn from CPCL’s audited FY2025-26 results filing and publicly available financial databases; market prices, yields and post-filing dates (record date, ex-date, payment date, AGM) may change and must be independently verified against official NSE/BSE circulars before any decision. Dividend approval is subject to shareholders at the AGM. Securities investments are subject to market risks; refining stocks are cyclical and past performance does not indicate future results. Please consult a qualified, registered financial and tax adviser before investing. ShareBazaar Online accepts no liability for any loss arising from the use of this information.