
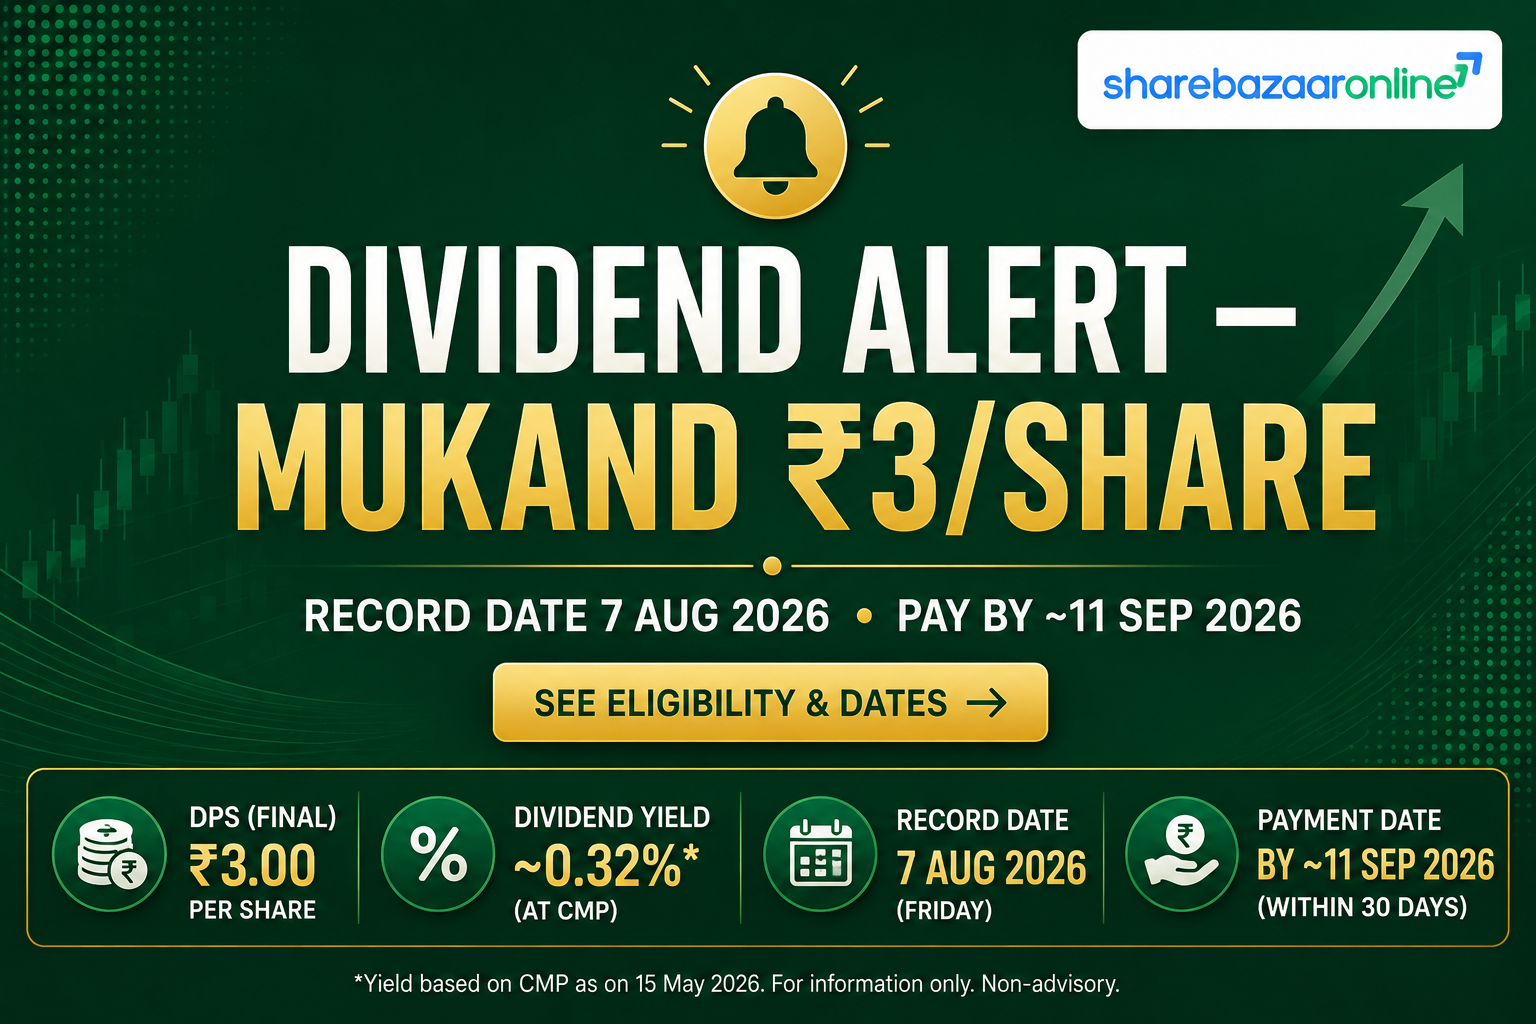
Dividend Snapshot
Mukand Limited (NSE: MUKANDLTD, BSE: 500460), the Bajaj Group specialty-steel and industrial-machinery company, has paid a final dividend of ₹3 per equity share for FY2025-26. The headline "30% dividend" is calculated on the ₹10 face value, not on the market price — on the current price the real dividend yield works out to roughly 2.21%.
Dividend Per Share
₹3.00
30% of ₹10 face value (final dividend, FY2025-26)
Dividend Yield (on current price)
~2.21%
₹3 ÷ ₹135.69 (18-Aug-2026 close)
Record Date
07-Aug-2026
Friday — eligibility cut-off
Total Dividend Outflow
~₹43.3 Cr
₹3 × ~14.44 crore shares
The one-line takeaway: The dividend is small and easily affordable in absolute terms, but FY2025-26 profit was driven almost entirely by a one-time land sale — operating cash flow was negative and core operations ran at a loss. That distinction matters for anyone treating this payout as recurring income.
Dividend Announcement Summary
Per Mukand's exchange filing dated 21-July-2026, the Board recommended a dividend of 30%, i.e. ₹3 per equity share of ₹10 each, for the year ended 31-March-2026. This was placed for shareholder approval at the company's 88th Annual General Meeting.
What the company disclosed
- Dividend type: Final dividend (FY2025-26)
- Rate: 30% on ₹10 face value = ₹3 per share
- Record date: Friday, 07-Aug-2026
- Payment: within 30 days of declaration at the AGM
- Registrar: KFin Technologies Limited
Approval status (important)
A final dividend requires shareholder approval before it becomes binding. Mukand's 88th AGM was held on 12-August-2026, and exchange filings confirm the dividend resolution (along with a ₹500 crore NCD authorisation) was passed with the requisite majority (Source: BSE announcement, 12-Aug-2026). The payout is therefore approved; the payment window runs to on or about 11-September-2026.
A quirk worth noting
The record date (07-Aug) fell before the AGM approval date (12-Aug). This is a common structure where the record date is fixed in advance of a shareholder meeting; eligibility was locked in on 07-Aug, contingent on the AGM approving the payout — which it subsequently did. Separately, some market reports describe ₹1 of the ₹3 as a special dividend marking 100 years of the Bajaj Group (Source: Groww news feed). The company's own record-date letter treats the entire ₹3 as a single final dividend and does not split it, so we flag the "special" component as reported-but-not-formally-designated in the filing.
Key Dates Timeline
| Event | Date | Note |
|---|---|---|
| Board recommendation (at Q4 results) | May 2026 | ₹3/share proposed |
| Record-date intimation to exchanges | 21-Jul-2026 | Filing analysed here |
| Ex-Date | 07-Aug-2026 | Same as record date under T+1 settlement — confirm against exchange circular |
| Record Date | 07-Aug-2026 (Fri) | Eligibility cut-off |
| 88th AGM | 12-Aug-2026 (Wed) | Dividend approved (via VC/OAVM) |
| Payment (outer limit) | by ~11-Sep-2026 | Within 30 days of declaration; exact date Not Disclosed by Company |
Ex-date and payment date should be re-verified against the NSE/BSE circular before publication. The company stated only the record date and a 30-day payment window; a specific payment date was Not Disclosed by Company.
Dividend Yield Analysis
The "30%" is a face-value illusion
New investors often read "30% dividend" and imagine a 30% return. It is not. The 30% is applied to the ₹10 face value, producing ₹3 per share. Your actual yield depends on the price you pay in the market, which is currently around ₹135.69 — roughly 13.5 times the face value. So the real cash return is far smaller.
Real yield maths
- Face-value "yield": 30% (headline, misleading)
- Yield on current price ₹135.69: ~2.21%
- Yield around the July intimation (approx ₹138): ~2.17%
Announcement-window price is approximate and Not Independently Verified from the NSE bhavcopy.
Yield reality check
The trailing yield you may see on data portals (around 1.48%) still reflects the earlier ₹2 paid in FY2025. The higher ~2.21% figure reflects the new, larger ₹3 payout. The uplift comes from a genuine dividend increase (₹2 to ₹3), not from a collapsing share price — the stock is roughly flat over the past year. That is a healthier reason for a rising yield than the alternative.
Dividend History Analysis
| Financial Year | Dividend / Share | Comment |
|---|---|---|
| FY2015 – FY2021 | NIL | No dividend through the loss-making years |
| FY2022 | ~₹1.50 | Dividend resumed |
| FY2023 | ~₹2.00 | Stepped up |
| FY2024 | ~₹2.00 | Held steady |
| FY2025 | ₹2.00 | Paid ~22-Aug-2025 |
| FY2026 | ₹3.00 | Current; reportedly includes a ₹1 centenary special |
FY2022–FY2024 per-share figures are reconstructed from reported payout ratios and EPS (Source: Screener.in, consolidated) and should be confirmed against annual reports before publication.
Classification: recently-resumed / improving payer
Mukand is not a decades-long consistent payer. It went roughly seven years without a dividend (FY2015–FY2021) during a stretch of heavy losses, resumed in FY2022, and has grown the payout from ₹1.50 to ₹3. The trajectory is improving, but the track record is short and tied to a business that is cyclical and asset-heavy. Treat it as a cyclical / recently-rebuilt payer rather than a dependable annuity.
Financial Performance Analysis
The headline profit is misleading
FY2026 consolidated net profit jumped to ₹604 Cr (EPS ₹41.81) from just ₹76 Cr in FY2025 — a headline rise of nearly 700%. But almost the entire jump sits in "other income" of ₹553 Cr, which is about 108% of pre-tax profit. Strip that out and the core business actually ran at an operating-level loss of roughly ₹40 Cr (operating profit ₹172 Cr minus interest ₹150 Cr minus depreciation ₹62 Cr). Source: Screener.in, consolidated.
Operating leverage: FY2025 to FY2026
- Revenue: ₹4,890 Cr to ₹4,890 Cr — flat
- Operating profit: ₹285 Cr to ₹172 Cr — down ~40%
- Operating margin: 5.8% to 3.5% — clear margin compression
- Reported PAT: up ~695% — from other income, not operations
What this tells you
This is a textbook case of profits and operations moving in opposite directions. Sales stayed flat while margins shrank, so the steel and machinery business had a weaker operating year. The record profit is an accounting event created by monetising land, not by selling more steel at better margins. Return ratios remain modest: ROE ~5.6% and ROCE ~4.4% (Source: Screener.in).
Cash Flow Analysis
Reported profit is an opinion; cash is a fact
Despite a reported profit of ₹604 Cr, Mukand's operating cash flow in FY2026 was negative ₹441 Cr (Source: Screener.in, consolidated). This is the single most important number in this analysis. A large book profit with deeply negative operating cash tells you the profit did not arrive as cash from the business.
Where the cash actually came from
- Operating cash flow: –₹441 Cr
- Investing cash flow: +₹472 Cr (asset / land monetisation)
- FY2026 land sales: Kalwa ₹110.83 Cr + Dighe ₹1.02 Cr = ₹111.85 Cr
The year's cash needs, including the dividend, were effectively bridged by selling assets, not by operations.
How the dividend is funded
Because operating cash flow was negative, the ~₹43.3 Cr dividend is not funded by current operating cash. In substance it is funded from asset-sale proceeds and balance-sheet liquidity. On the positive side, the ₹111.85 Cr of land sales alone is 2.6 times the dividend outflow, so affordability is not in question — the quality of the funding is.
Balance Sheet Strength
Debt is rising, not falling
- Borrowings: ₹1,559 Cr (FY25) to ₹1,697 Cr (FY26) — up ~₹138 Cr
- Interest cost: ~₹150 Cr per year
- Interest coverage: low (a stated concern on data portals)
- Book value: ~₹105 per share
Reading the balance sheet
The company is paying a dividend and authorising fresh borrowing (₹500 Cr NCD headroom) while total debt is increasing. Investments on the balance sheet are only ₹40 Cr. Reserves rose to ₹1,378 Cr, boosted by the one-time gains. Credit rating agency CRISIL reaffirmed Mukand's ratings on ₹1,585 Cr of facilities on 17-Aug-2026 (Source: BSE announcement), which is reassuring on near-term solvency, but the direction of debt is worth watching.
Cash and net debt
A precise cash-and-bank balance is Not Disclosed by Company in the summary data used here (it sits within other assets) and should be taken from the annual report. Against gross borrowings of ₹1,697 Cr and investments of ₹40 Cr, the group carries a substantial net-debt position. This is a leveraged balance sheet, which is normal for an integrated steel producer but relevant when judging dividend headroom.
Dividend Sustainability Analysis
| Test | Result | Verdict |
|---|---|---|
| 1. Earnings coverage (EPS ÷ DPS) | 13.9x reported; negative on core | Weak once one-offs removed |
| 2. Operating cash flow coverage | OCF –₹441 Cr | Fails |
| 3. Free cash flow coverage | Negative on operating basis | Fails (asset-sale funded) |
| 4. Liquidity / affordability | ₹43.3 Cr vs ₹111.85 Cr land proceeds | Passes on affordability |
Overall: Moderately Sustainable (with caveats)
The specific ₹3 payout is comfortably affordable — it is a small absolute sum against sizeable asset-sale liquidity. But it is not covered by operating cash flow or by core earnings, and debt is rising. As a recurring rate, especially the reported ₹1 centenary component, the ₹3 is not clearly repeatable from operations. A more durable payout would need the steel and machinery business itself to generate positive operating cash and margins.
Peer Comparison
| Metric | Mukand | Sunflag Iron & Steel | Kirloskar Ferrous |
|---|---|---|---|
| Dividend / share | ₹3.00 | ₹0.75 | ₹3.00 |
| Dividend yield | ~2.21% | ~0.29% | ~1.0–1.6% |
| Payout ratio | ~7% (FY26, inflated EPS) | ~6–7% | ~12% |
| ROE (3-yr) | ~7.9% | ~2.6% | Not Independently Verified |
| Balance sheet | Leveraged (₹1,697 Cr debt) | Almost debt-free | Moderate debt |
| Market cap | ~₹1,956 Cr | ~₹6,650 Cr | ~₹7,500–8,000 Cr |
Peer figures Source: Screener.in / Trendlyne / SimplyWall.st, latest available 2026. Cells marked Not Independently Verified are left unquantified rather than estimated. Peer set is illustrative of the specialty / alloy steel long-products space, not an exhaustive list.
Reading the table
On yield alone, Mukand screens better than debt-free peer Sunflag and broadly in line with Kirloskar Ferrous. But that yield rests on a one-time-boosted year and a more leveraged balance sheet. Sunflag, by contrast, pays less but is almost debt-free. The comparison underlines that Mukand's higher yield is not "free" — it comes with more financial risk.
Promoter Impact Analysis
Who receives the ₹43.3 Cr
- Promoter holding (Bajaj family / group): 74.70%
- Promoter dividend income: ~₹32.4 Cr
- All non-promoter shareholders (25.30%): ~₹11.0 Cr
- FII 0.25% / DII 1.03% / Public ~24.03%
What it means
With nearly three-quarters of the company held by promoters, roughly ₹3 of every ₹4 of the dividend flows to the promoter group. That is not unusual for a tightly held Bajaj Group company, but it is worth understanding: the payout is a channel that largely returns cash to the controlling shareholders. Minority investors receive a proportionate but much smaller share.
Taxation Analysis
How dividends are taxed in India
Since April 2020, dividends are taxed in the hands of the shareholder at their applicable income-tax slab rate (there is no separate dividend distribution tax). The company deducts TDS at 10% under Section 194 if your total dividend from that company in a financial year exceeds ₹10,000 (20% if PAN is not provided).
Worked example: 1,000 shares at ₹3
- Gross dividend: 1,000 × ₹3 = ₹3,000
- Tax at 30% slab + 4% cess (31.2%): ₹936
- Net dividend in hand: ₹2,064
- TDS: gross ₹3,000 is below the ₹10,000 threshold, so no TDS is deducted on this holding
- Post-tax yield on ₹135.69: ~1.52%
A 5% or 20% slab investor keeps more; a larger holding whose dividend crosses ₹10,000 would see 10% TDS, adjustable against final tax. This is general information, not tax advice — consult a qualified professional.
Key Risks
- Earnings quality: FY2026 profit was ~108% "other income" — a one-time land-sale gain. Core operations ran at an operating loss (~₹40 Cr). Reported profit is not a guide to repeatable earning power.
- Negative operating cash flow: OCF was –₹441 Cr in FY2026. Persistent negative operating cash makes dividends dependent on asset sales or borrowing.
- Rising leverage: Borrowings climbed to ₹1,697 Cr with a fresh ₹500 Cr NCD authorisation and low interest coverage. Rising steel-cycle rates could pressure cash further.
- Cyclicality & margins: Operating margin fell from 5.8% to 3.5%. Steel prices, raw-material costs and auto-sector demand are volatile and outside the company's control.
- Finite asset monetisation: Land sales that funded this year are one-off. Once surplus land is exhausted, this cushion disappears.
- Low liquidity / free float: With 74.70% promoter holding and thin institutional interest, the stock can be illiquid and price moves can be sharp.
What To Monitor
- Operating cash flow trend: Does OCF turn positive in FY2027? This is the single best test of whether future dividends can be paid from the business.
- Core operating margin: Watch whether OPM recovers from 3.5% toward the 6% range seen in FY2024–FY2025.
- Debt trajectory: Is borrowing (currently ₹1,697 Cr) coming down, and how much of the ₹500 Cr NCD authority is actually drawn?
- Quality of profit: In upcoming quarters, how much of profit before tax is real operating profit versus other income?
- Dividend continuity: Whether the base rate settles back to ₹2 once the reported ₹1 centenary special drops away.
- Steel-cycle indicators: Alloy/stainless steel prices, auto and bearing demand, and input (scrap, nickel, ferro-alloys) costs.
Conclusion
Mukand Limited's ₹3 per share final dividend for FY2025-26 is a genuine step up from the ₹2 it paid in the prior three years, and on the current price it offers a real yield of about 2.21% — not the "30%" the headline face-value figure implies. In absolute terms the ~₹43.3 Cr payout is small and easily affordable.
The important nuance — the one wire services tend to skip — is where the money came from. FY2026's record profit was almost entirely a one-time land-sale gain; the steel and machinery business itself ran at an operating loss, operating cash flow was negative ₹441 Cr, and debt rose. The dividend is affordable, but it is funded by asset monetisation and balance-sheet liquidity rather than by operating cash. That makes the payout moderately sustainable at best and, at this elevated level, not clearly repeatable from operations.
We present the positives (a rising payout, a strong parent in the Bajaj Group, comfortable near-term affordability, a reaffirmed credit rating) alongside the negatives (weak core earnings, negative operating cash flow, rising leverage). The decision is yours to make.
Frequently Asked Questions
What dividend has Mukand Limited announced?
What is the Mukand dividend yield?
What is the record date for the Mukand dividend?
What is the ex-date for the Mukand dividend?
When will the Mukand dividend be paid?
Who is eligible for the Mukand dividend?
How is the Mukand dividend taxed?
Is the Mukand dividend sustainable?
What is Mukand's dividend history?
Why did Mukand's profit jump nearly 700%?
How much of the dividend goes to the promoters?
What should investors monitor going forward?
Disclaimer
This article is for informational and educational purposes only and does not constitute investment, financial, legal or tax advice, nor a recommendation to buy, sell or hold any security. ShareBazaar Online is not registered with SEBI as an investment adviser or research analyst. Figures sourced from the company's exchange filings, Screener.in, and other public sources are believed to be reliable but are not guaranteed for accuracy or completeness; several items marked "Not Disclosed by Company" or "Not Independently Verified" must be confirmed independently. Market price, yield and date details should be re-verified before acting. Securities markets are subject to risk; past performance and past dividends do not guarantee future outcomes. Readers should consult a SEBI-registered adviser and their own tax professional before making any decision. The author and ShareBazaar Online accept no liability for any loss arising from the use of this content.