
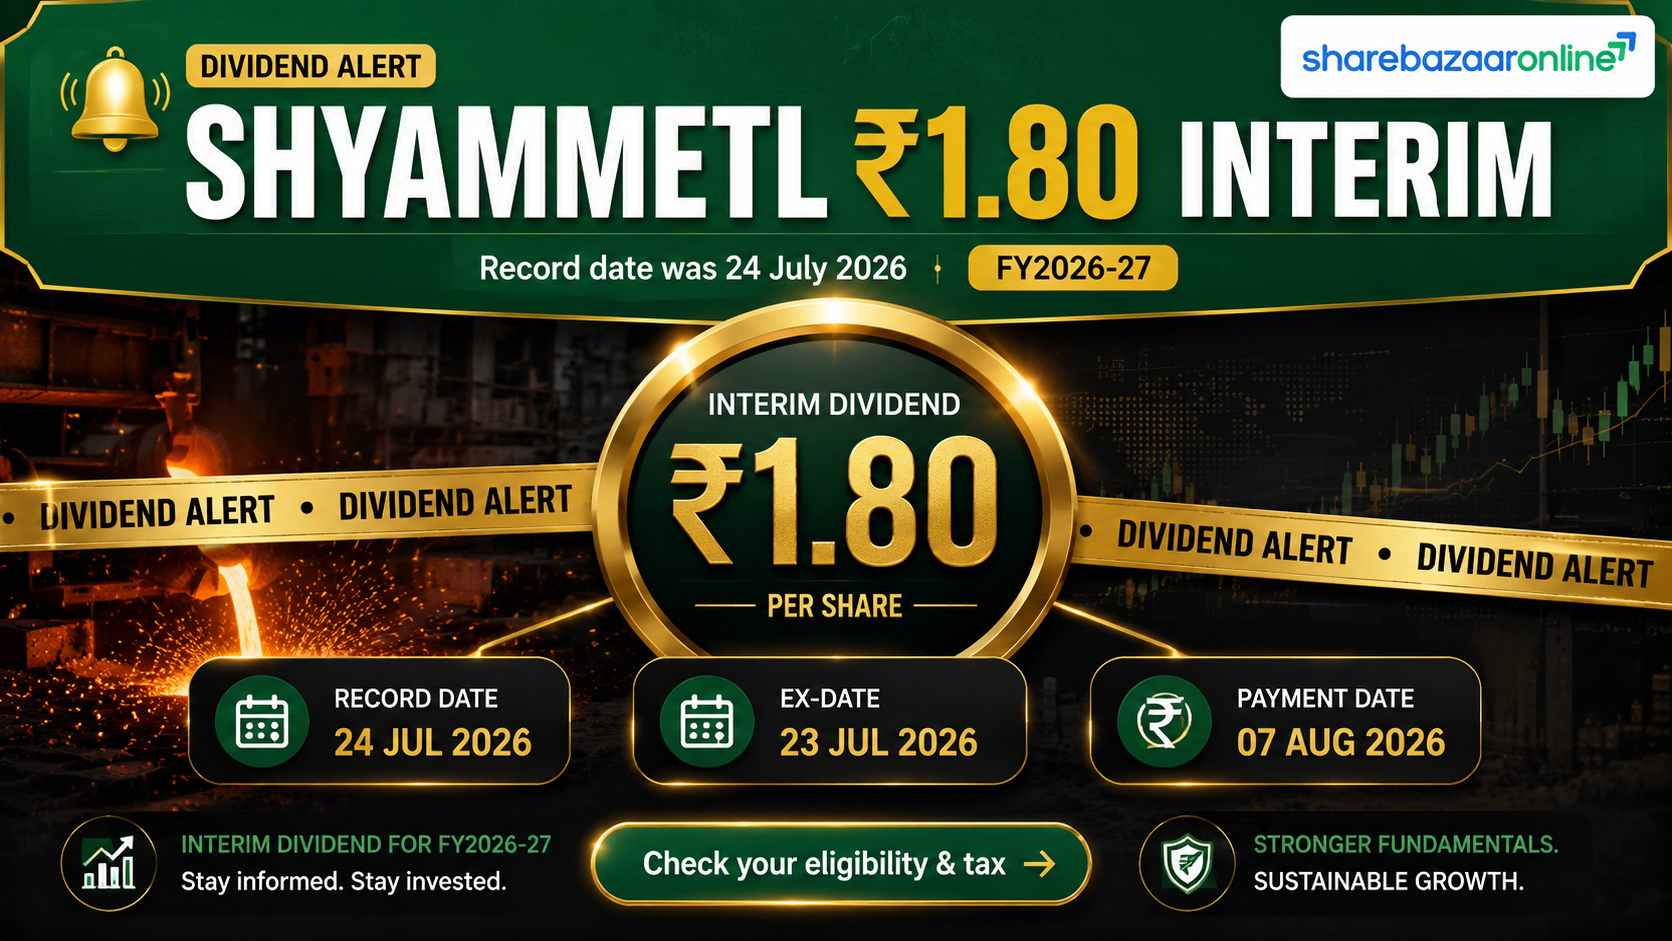
Dividend Snapshot
Dividend Per Share
₹1.80
1st Interim Dividend, FY2026-27 (18% of ₹10 face value)
Real Dividend Yield (at CMP ₹994)
~0.18%
The "18%" headline is on face value, not on the market price
Record Date
Friday, 24 July 2026
Cut-off for eligibility to this interim dividend
Total Interim Dividend Outflow
~₹50.1 crore
On ~27.84 crore equity shares
One-line takeaway: A small, symbolic cash reward (₹50.1 crore) declared at the very same board meeting that sought enabling approval to raise up to ₹4,500 crore — roughly 90 times the payout — while free cash flow has been negative for four years running. The dividend is comfortably covered by operating cash flow and reserves, but it is not funded by free cash flow.
Dividend Announcement Summary
At its board meeting on 20 July 2026, the Board of Shyam Metalics and Energy Limited approved a 1st interim dividend of ₹1.80 per equity share (18% of the ₹10 face value) for the financial year 2026-27, together with its unaudited Q1FY27 results. Because this is an interim dividend, it does not require separate shareholder approval at the AGM — the board's declaration is final.
What was declared
- Interim dividend: ₹1.80/share
- Face value: ₹10 per share
- Percentage on face value: 18%
- Financial year: 2026-27
- Record date: 24 July 2026
- Payment: within 30 days of declaration
The bigger item in the same meeting
The board also approved an enabling resolution to raise up to ₹4,500 crore through equity shares, convertible/non-convertible instruments, QIP, FPO, preferential issue or a combination — subject to shareholder approval at the 24th AGM on 25 August 2026. This is a broad authorisation, not a committed issue, but it signals a large future capital need that dwarfs the dividend.
Do not confuse this with the final dividend. Separately, the company has proposed a final dividend of ₹2.70 per share for FY2025-26 (record date 7 August 2026, subject to approval at the AGM on 25 August 2026). That final dividend belongs to the previous financial year and is a distinct corporate action from the ₹1.80 interim dividend covered here.
Key Dates Timeline
| Event | Date | Note |
|---|---|---|
| Board meeting / Announcement | 20 July 2026 | Interim dividend declared with Q1FY27 results |
| Ex-dividend date | 24 July 2026 (inferred) | Under T+1 settlement, ex-date typically equals record date — confirm against the NSE/BSE circular |
| Record date | 24 July 2026 (Friday) | Eligibility cut-off (as disclosed by company) |
| Payment date | On or before ~19 August 2026 | Statutory 30-day outer limit from declaration; exact date Not Disclosed by Company |
The ex-date is inferred from standard T+1 settlement practice, not confirmed from a primary corporate-action circular. The specific payment date was not disclosed in the filing; the company stated only "within 30 days from the date of declaration."
Dividend Yield Analysis
The filing describes the dividend as "18% of the face value of ₹10." For a retail investor, this number is misleading if read as a yield. The 18% is calculated on the ₹10 face value, giving ₹1.80 per share. The real yield — what you actually earn on money invested at today's price — is far smaller.
The face-value illusion
- Headline: 18% (on ₹10 face value)
- Rupee dividend: ₹1.80 per share
- Current market price (CMP): ~₹994
- Real interim yield: ₹1.80 ÷ ₹994 = ~0.18%
Trailing yield context
Including the recent final dividends, the stock's trailing dividend yield is roughly 0.45%–0.50% — still low, and typical of a company reinvesting almost everything into capacity. Data aggregators show a yield near 0.46%. Shyam Metalics is a growth/reinvestment stock, not an income stock.
CMP of ~₹994 is as of 18 August 2026 and must be re-verified before publication — every yield figure is price-dependent and moves with the market.
Dividend History Analysis
| Record / Ex Date | Dividend/Share | Type |
|---|---|---|
| 24 Jul 2026 | ₹1.80 | Interim (FY27) — this dividend |
| 07 Aug 2026 | ₹2.70 | Final (FY26), proposed — subject to AGM |
| 19 Aug 2025 | ₹2.25 | Final (FY25) |
| 07 Feb 2025 | ₹2.25 | Interim (FY25) |
| 30 Aug 2024 | ₹2.70 | FY24 |
| 05 Jun 2023 | ₹1.80 | FY23 |
| 16 Sep 2022 | ₹2.70 | FY22 |
| 11 Aug 2022 | ₹1.80 | Interim (FY23) |
| FY22 (multiple) | ₹2.25 ×2 | Post-IPO payouts (listed Jun 2021) |
Source: exchange corporate-action records via TipRanks/Trendlyne cross-reference. Fiscal-year tagging of some entries is inferred and should be confirmed against the company's dividend register.
Payout ratio trend (consolidated)
- FY21: 14% FY22: 7% FY23: 5%
- FY24: 12% FY25: 14% FY26: 12%
- 3-year average payout: ~12.5% of profits
Classification: Consistent but low payer
Since its June 2021 IPO, Shyam Metalics has paid dividends every year with no cuts or suspensions. However, the payout ratio has stayed low (5%–14%), reflecting a deliberate choice to retain earnings for expansion. It is best described as a consistent payer with a conservative, growth-first payout policy — not a dividend-growth story.
Financial Performance Analysis
Q1FY27 (quarter ended 30 June 2026, consolidated) vs Q1FY26
| Metric | Q1FY27 | Q1FY26 | YoY |
|---|---|---|---|
| Revenue from operations | ₹5,455.1 cr | ₹4,423.0 cr | +23.3% |
| Operating profit (EBITDA) | ₹812.4 cr | ₹633.2 cr | +28.3% |
| Profit after tax | ₹350.7 cr | ₹290.7 cr | +20.7% |
| Basic EPS | ₹12.60 | ₹10.45 | +20.6% |
Positive operating leverage
EBITDA grew 28.3% against revenue growth of 23.3% — margins expanded, so profit growth is not just a volume story. This is the healthy pattern (profits rising faster than sales), the opposite of margin compression. PAT growth (20.7%) trailed EBITDA growth mainly because of a sharp rise in finance costs (interest ₹78.3 cr in Q1FY27 vs ₹39.8 cr in Q1FY26) and higher depreciation from newly commissioned assets.
Full-year context (FY26, consolidated)
- Revenue: ₹18,552 cr (FY25: ₹15,159 cr)
- Net profit: ₹1,060 cr (FY25: ₹909 cr)
- EPS: ₹38.1 | TTM EPS: ₹40.2
- 5-yr revenue CAGR: ~24%; 5-yr profit CAGR: ~5%
The margin puzzle: revenue has compounded at ~24% over five years but net profit only ~5%. The reason is the steel cycle — FY22 was an exceptional-margin year (net profit ₹1,724 cr) that flatters the base. Since then, operating margins have normalised to ~12–13% and rising interest and depreciation from heavy capex have absorbed much of the topline gain. Earnings quality in Q1FY27 is reasonable: other income was a modest ₹47 cr against ₹5,455 cr revenue.
Cash Flow Analysis
Reported profit is an accounting opinion; cash is fact. Here is the single most important finding of this analysis, and the one that wire reports on the dividend omit entirely.
Operating cash flow is strong — but free cash flow has been negative for four years (consolidated)
| Year | Operating Cash Flow | Free Cash Flow | CFO / Op. Profit |
|---|---|---|---|
| FY23 | ₹1,518 cr | −₹386 cr | 117% |
| FY24 | ₹1,794 cr | −₹93 cr | 126% |
| FY25 | ₹1,713 cr | −₹435 cr | 94% |
| FY26 | ₹2,024 cr | −₹614 cr | 101% |
What this means
The business generates plenty of operating cash (CFO of ~₹2,024 cr in FY26, converting profit to cash at ~101%). But capital expenditure exceeds operating cash flow, so free cash flow is negative. The company is in a heavy expansion phase — new capacity across pellets, aluminium foil, stainless steel and DI pipes.
How the dividend is funded
The ₹50.1 crore interim dividend is covered ~40x by operating cash flow and easily by the ~₹11,245 cr of reserves. But it is not funded by free cash flow, which is negative. In effect, the dividend is paid from operating cash while capex is part-funded by borrowing and reserves — which is exactly why the ₹4,500 crore fund-raise is on the table.
Balance Sheet Strength
Near net-cash balance sheet (FY26)
- Net worth (equity + reserves): ~₹11,523 cr
- Book value: ₹413 per share
- Total borrowings: ₹1,005 cr (only ~8.7% of net worth)
- Investments: ₹1,582 cr
- Screener flag: "almost debt free"
Why the dividend is affordable
With borrowings of just ₹1,005 cr against investments of ₹1,582 cr, the company is effectively in a net-cash position. A ₹50.1 crore dividend is trivial against this base. Debt is not rising to pay the dividend — borrowings are rising to fund capex, a distinction that matters.
Return profile: ROCE is ~13% and ROE ~9.7% (last year), with a 3-year average ROE of ~10.2%. These are modest for the capital deployed — a natural consequence of large work-in-progress capital that is not yet earning. As new plants ramp up, the key question is whether returns improve or whether the capital base keeps outrunning profit.
Dividend Sustainability Analysis
| Coverage Test | Result | Verdict |
|---|---|---|
| Earnings (EPS ÷ DPS) | FY26: 21x; Q1FY27: 7x | Strong |
| Operating cash flow ÷ outflow | ~40x | Strong |
| Free cash flow coverage | FCF negative | Not covered by FCF |
| Liquidity / cash & investments | ~32x (investments ÷ outflow) | Strong |
Overall verdict: Sustainable (funded by operations, not free cash flow)
On three of four tests — earnings, operating cash flow and liquidity — the ₹1.80 interim dividend is comfortably covered. The one caveat is that free cash flow is negative because of expansion capex, so the payout is being made alongside heavy investment rather than out of surplus cash. Given the low ~12–13% payout ratio and near net-cash balance sheet, the dividend itself is not at risk. What investors should watch is the opposite direction: with a ₹4,500 crore raise pending, the company is far more focused on growth than on raising the payout.
Peer Comparison
| Company | Div. Yield | ROE | ROCE | Payout |
|---|---|---|---|---|
| Shyam Metalics | ~0.5% (TTM) | 9.7% | 13.0% | ~12% |
| Tata Steel | ~1.7–2.2% | — | — | high |
| JSW Steel | — | — | — | — |
| SAIL | — | — | — | — |
| Sarda Energy & Minerals | — | — | — | — |
| Godawari Power & Ispat | — | — | — | — |
Cells marked "—" are left blank rather than filled with unverified data (peer figures require desk verification before publication). Tata Steel yield range from public dividend data (₹4.00 DPS on a ~₹187 price).
Read-through: Shyam Metalics sits at the low end of the steel-sector dividend yield range. Large integrated players like Tata Steel run higher yields and payouts because their capex cycles are more mature. Shyam's sub-1% yield is consistent with a smaller, faster-growing producer still building capacity — investors here are paid mainly through capital appreciation, not dividends.
Promoter Impact Analysis
Who receives the ₹50.1 crore
- Promoters (74.59%): ~₹37.4 cr
- DIIs (13.75%): ~₹6.9 cr
- Public (8.42%): ~₹4.2 cr
- FIIs (2.97%): ~₹1.5 cr
- Others (0.27%): ~₹0.1 cr
The DII accumulation signal
The more notable shareholding move is on the institutional side: DII holding jumped from 9.17% (Mar 2026) to 13.75% (Jun 2026) — a sharp quarter of domestic-institution buying — while public shareholding fell from 12.85% to 8.42%. Promoter holding is steady at 74.59% (down from 88.35% pre-2024 after IPO/OFS dilution).
Alignment note: With ~75% promoter ownership, roughly three-quarters of every dividend rupee flows to the promoter group — but so does three-quarters of the value created by reinvestment. The low payout ratio suggests promoters are prioritising compounding inside the company over extracting cash, which broadly aligns their interest with minority shareholders. The pending ₹4,500 crore raise is where alignment must be watched: equity issuance could dilute minority holders if priced at a discount.
Taxation Analysis
How dividends are taxed in India (since FY2020-21)
- Dividends are taxable in the hands of the shareholder at their applicable income-tax slab rate.
- TDS at 10% is deducted by the company if total dividend from that company exceeds ₹5,000 in a financial year (20% if PAN is not provided).
- There is no Dividend Distribution Tax at company level any more — the burden shifted to investors.
Worked example — 1,000 shares, 30% slab
| Shares held | 1,000 |
| Gross dividend (× ₹1.80) | ₹1,800 |
| TDS at source | ₹0 (below ₹5,000 threshold for this company) |
| Tax at 30% + 4% cess | ₹561.60 |
| Net in hand | ₹1,238.40 |
| Post-tax yield (at CMP ₹994) | ~0.125% |
Illustrative only. A 30% slab is used for the worked example; your effective tax depends on your own slab. Even without TDS at source, the dividend must still be declared and taxed in your return.
Key Risks
- Equity dilution from the ₹4,500 crore raise. The enabling resolution allows fresh equity/QIP/FPO issuance of up to ₹4,500 cr. If executed via equity at a discount, existing shareholders face dilution of earnings and voting power.
- Negative free cash flow / capex overrun risk. FCF has been negative for four consecutive years. If new capacity is delayed or under-utilised, returns on the growing capital base could stay depressed.
- ED provisional attachment on a subsidiary. The Directorate of Enforcement issued a Provisional Attachment Order (15 April 2026) on investments of ~₹152.48 cr held by subsidiary Shyam SEL and Power Ltd under PMLA, linked to an alleged coal-purchase investigation. Management refutes any linkage and a Show Cause Notice reply has been filed, but it is an unresolved governance/legal overhang.
- Steel-cycle and commodity margin risk. Operating margins have already normalised from the FY22 peak. Steel prices, coking coal and ferro-alloy realisations are cyclical and can compress EBITDA quickly.
- Rising finance and depreciation costs. Q1FY27 interest nearly doubled YoY (₹78.3 cr vs ₹39.8 cr) and depreciation rose to ₹265 cr as capex is capitalised, both dragging on PAT growth.
- Low dividend yield. At ~0.18% on this interim dividend, income-focused investors gain little; the thesis rests almost entirely on capital appreciation.
What To Monitor
- Fund-raise structure and pricing. Watch the 25 August 2026 AGM and subsequent disclosures for how (and whether) the ₹4,500 cr is raised — equity vs debt, QIP price, and dilution to existing holders.
- Free-cash-flow turn. Track when capex peaks and FCF turns positive. That inflection is the real signal on whether the expansion is paying off.
- Capacity ramp-up and utilisation. Monitor commissioning and utilisation of new pellet, aluminium foil, stainless steel and DI-pipe lines, and their contribution to margins.
- Return ratios (ROE / ROCE) trajectory. Look for ROE moving above the ~10% level as work-in-progress converts to operating assets.
- Resolution of the ED/PMLA matter. Follow the adjudicating authority's decision on the provisional attachment of the subsidiary's investments.
- Payout policy signals. Any move to raise the payout ratio above the ~12% norm would mark a shift from pure reinvestment toward shareholder returns.
Conclusion
Shyam Metalics' ₹1.80 interim dividend is a small, well-covered, symbolic reward from a company that is unmistakably in growth mode. The "18% dividend" headline flatters a real yield of ~0.18%. The payout is easily affordable — ~40x operating-cash-flow coverage and a near net-cash balance sheet — but it is paid alongside a four-year run of negative free cash flow, not out of surplus cash.
Positives
- Consistent dividend payer since IPO, no cuts
- Strong Q1FY27: revenue +23%, EBITDA +28%, PAT +21%
- Near net-cash, "almost debt free" balance sheet
- Dividend covered ~40x by operating cash flow
- DII accumulation into the June 2026 quarter
Negatives / watch-items
- Real yield very low (~0.18%)
- Free cash flow negative for four straight years
- ₹4,500 cr raise — potential dilution
- ED/PMLA provisional attachment overhang
- Modest ROE (~10%) on a growing capital base
In short: buy Shyam Metalics for the capacity-expansion and steel-cycle story, not for the dividend. The ₹1.80 interim payout is a signal of confidence and continuity — not a source of meaningful income. We present the facts; the decision is yours.
Frequently Asked Questions
What dividend has Shyam Metalics announced in 2026?
What is the Shyam Metalics dividend yield?
What is the record date for the Shyam Metalics interim dividend?
What is the ex-dividend date?
When will the dividend be paid?
Who was eligible for the dividend?
How is this dividend taxed?
Is the Shyam Metalics dividend sustainable?
What is the Shyam Metalics dividend history?
Why is the company raising ₹4,500 crore while paying a dividend?
What is the ED/PMLA matter mentioned in the results?
Should I buy Shyam Metalics for its dividend?
What should investors monitor after this dividend?
Disclaimer
This article is for informational and educational purposes only and is a work of financial journalism. It does not constitute investment advice, nor a buy, sell or hold recommendation, and must not be treated as such. ShareBazaar Online is not a SEBI-registered investment adviser or research analyst. All figures are compiled from the company's exchange filings and publicly available secondary sources (including Screener.in, exchange corporate-action records and data aggregators) and may contain errors or become outdated. The current market price (~₹994) and all price-dependent yields are as of 18 August 2026 and must be independently re-verified before any decision. The ex-date is inferred under T+1 settlement and the payment date is stated as a statutory outer limit; both should be confirmed against official NSE/BSE circulars. Peer figures marked with a dash are unverified and intentionally left blank. Investments in securities are subject to market risks; please read all related documents carefully and consult a SEBI-registered financial adviser before investing. ShareBazaar Online and its authors accept no liability for any loss arising from the use of this information.