
Dividend Snapshot
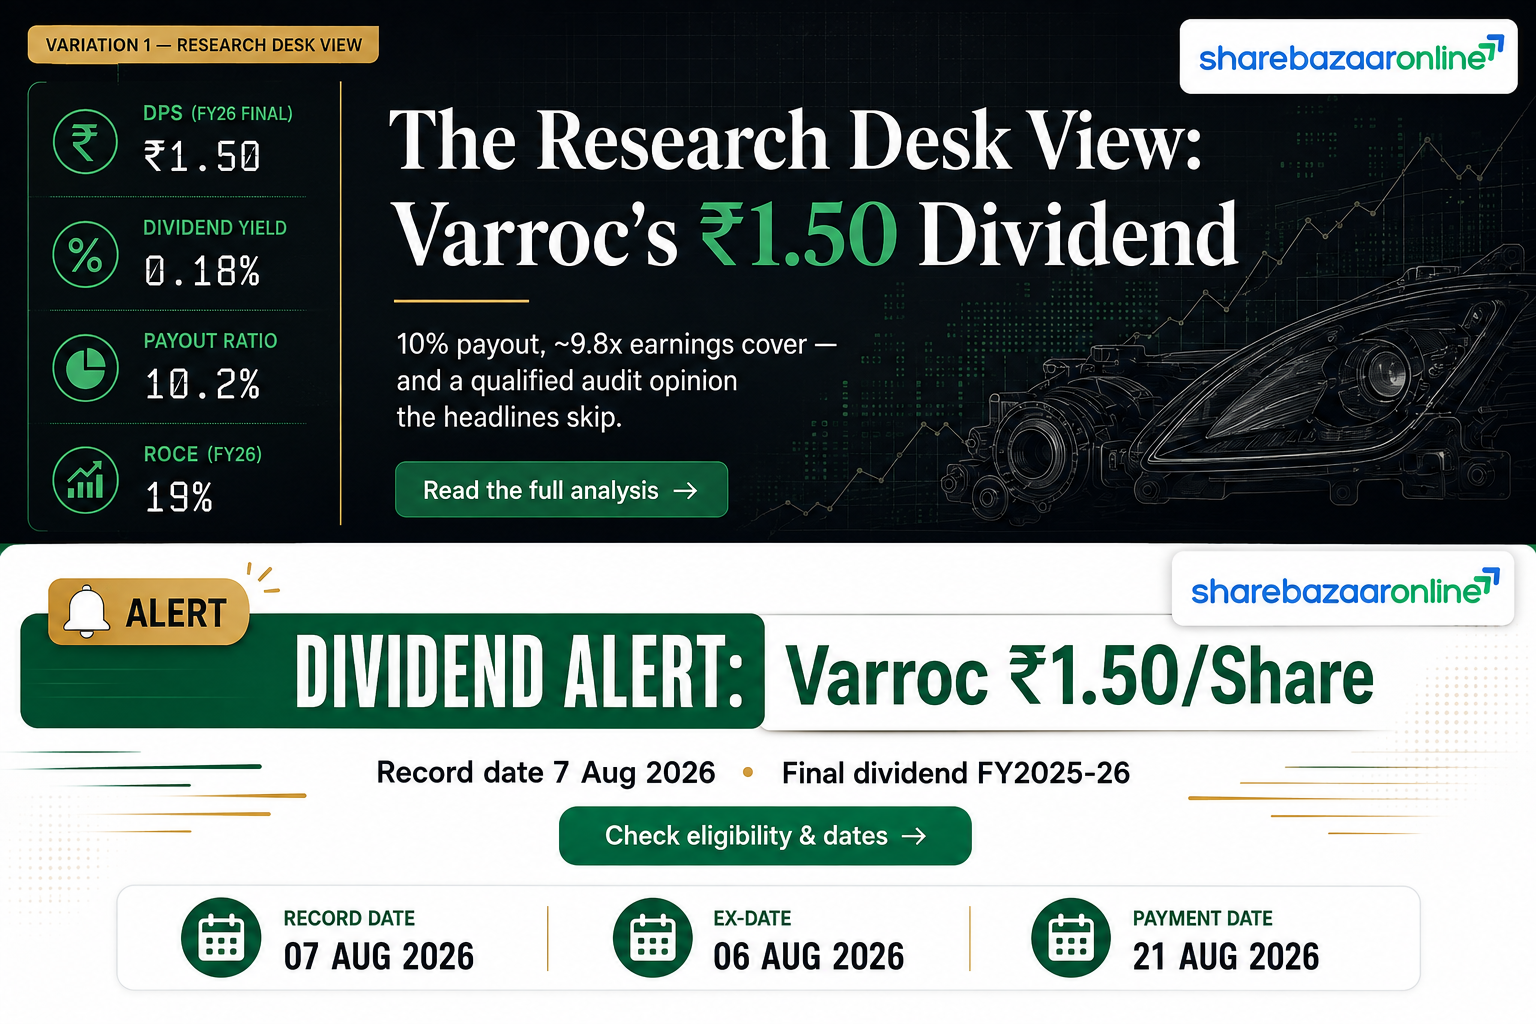
Varroc Engineering Limited (NSE: VARROC, BSE: 541578) has recommended a final dividend of ₹1.50 per equity share for the financial year 2025-26. The company markets this as a 150% dividend, but that percentage is calculated on the face value of just Re 1 per share — so the actual cash payout is ₹1.50 per share, not anything close to 150% of what you paid for the stock.
Dividend At A Glance
- Dividend Type: Final Dividend
- Dividend Per Share: ₹1.50
- Dividend Percentage: 150% of ₹1 face value
- Face Value: ₹1 per share
- Financial Year: FY2025-26
- Announcement Date: 27 May 2026
- Record Date: 7 August 2026
The Yield Reality
- Latest Market Price: ₹847.75 (NSE, 17 Aug 2026)
- Real Dividend Yield: ~0.18%
- Total Dividend Outflow: ~₹22.92 Crore
- Dividend Payout Ratio: ~10.2% of consolidated profit
- Payment: Within 30 days of the 38th AGM (AGM held 20 Aug 2026), subject to shareholder approval
What Wire Services Missed
The single most important fact behind this dividend rarely appears in aggregator headlines: Varroc’s FY26 audited results carry a qualified audit opinion from the statutory auditors, S R B C & CO LLP, on both the standalone and consolidated financials. The qualification relates to income of ₹20.99 Crore (Rs 209.89 million) recognised under ‘Revenue from operations’ that is now caught in an arbitration dispute with the former joint-venture partners (the “TYC Parties”). A company is distributing cash to shareholders while its auditors have declined to give a clean opinion on the very profit numbers that support the payout — a nuance every dividend investor should weigh.
Dividend Announcement Summary
At its board meeting on 27 May 2026 (which began at 1:25 p.m. and concluded at 3:35 p.m.), the Board of Directors of Varroc Engineering approved the audited standalone and consolidated financial results for the quarter and year ended 31 March 2026, and recommended a final dividend of ₹1.50 per equity share (150% of the ₹1 face value) for FY2025-26.
The dividend is subject to shareholder approval at the ensuing 38th Annual General Meeting. As disclosed in the filing, if approved, it will be paid within 30 days from the date of the 38th AGM, subject to deduction of applicable tax at source. The company confirmed the 38th AGM was scheduled for 20 August 2026.
Key Board Decisions Alongside The Dividend
- Approval of audited FY26 standalone and consolidated results
- Enabling approval to raise up to ₹500 Crore via Non-Convertible Debentures on a private placement basis
- Proposal to raise borrowing limits to ₹3,000 Crore under Sections 180(1)(a) and 180(1)(c)
- Re-appointment of cost auditors for FY2026-27
Why The Dividend Is Modest In Rupee Terms
A ₹1 face value means the “150%” label sounds far larger than the ₹1.50 you actually receive per share. On a market price near ₹848, that ₹1.50 works out to a dividend yield of roughly 0.18%. Varroc is fundamentally a growth-and-reinvestment auto-component story, not a high-yield income stock — the payout is a token shareholder reward rather than a core reason to own the shares.
Key Dates Timeline
| Event | Date | Source |
|---|---|---|
| Board Meeting / Announcement | 27 May 2026 | Company filing |
| Record Date | 7 August 2026 | Company filing (Reg 42) |
| Ex-Date | 7 August 2026 | Exchange data (verify vs NSE/BSE circular) |
| AGM Cut-off (voting) | 13 August 2026 | Company filing |
| 38th Annual General Meeting | 20 August 2026 | Company filing |
| Payment Date | Within 30 days of AGM (statutory outer limit ~19 Sep 2026) | Not fixed as a specific date by company |
Note: The company set the record date but did not disclose a single fixed payment date; the Companies Act requires dividend payment within 30 days of declaration/AGM approval. The exact payment date should be confirmed against the company’s subsequent intimation.
Dividend Yield Analysis
The Face-Value Illusion
A “150% dividend” is a percentage of face value, not of your investment. With a face value of ₹1, 150% equals exactly ₹1.50 per share. Divide that by the market price and the picture changes completely.
- Yield at latest price (₹847.75): ~0.18%
- Yield at announcement price (₹587.30, 27 May 2026): ~0.26%
Why The Yield Shrank Further
Between the 27 May announcement and 17 August, the share price rose from ₹587.30 to ₹847.75 — a gain of about 44%. Because the rupee dividend was fixed at ₹1.50, the rising price mechanically pushed the yield down from ~0.26% to ~0.18%. This is a textbook example of yield being driven by price, not by any change in the dividend itself.
How To Read This Yield
At ~0.18%, Varroc’s dividend yield sits far below the typical yield of established dividend payers. For context, aggregator platforms report the company’s yield in the 0.15%–0.24% band depending on the price snapshot. The takeaway for income-focused investors is simple: the dividend here is symbolic. Total returns from Varroc will overwhelmingly come from share price movement, not dividend income. All yields quoted are price-dependent and should be re-checked against the live market price before acting.
Dividend History Analysis
| Financial Year | Dividend Per Share | Remarks |
|---|---|---|
| FY2019 | ₹4.00 | Pre-downturn payout |
| FY2020 | ₹3.00 | Last payout before the loss years |
| FY2021 | Nil | Net loss — no dividend |
| FY2022 | Nil | Net loss — no dividend |
| FY2023 | Nil | Net loss — no dividend |
| FY2024 | Nil | Returned to profit but no dividend |
| FY2025 | ₹1.00 | Dividend resumed |
| FY2026 | ₹1.50 | Current — up 50% year-on-year |
Historical figures are on the current ₹1 face value. Older payouts (e.g. FY2019-20) predate certain corporate-action adjustments; per-share comparisons across those years should be read with that in mind.
Classification: Irregular / Cyclical Payer
Varroc is not a consistent dividend payer. It paid dividends through FY2020, then went through four consecutive years (FY2021–FY2024) with no dividend during a period of heavy losses and a major restructuring (including the sale of its global lighting business). The dividend was only restored in FY2025. The FY26 increase to ₹1.50 is encouraging, but the track record is short and interrupted.
A Subtle Signal In The Payout Ratio
Here is the non-obvious part: even though the dividend rose 50% (from ₹1.00 to ₹1.50), the payout ratio actually fell — from about 25% in FY25 to roughly 10% in FY26. That is because consolidated EPS jumped from ₹4.01 to ₹14.73. In other words, management raised the rupee dividend but became more conservative as a share of profit, keeping most of the surge in earnings inside the business.
Financial Performance Analysis
Consolidated FY26 Results (Rs Crore)
| Metric | FY2026 | FY2025 |
|---|---|---|
| Revenue from Operations | 8,890.49 | 8,154.08 |
| Profit After Tax (owners) | 225.03 | 61.23 |
| Basic EPS (₹) | 14.73 | 4.01 |
| Operating Profit Margin | ~9% | ~10% |
Revenue grew about 9% year-on-year, while consolidated net profit attributable to owners more than tripled (+267% to ₹225 Crore), driven partly by a low prior-year base that carried exceptional charges. Over the last five years, Varroc has compounded profit at roughly 19% CAGR as it moved past its loss-making phase.
The Standalone vs Consolidated Gap — An Overlooked Divergence
The dividend is declared by the parent, but the group tells a more sobering story. On a standalone basis Varroc earned PAT of ₹288.19 Crore (EPS ₹18.86). On a consolidated basis, PAT attributable to owners was lower at ₹225.03 Crore (EPS ₹14.73). The roughly ₹63 Crore gap reflects that several overseas and other subsidiaries were loss-making — the auditor’s report notes seven subsidiaries posted a combined net loss of about ₹105.6 Crore for the year. Investors reading only the standalone EPS will overstate the group’s true earning power.
Earnings Quality Flag: The Qualified Opinion
Both the standalone and consolidated audit reports carry a qualified opinion. The auditors could not verify ₹20.99 Crore of income (Rs 209.89 million) recognised in revenue that is now subject to an arbitration claim by the TYC Parties. Management believes it has a strong case and has made no provision. This is a genuine earnings-quality caveat: a portion of the reported profit that funds the dividend rests on income the auditors declined to sign off on.
Cash Flow Analysis
Cash Is Fact, Profit Is Opinion
On the consolidated cash flow statement, Varroc generated operating cash flow (OCF) of ₹536.80 Crore in FY26 — comfortably positive and more than double its reported PAT, which is a healthy sign of earnings converting to cash. However, OCF fell from ₹737 Crore in FY25, as working capital absorbed more cash (inventories and receivables rose).
| Cash Flow Item (Consolidated) | FY2026 (₹ Cr) |
|---|---|
| Operating Cash Flow | 536.80 |
| Capex on Property, Plant & Equipment | 397.49 |
| Capex on Intangible Assets | 71.16 |
| Free Cash Flow (after all capex) | ~68 |
| Dividend Paid During FY26 (prior-year ₹1) | 15.28 |
Free Cash Flow Compressed
After heavy reinvestment — capex rose as the company builds capacity for EV powertrain and new orders — free cash flow narrowed to roughly ₹68 Crore (from around ₹465 Crore in FY25 on a comparable basis). The dividend outflow of ₹22.92 Crore is still covered about 3 times over by FY26 free cash flow, but the cushion is thinner than a year ago.
How Is The Dividend Funded?
The dividend is funded from current operating cash flow and reserves, not from fresh borrowing or asset sales. At ₹22.92 Crore, the payout is a small fraction of the ₹536.80 Crore of operating cash the business threw off — an OCF coverage of over 20 times. On a pure affordability basis, the dividend is easily financed.
Balance Sheet Strength
Debt & Liquidity (Consolidated, FY26)
- Total Borrowings: ~₹737.70 Crore
- Cash & Cash Equivalents: ₹124.98 Crore
- Current Investments: ₹61.64 Crore
- Net Debt: ~₹551 Crore
- Net Worth (total equity): ~₹1,818 Crore
- Debt-to-Equity: ~0.41x (consolidated)
Returns & Deleveraging
- ROCE: ~19.0%
- ROE: ~15.1%
- Book Value: ~₹117 per share
- Borrowings trend: falling — from ~₹1,118 Cr (FY25) to ~₹925 Cr (FY26)
A Strengthening, But Still-Leveraged, Balance Sheet
Varroc has steadily reduced debt over the last few years, and it repaid its ₹250 Crore of Non-Convertible Debentures in full in March 2026. Returns on capital have improved to a respectable ~19% ROCE. That said, the company is simultaneously seeking shareholder approval to raise up to ₹500 Crore of new NCDs and to lift borrowing limits to ₹3,000 Crore — a reminder that the deleveraging story could reverse if the company gears up again for growth. The dividend is tiny relative to the balance sheet, so it is not the balance-sheet risk; the borrowing plans are the item to watch.
Dividend Sustainability Analysis
Four Coverage Tests
| Test | Coverage | Verdict |
|---|---|---|
| Earnings (EPS ₹14.73 vs DPS ₹1.50) | ~9.8x | Strong |
| Operating Cash Flow vs Outflow | ~23x | Strong |
| Free Cash Flow vs Outflow | ~3x | Adequate |
| Cash + Investments vs Outflow | ~8x | Strong |
Verdict: Moderately Sustainable
On every quantitative measure the current ₹1.50 dividend is comfortably affordable — it consumes only about 10% of profit and a small slice of cash flow. We classify it as Moderately Sustainable rather than fully sustainable because the payout history is short and interrupted, earnings are cyclical, free cash flow has compressed, and the FY26 profit itself carries a qualified audit opinion.
What Could Change The Picture
Auto-component earnings swing with vehicle-production cycles. Varroc posted losses as recently as FY21–FY23. If a demand downturn or an adverse arbitration outcome hits profits, management has shown it will cut or suspend the dividend rather than fund it from debt — exactly what happened in the last cycle. The affordability is real today, but it is not guaranteed through a downturn.
Peer Comparison
| Company | Dividend Yield | ROE | ROCE |
|---|---|---|---|
| Varroc Engineering | ~0.18% | ~15.1% | ~19.0% |
| Uno Minda | Not Independently Verified | Not Independently Verified | Not Independently Verified |
| Endurance Technologies | Not Independently Verified | Not Independently Verified | Not Independently Verified |
| Samvardhana Motherson Intl | Not Independently Verified | Not Independently Verified | Not Independently Verified |
| Sundram Fasteners | Not Independently Verified | Not Independently Verified | Not Independently Verified |
Peer yield, ROE and ROCE cells are left as “Not Independently Verified” rather than populated with unverified data, in line with our data-integrity standard. These require verification against each peer’s latest filing before publication.
Where Varroc Sits
Within the Indian auto-ancillary space, dividend yields are generally modest — most listed component makers reinvest heavily and yield well under 1.5%. Varroc’s ~0.18% is at the low end even for this low-yield sector, consistent with its growth-and-deleveraging profile and its recently restored, still-small payout. Its ROCE of ~19% is competitive, which is arguably the more relevant comparison for a reinvestment-led stock than the dividend yield.
Promoter Impact Analysis
Shareholding Pattern (Jun 2026)
- Promoters: 75.00%
- FIIs: 4.29%
- DIIs: 11.18%
- Public & Others: 9.53%
Who Gets The ₹22.92 Crore?
- Promoter group (75%): ~₹17.19 Crore
- FIIs + DIIs + Public (25%): ~₹5.73 Crore
Interpretation
With the promoter group (led by Chairman Tarang Jain) holding a full 75%, roughly ₹17.19 Crore of the total dividend flows to the promoters. Because promoter ownership is at the regulatory maximum and the payout ratio is modest (~10%), the dividend is proportionate — there is no signal of the promoter extracting cash disproportionately at minority shareholders’ expense. Minority shareholders receive their pro-rata ₹1.50 per share on the same terms. The far larger promoter interest lies in the share price, where their stake is worth thousands of crore.
Taxation Analysis
How Dividends Are Taxed In India
Since April 2020, dividends are taxable in the hands of the shareholder at their applicable income-tax slab rate (there is no separate Dividend Distribution Tax). The company deducts TDS at 10% under Section 194 if the total dividend paid to a resident shareholder exceeds ₹5,000 in a financial year (10% only on the amount; for those without a valid PAN, TDS is 20%).
Worked Example
Assume an investor holds 1,000 shares and receives the ₹1.50 dividend, and is in the 30% tax slab:
- Gross Dividend: 1,000 × ₹1.50 = ₹1,500
- TDS: Nil — because ₹1,500 is below the ₹5,000 TDS threshold
- Tax at 30% slab: ₹1,500 × 30% = ₹450
- Net (after-tax) Dividend: ₹1,050
- Effective post-tax yield (at ₹847.75): ~0.12%
The tax liability is settled through the investor’s annual return; TDS (if any) is adjusted against it. This is a general illustration, not tax advice — consult a qualified tax professional for your situation.
Key Risks
- 1. Qualified audit opinion: Both standalone and consolidated FY26 results carry a qualified opinion over ₹20.99 Crore of income tied to the TYC arbitration. An adverse ruling could force a reversal that hits reported profit and retained earnings.
- 2. Multiple unprovided contingent liabilities: Beyond the TYC matter, an ICC arbitration by OPmobility alleges breaches with claims quantified at US$66.41 million plus legal costs, and there are contested GST orders. No provisions have been made for these; crystallisation would pressure earnings and cash.
- 3. Cyclical, interrupted earnings: Varroc reported net losses in FY21, FY22 and FY23 and suspended dividends for four years. Auto-component demand is tied to vehicle-production cycles that can turn sharply.
- 4. Rising leverage plans: The board is seeking approval for up to ₹500 Crore of new NCDs and higher borrowing limits (₹3,000 Crore). Re-gearing for growth or acquisitions could reverse recent deleveraging.
- 5. Overseas subsidiary drag: Several foreign subsidiaries were loss-making in FY26 (about ₹105.6 Crore combined), pulling consolidated EPS below standalone EPS and adding currency and execution risk.
- 6. Very low dividend yield: At ~0.18%, the dividend offers negligible income cushion; total return depends almost entirely on the share price, which has run up ~44% since the announcement.
What To Monitor
- 1. Arbitration outcomes: Track progress on both the TYC Parties dispute (behind the audit qualification) and the OPmobility ICC arbitration, and whether any provision is eventually recognised.
- 2. Free cash flow trend: FCF compressed to ~₹68 Crore in FY26 as capex rose. Watch whether operating cash flow recovers and how the ₹500–550 Crore FY27 capex guidance affects free cash generation.
- 3. Debt and NCD issuance: Monitor whether the company actually draws down the newly approved NCD/borrowing headroom and how net debt evolves.
- 4. Margin direction: Operating margin slipped toward ~8–9%. Raw-material costs, employee costs and product mix (EV vs legacy) will decide whether margins expand or compress.
- 5. Subsidiary profitability: Watch whether the loss-making overseas subsidiaries turn around, narrowing the gap between standalone and consolidated earnings.
- 6. Payout-ratio policy: The payout ratio fell to ~10% even as the dividend rose. Watch whether management formalises a dividend policy and where it sets the payout as earnings normalise.
Conclusion
Positives
- Dividend up 50% year-on-year to ₹1.50; restored and growing after a four-year gap
- Easily affordable — ~10% payout, covered ~9.8x by earnings and ~23x by operating cash flow
- Consolidated profit tripled; ROCE improved to ~19%; debt reduced and NCDs fully repaid
Negatives & Watch-Items
- Qualified audit opinion on FY26 profit; several large unprovided contingent liabilities
- Very low ~0.18% yield — negligible as an income source
- Cyclical, interrupted dividend history; free cash flow compressed; overseas subsidiaries loss-making
In short, Varroc’s ₹1.50 dividend is best understood as a small, symbolic shareholder reward on a recovering growth stock, not as an income opportunity. The affordability is not in question; the more important context — a qualified audit opinion and multiple open disputes — is exactly what a headline “150% dividend” obscures. We present the positives, negatives, risks and monitoring factors so you can decide for yourself. This article does not offer any buy, sell or hold recommendation.
Frequently Asked Questions
What dividend has Varroc Engineering announced for FY2025-26?
What is the Varroc Engineering dividend yield?
What is the record date for the Varroc dividend?
What is the ex-date for the Varroc dividend?
When will the Varroc dividend be paid?
Who was eligible to receive the dividend?
How is the Varroc dividend taxed?
Is the Varroc dividend sustainable?
What is Varroc Engineering’s dividend history?
Why does the payout ratio fall even though the dividend rose?
Why did the auditors give a qualified opinion?
How much of the dividend goes to promoters?
What should investors monitor after this dividend?
Disclaimer
This article is for informational and educational purposes only and is intended as financial journalism, not investment advice. It does not constitute a buy, sell or hold recommendation on Varroc Engineering Limited or any security. ShareBazaar Online is not a SEBI-registered investment adviser. All figures are drawn from the company’s regulatory filings and publicly available sources and are believed accurate as of the date of writing; market prices, yields and dates are time-sensitive and should be independently re-verified before any decision. Dividend approval, record date, ex-date and payment date are subject to statutory processes and company confirmation. Investing in equities carries risk, including loss of principal. Please consult a SEBI-registered financial adviser and conduct your own due diligence before making any investment decision.