
Dividend Snapshot
PI Industries Limited (NSE: PIIND | BSE: 523642) has declared a final dividend of ₹10 per share (1000% on face value of ₹1) for FY 2025–26, taking the total dividend for the year to ₹15 per share including the ₹5 interim already paid. This PI Industries dividend was recommended by the Board on 19 May 2026 and approved by shareholders at the AGM. Below is the compute-first snapshot — every figure is derived, not copied.
Dividend Details
Final Dividend: ₹10.00 per share (1000%)
Interim (already paid): ₹5.00 per share
Total FY26 Dividend: ₹15.00 per share
Face Value: ₹1.00 per share
Dividend Type: Final (Cash)
Yield & Payout (Computed)
Total Dividend Yield: 0.60% (₹15 ÷ CMP ₹2,494)
Final-only Yield: 0.40%
Payout Ratio (Consolidated): 17.3%
Dividend Cover: 5.80x (EPS ₹87.06 ÷ ₹15)
Total Outflow: ₹228 crore
What Wire Reports Missed
The “1000% dividend” headline is technically true but reads big only because it is calculated on the ₹1 face value — the real cash yield is just 0.60%. More importantly, the total FY26 dividend of ₹15 is actually lower than FY25’s ₹16 (the interim was trimmed from ₹6 to ₹5), and the payout came in a year when free cash flow turned negative. We unpack both below.
Dividend Announcement Summary
At its board meeting held on 19 May 2026 (which ran from 2:00 p.m. to 8:10 p.m. IST), the Board of Directors of PI Industries recommended a final dividend of ₹10 per equity share of face value ₹1 each for the financial year ended 31 March 2026. Together with the interim dividend of ₹5 per share paid earlier in the year, the total FY26 payout stands at ₹15 per equity share.
The dividend was subject to member approval at the ensuing Annual General Meeting (AGM), which was held on 14 August 2026. As disclosed in the company’s AGM outcome, the FY26 accounts and both dividends (₹5 interim, ₹10 final) were approved by shareholders. The company also announced audited standalone and consolidated results for the quarter and year, alongside several board changes including the resignation of Mr. Rajnish Sarna as Joint Managing Director (continuing as a Non-Executive Director).
Board Recommendation
Final dividend: ₹10/share (1000%)
Financial Year: FY 2025–26
Payable: within 30 days of AGM declaration
Auditor & Governance
Audit opinion: Unmodified (clean)
Statutory auditor: Price Waterhouse Chartered Accountants LLP
Total dividend outflow: ₹228 crore
Key Dates Timeline
Announcement (Board Meeting): 19 May 2026
Record Date: 07 August 2026
Ex-Dividend Date: 07 August 2026 (under the T+1 settlement cycle the ex-date and record date typically coincide — investors should confirm against the official NSE/BSE corporate-action circular)
AGM Date: 14 August 2026
Dividend Payment: on or before 12 September 2026 (within 30 days of AGM approval)
Eligibility (Past Tense)
The record date of 07 August 2026 has passed. Shareholders who held PIIND shares as of that date were entitled to the ₹10 final dividend, with payment scheduled on or before 12 September 2026. Buyers after the ex-date did not qualify for this particular payout.
Dividend Yield Analysis
Dividend yield is the only number that tells you what the PI Industries dividend is actually worth to a buyer today. The “1000%” figure quoted in filings is calculated on the ₹1 face value and is not a yield. Here is the real math, using the current market price.
Yield at Current Price (₹2,494*)
Final ₹10 only: 0.40%
Total FY26 ₹15: 0.60%
Yield at Announcement (~₹3,124)
Total FY26 ₹15: ~0.48%
Yield has risen since announcement only because the share price has fallen ~20%, not because the dividend grew.
Yield Reality Check
PI Industries is a low-yield growth stock, not an income stock. Even at a 52-week-low share price, the total yield is only 0.60% — well below the broader materials-sector average and far below high-payout agrochemical names. The modest uptick in yield versus announcement is driven entirely by the price decline, a classic case where a “rising yield” reflects a weaker share price rather than a stronger dividend.
*CMP ₹2,494 as of 13 August 2026 (NSE). All yields are price-dependent and require re-verification against the live quote before acting.
Dividend History Analysis
PI Industries has a consistent record of paying two dividends a year (interim + final). The PI Industries dividend history below, on the current ₹1 face value, shows steady growth through FY24 — and then a subtle turn in FY26.
FY 2025–26: ₹5 interim + ₹10 final = ₹15 total
FY 2024–25: ₹6 interim + ₹10 final = ₹16 total
FY 2023–24: ₹6 interim + ₹9 final = ₹15 total
FY 2022–23: ₹4.50 interim + ₹5.50 final = ₹10 total
FY 2021–22: final ₹3.00 declared (interim component Not Independently Verified)
The Non-Obvious Finding
Most coverage frames FY26 as a “₹15 dividend maintained.” In fact, the total payout declined from ₹16 in FY25 to ₹15 in FY26 — the interim dividend was cut from ₹6 to ₹5, while the final was held flat at ₹10. It is the first year-on-year reduction in total dividend after a multi-year uptrend, and it lines up with a year of falling profits. Classification: Consistent Payer, but FY26 marks a cautious step-down rather than continued growth.
Financial Performance Analysis
FY26 was a genuinely difficult year for PI Industries — the first revenue decline in over five years, driven by a contraction in the global agrochemical (CSM/agchem export) cycle.
Consolidated FY26 vs FY25
Revenue: ₹6,714 cr vs ₹7,978 cr (−15.8%)
Net Profit (PAT): ₹1,321 cr vs ₹1,660 cr (−20.4%)
EPS: ₹87.06 vs ₹109.44 (−20.4%)
ROE: ~12.4% vs ~16.3%
Earnings Quality Flags
Other income was 23.5% of PAT (₹311 cr) — a large non-operating contribution.
An exceptional gain of ₹103 cr (a contingent-consideration write-back, net of labour-code provisions) lifted pre-tax profit by ~6%.
Core ROCE (excluding the exceptional item): ~14%.
Operating Leverage & Segment Read
Revenue fell ~16% and PAT fell ~20% — profit contracted faster than sales, the signature of negative operating leverage. In Q4 FY26, EBITDA dropped 26% year-on-year and standalone quarterly net profit nearly halved to ₹197.8 cr (from ₹385.8 cr). The one bright spot: the smaller Pharma segment grew ~23%, though Agchem — still the bulk of the business — contracted on weak export demand and softer domestic pricing.
Cash Flow Analysis
Reported profit is an opinion; cash is a fact. This is where the FY26 story gets more serious than the headlines suggest, and it is the single most important section for any dividend investor.
Operating Cash Flow
OCF FY26: ₹474 cr
OCF FY25: ₹1,413 cr
Decline: −66.5% year-on-year
PAT fell 20%, but OCF fell 66% — a sharp divergence driven by a large build-up in receivables, contract assets and inventory, plus a drawdown in payables.
Free Cash Flow
OCF: ₹474 cr
Less Capex: ₹1,118 cr
FCF FY26: −₹644 cr (negative)
Heavy capital spending exceeded operating cash generation, so free cash flow was negative for the year.
How Was This Dividend Funded?
Because FY26 free cash flow was negative (−₹644 cr), the ₹228 crore total dividend was not covered by current-year free cash flow. Operating cash flow alone (₹474 cr) does cover it about 2.1x, but only thinly. In practical terms, the dividend and the heavy capex together were funded from the company’s large existing cash and investment reserves — not from a single year’s cash generation. PI Industries can comfortably afford this because of its balance-sheet strength (next section), but the FCF signal is a genuine watch-item, not something the “1000% dividend” headline captures.
Balance Sheet Strength
The reason a negative-FCF year does not threaten the PI Industries dividend is the fortress balance sheet. The company is effectively net cash.
Liquidity (Consolidated, 31-Mar-26)
Cash & equivalents: ₹283 cr
Current investments: ₹1,327 cr
Bank balances / deposits: ₹1,899 cr
Total liquid resources: ₹3,511 cr
Debt & Net Cash
Total borrowings: ₹238 cr (near debt-free)
Net cash position: ₹3,273 cr
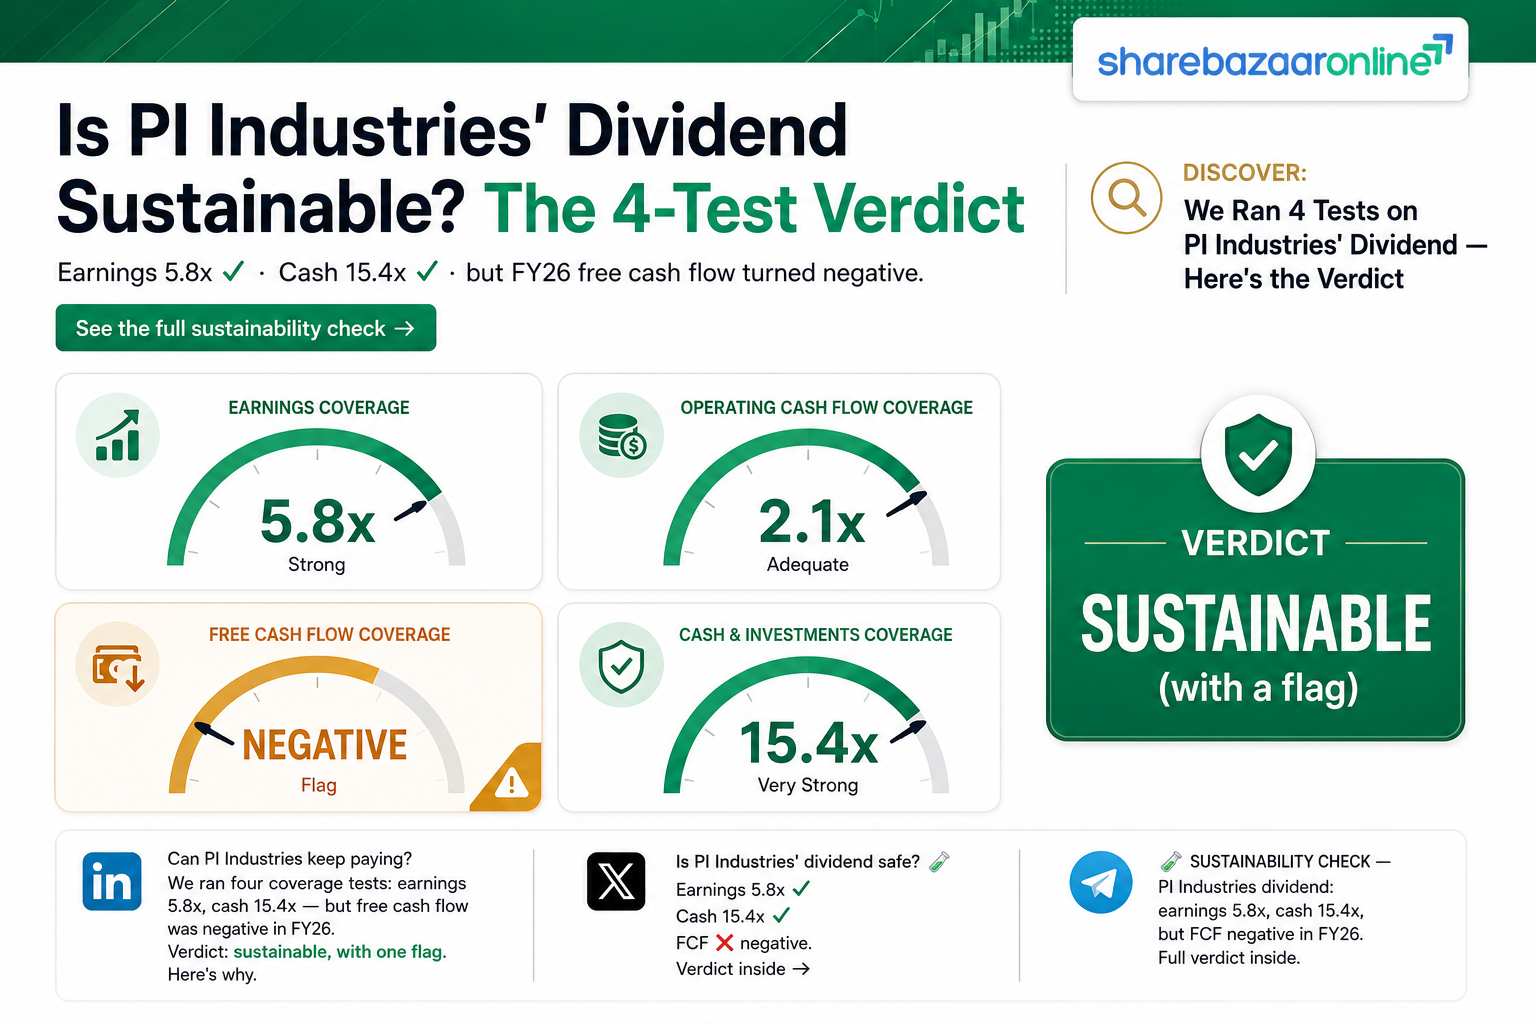
Cash coverage of dividend: 15.4x
With roughly ₹3,273 crore of net cash against a ₹228 crore dividend, PI Industries holds more than 15 times the annual payout in liquid resources. The dividend is a rounding error against the cash pile — the affordability question is emphatically settled, even in a weak earnings year.
Dividend Sustainability Analysis
Coverage Tests
Earnings (PAT) cover: 5.80x ✓ Sustainable
Operating cash flow cover: 2.08x ✓ Adequate
Free cash flow cover: −2.82x ✗ Not covered (FY26)
Cash/liquidity cover: 15.4x ✓ Very strong
Verdict
Sustainable
A conservative 17% payout, 5.8x earnings cover and a ₹3,273 cr net-cash cushion make the dividend easily sustainable. The single caveat is the negative FY26 free cash flow — sustainable today, but worth monitoring if the earnings and cash-flow decline persists.
On balance: the dividend is affordable and well-covered by earnings and reserves, but FY26 is the first year where free cash flow did not fund it. Debt is not rising to pay the dividend (borrowings remain negligible), so the payout is being sustained from strength, not leverage — a healthy distinction. Sustainability rating: Sustainable, with a cautionary flag on the earnings/FCF trend.
Peer Comparison
Against listed agrochemical peers, PI Industries stands out for balance-sheet quality and CSM (custom synthesis & manufacturing) positioning, but is a distinctly low-yield name.
PI Industries (PIIND)
Dividend Yield: ~0.60%
Payout Ratio: ~17%
ROE: ~12.4%
Balance sheet: Net cash (near debt-free)
Selected Peers (indicative)
Sumitomo Chemical India: yield ~0.27%, ROE ~17%
Dhanuka Agritech: zero-debt, ROCE >22% (higher payout profile)
Rallis India (Tata): higher relative yield profile
Peer yield/ROE/payout figures are indicative from public sources; blank cells are intentionally left where data is not independently verified.
The read-through: within agrochemicals, PI Industries screens as a growth-and-quality compounder rather than a dividend play. Its ROE has slipped below several peers this year owing to the cyclical downturn, but its net-cash position remains best-in-class. Income-focused investors typically find higher yields in branded-domestic peers; PI’s appeal is its CSM franchise and order book, not its payout.
Promoter Impact Analysis
Shareholding (approx., latest)
Promoter: 46.09% (nil pledge)
FII: ~15.9%
DII: ~9.5%
FII/DII splits vary by data-source classification; verify against the official June 2026 shareholding filing.
Dividend Distribution
Promoter share of ₹228 cr payout: ~₹105 cr
Public/institutional share: ~₹123 cr
The promoter group receives roughly ₹105 crore of the total dividend by virtue of its 46.09% holding, with the remaining ~₹123 crore flowing to minority, foreign and domestic institutional shareholders. Because the payout ratio is modest (~17%), the dividend is a balanced reward across the register rather than a mechanism skewed toward promoters — the bulk of profit is retained to fund the business and capex.
Taxation Analysis
Since April 2020, dividends in India are taxed in the hands of the shareholder at their applicable income-tax slab rate. The company deducts TDS at 10% where a resident shareholder’s total dividend from the company exceeds ₹5,000 in a financial year (TDS is 20% if PAN is not furnished; different rates apply to non-residents).
Worked Example — 1,000 shares, ₹15 total dividend, 30% slab
Gross dividend: 1,000 × ₹15 = ₹15,000
TDS deducted at 10%: ₹1,500 (adjustable against final tax)
Tax at 30% slab (+ applicable cess/surcharge): ₹4,500
Net dividend in hand: ₹10,500
Effective post-tax yield on CMP: ~0.42%
For a top-slab investor, the already-thin 0.60% gross yield shrinks to roughly 0.42% after tax — another reason PI Industries is held for capital appreciation and business quality rather than for income. Investors in lower slabs retain proportionately more, and TDS is creditable when filing returns. This is general information, not tax advice; consult a qualified professional for your situation.
Key Risks
1. Agrochemical export cycle: FY26 revenue fell ~16% on a global agchem/CSM contraction; a prolonged downcycle would keep pressuring earnings and the cash generation that supports dividends.
2. Negative free cash flow: Heavy capex (₹1,118 cr) against sharply lower operating cash flow (₹474 cr) produced negative FCF in FY26; if this persists, dividends would increasingly draw on reserves.
3. Working-capital stretch: Debtor days have risen and receivables/contract assets built up materially, the main reason OCF fell 66% — a sign of tighter cash conversion.
4. Earnings-quality dependence: Other income (~23.5% of PAT) and a one-off exceptional gain flattered FY26 profit; the underlying operating trend is weaker than headline PAT.
5. Client & concentration risk: The CSM business depends on a limited set of global innovator clients and molecule pipelines; product/patent transitions can create lumpiness.
6. Management transition: Senior leadership changes in FY26, including the JMD stepping down and multiple board re-appointments, introduce transition risk during a cyclical trough.
What To Monitor
1. Return of operating cash flow: Whether OCF recovers toward historical levels (~₹1,400 cr) or stays depressed — the clearest read on dividend durability.
2. Free cash flow turn: Watch for capex normalising and FCF returning to positive; sustained negative FCF alongside dividends is the key red flag.
3. Agchem export recovery: Order-book momentum and CSM revenue trends as the global agrochemical destocking cycle plays out.
4. Pharma scale-up: Whether the fast-growing (~23%) Pharma/CDMO segment becomes large enough to diversify earnings away from agchem cyclicality.
5. Working-capital discipline: Debtor days, contract-asset build and inventory — improvement here directly restores cash conversion.
6. Dividend trajectory: Whether the FY27 interim resumes growth or the FY26 step-down (₹16 to ₹15) becomes a trend.
Conclusion
The PI Industries FY26 dividend of ₹10 final (₹15 total) is comfortably affordable — backed by a ₹3,273 crore net-cash balance sheet, 5.8x earnings cover and a conservative 17% payout. On affordability alone, there is little to worry about.
But the numbers beneath the “1000% dividend” headline tell a more nuanced FY26 story: revenue fell ~16%, PAT fell ~20%, operating cash flow collapsed 66%, free cash flow turned negative, and the total dividend was quietly trimmed from ₹16 to ₹15. The company is paying a well-covered dividend from a position of balance-sheet strength — but it is doing so during its weakest operating year in half a decade.
Positives: fortress net-cash balance sheet, near-zero debt, clean audit, low payout with room to grow, resilient Pharma segment. Negatives & watch-items: negative FY26 free cash flow, 66% OCF decline, first dividend step-down in years, earnings flattered by other income and a one-off gain, and an unresolved agchem export downcycle. We present the evidence; the investment decision is yours.
Frequently Asked Questions
What dividend has PI Industries announced for FY26?
What is the PI Industries dividend yield?
What is the record date for the PI Industries dividend?
What is the ex-dividend date?
When will the PI Industries dividend be paid?
Who is eligible for the dividend?
How is the PI Industries dividend taxed?
Is the PI Industries dividend sustainable?
Was the FY26 dividend higher or lower than last year?
What is PI Industries’ dividend history?
How did PI Industries perform financially in FY26?
Why did operating cash flow fall so sharply?
How does PI Industries’ dividend compare with peers?
What should investors monitor going forward?
Disclaimer
This article is for informational and educational purposes only and does not constitute investment, financial, legal or tax advice, nor a recommendation to buy, sell or hold any security. ShareBazaar Online is a financial-publishing platform and is not registered with SEBI as an investment adviser or research analyst. All financial figures are derived from PI Industries Limited’s audited FY26 results, exchange filings and publicly available data; the current market price (₹2,494 as of 13 August 2026) and all price-dependent yields require re-verification against live quotes before any decision. Certain figures noted as inferred or “Not Independently Verified” should be confirmed against primary sources. Securities investments are subject to market risks; past dividend history and performance do not guarantee future outcomes. Readers should consult a SEBI-registered adviser and conduct their own due diligence before investing.