
Dividend Snapshot
Sharda Cropchem Limited (NSE: SHARDACROP, BSE: 538666) has declared a final dividend of ₹9.00 per equity share for the financial year 2025-26, on a face value of ₹10. In headline terms that reads as a 90% dividend, but as this analysis shows, the percentage on face value and the real yield on the market price are two very different numbers. This is the second leg of the company’s FY26 payout — an interim dividend of ₹6.00 was already paid earlier in the year, taking the full-year FY26 dividend to ₹15.00 per share.
Dividend At A Glance
- Dividend Type: Final Dividend (FY2025-26)
- Dividend Per Share: ₹9.00
- Dividend on Face Value: 90% (₹9 on ₹10)
- Full-Year FY26 Dividend: ₹15.00 (Interim ₹6 + Final ₹9)
- Announcement (Board): 13 May 2026
- Record Date: 7 August 2026
- AGM Approval: Granted at 23rd AGM on 14 August 2026
The Numbers That Matter
- Final Dividend Yield: ~1.15% (on CMP ₹782)
- Full-Year FY26 Yield: ~1.92% (on CMP ₹782)
- FY26 EPS (Consolidated): ₹75.47
- Final Dividend Payout: ~11.9% of FY26 profit
- Full-Year Payout: ~19.9% of FY26 profit
- Est. Total Outflow (Final): ~₹81 Cr
- Balance Sheet: Near debt-free
The ShareBazaar Angle
FY26 net profit jumped 124% year-on-year to ₹681 crore — a spectacular headline. But part of that leap is a base effect: FY24 profit had collapsed to just ₹32 crore. Sharda Cropchem’s earnings are genuinely cyclical, yet the striking fact is that its dividend has kept rising through the volatility, backed by a cash-rich, debt-free balance sheet rather than by any single strong year. The final dividend is comfortably covered by earnings (8.4x) and operating cash flow (4.8x on the full-year payout), though free cash flow coverage is much tighter at ~1.2x because of the company’s heavy spend on product registrations.
Current market price (CMP) of ₹782 is a live figure (Screener, 17 Aug 2026) and must be re-verified before publication, as every yield is price-dependent.
Dividend Announcement Summary
The Board of Directors of Sharda Cropchem Limited, at its meeting held on Wednesday, 13 May 2026, considered and recommended a final dividend at the rate of ₹9.00 per equity share of face value ₹10.00 each for the financial year 2025-26. As is standard for a final dividend, the recommendation was subject to shareholder approval at the Annual General Meeting. That approval was subsequently obtained at the company’s 23rd AGM on 14 August 2026, which was conducted through video conferencing.
What Was Announced
- • A final dividend (not interim, not special)
- • ₹9.00 per share, i.e. 90% of the ₹10 face value
- • For the financial year ended 31 March 2026
- • Recommended by the Board, approved by shareholders at the AGM
Putting FY26 In Context
- • Interim dividend of ₹6.00 already paid (declared 29 Jan 2026)
- • Final ₹9.00 takes the full-year FY26 payout to ₹15.00
- • This is a 66% jump over the FY25 full-year dividend of ₹9.00
- • The largest full-year dividend in the company’s listed history
Why The “90%” Label Can Mislead
A dividend expressed as a percentage is always calculated on the face value (₹10 here), not the market price. So “90% dividend” simply means ₹9 per share. Against the market price of roughly ₹782, that ₹9 works out to a real yield of about 1.15% for the final dividend. Retail investors sometimes read “90%” as a 90% return — it is not. This is one of the most common misunderstandings in Indian dividend investing, and we flag it in every report.
Key Dates Timeline
Confirmed Dates
- Board / Announcement Date: 13 May 2026
- Record Date: 7 August 2026 (Friday)
- Book Closure: From 8 August 2026 (for the AGM)
- AGM Date: 14 August 2026
Inferred / Not Disclosed
- Ex-Date: 7 August 2026 (inferred under the T+1 settlement regime, where the ex-date typically equals the record date — to be confirmed against the official exchange circular)
- Payment Date: Not disclosed by the company in the dividend intimation. Under the Companies Act, a declared dividend must be paid within 30 days of the AGM declaration — i.e. an outer limit of approximately mid-September 2026.
Eligibility (Past Tense)
Because the record date of 7 August 2026 has already passed, the eligibility window is closed. Shareholders who held Sharda Cropchem shares in their demat account as of the record date were entitled to receive the ₹9.00 final dividend. Investors buying the stock after the ex-date did not qualify for this particular payout.
Dividend Yield Analysis
Dividend yield is the dividend divided by the share price, expressed as a percentage. It is the single most important number for an income investor — and it changes every time the price moves. Here is how Sharda Cropchem’s yield stacks up.
Yield On Current Market Price
- CMP: ~₹782 (17 Aug 2026)
- Final ₹9 yield: (₹9 ÷ ₹782) = 1.15%
- Full-year ₹15 yield: (₹15 ÷ ₹782) = 1.92%
CMP is a live figure — re-verify before publishing.
Yield Reality Check
Sharda’s ~1.92% trailing yield looks healthier than its history partly because the share price has fallen roughly 18% over the past year and now trades close to its 52-week low of ₹756 (52-week high: ₹1,298). A yield can rise for the right reason (a bigger dividend) or the wrong reason (a falling price). Here it is a mix of both — the FY26 dividend genuinely grew, but the elevated yield is amplified by price weakness.
Sector Context
Agrochemical and specialty-chemical stocks in India are typically growth-oriented, low-yield names, with dividend yields commonly in the 0.5%–2% band. Sharda’s ~1.9% trailing yield sits at the upper end of that range for the sector, but income should not be the primary reason to own a cyclical agrochemical exporter — the total-return case rests far more on earnings recovery and product-registration growth than on the dividend cheque.
Dividend History Analysis
The most revealing test of a dividend is not one year’s number but the trend across a full cycle. Below is Sharda Cropchem’s dividend record reconstructed by financial year, alongside earnings per share and the resulting payout ratio.
| Financial Year | Interim | Final | Total DPS | EPS | Payout % |
|---|---|---|---|---|---|
| FY2020-21 | ₹2 | ₹3 | ₹5 | ₹25.40 | ~20% |
| FY2021-22 | ₹3 | ₹3 | ₹6 | ₹38.71 | ~16% |
| FY2022-23 | ₹3 | ₹3 | ₹6 | ₹37.90 | ~16% |
| FY2023-24 | — | ₹3 | ₹3 | ₹3.53 | ~85% |
| FY2024-25 | ₹3 | ₹6 | ₹9 | ₹33.74 | ~27% |
| FY2025-26 | ₹6 | ₹9 | ₹15 | ₹75.47 | ~20% |
Dividend split between interim and final reconstructed from exchange ex-date records and cross-checked against reported payout ratios. To be confirmed against the company’s official dividend distribution history.
What The History Tells Us
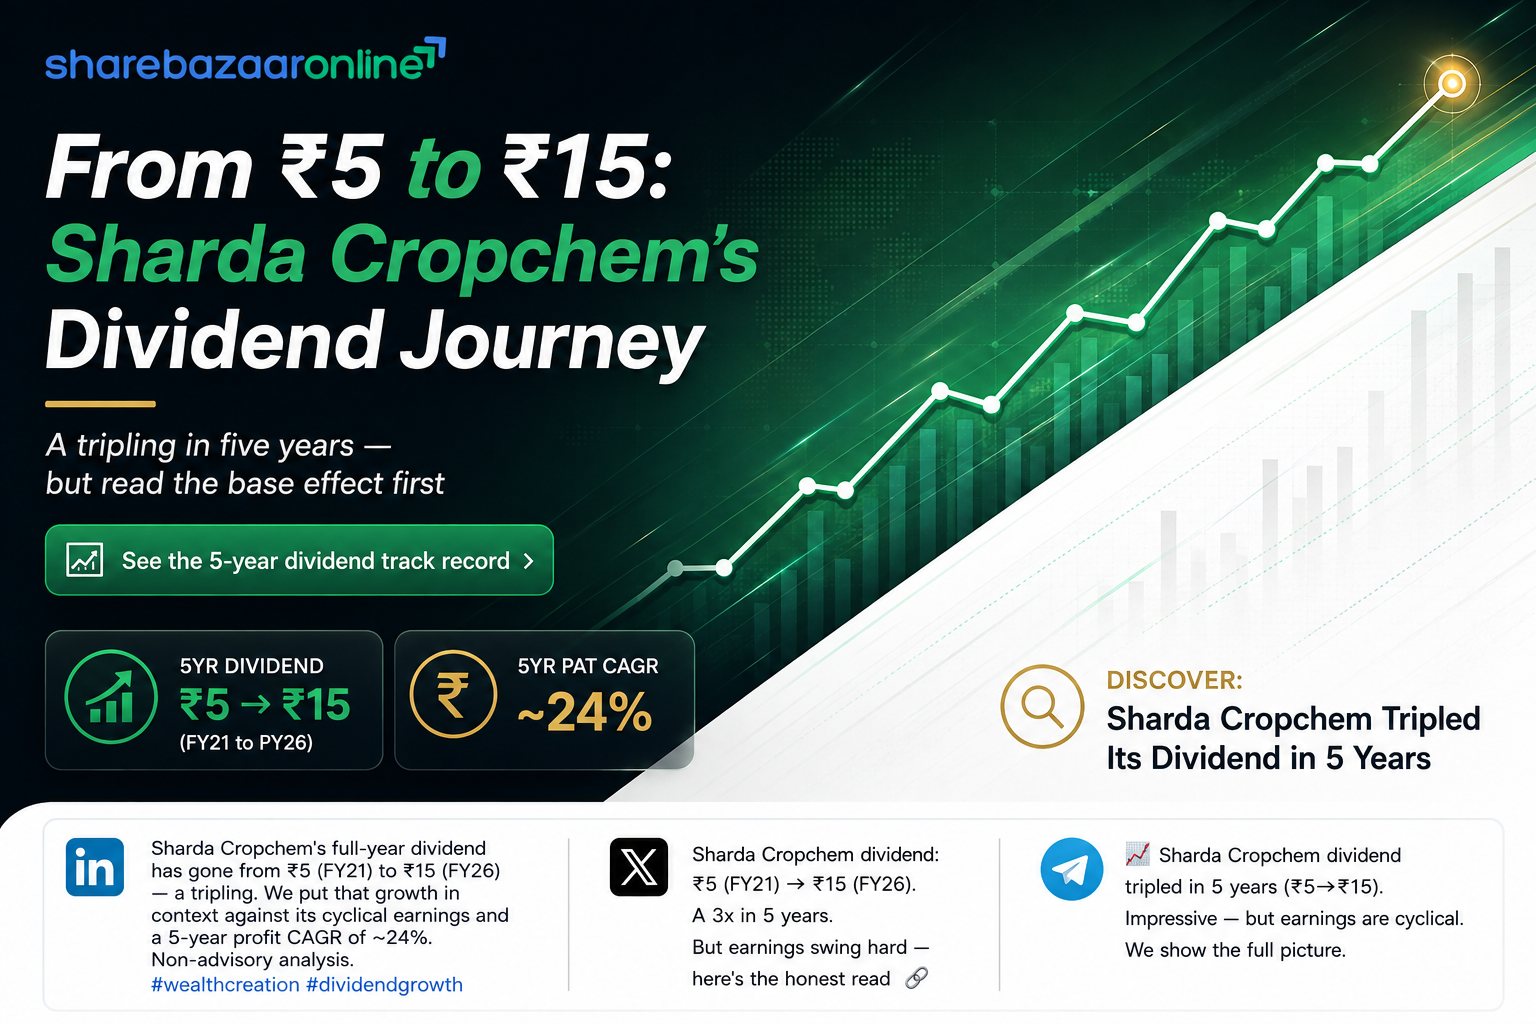
- • The dividend has risen from ₹5 (FY21) to ₹15 (FY26) — a tripling in five years.
- • The company never suspended the dividend, even in the disastrous FY24 when EPS crashed to ₹3.53.
- • In FY24 the payout ratio spiked to ~85% — the dividend was maintained out of reserves, not current profit.
- • Outside FY24, the payout ratio has stayed in a disciplined ~16%–27% band.
Payer Classification
Sharda Cropchem is best described as a consistent but cyclical payer. It has paid every year and grown the absolute dividend over time, which points to consistency. But because its earnings swing sharply with the agrochemical cycle, the payout ratio is volatile year to year. Income investors get a rising dividend; they also get earnings that can halve or double in a single year.
Financial Performance Analysis
FY26 was a strong recovery year on a consolidated basis, but the size of the profit jump needs to be read against a very weak prior base.
| Metric (Consolidated) | FY24 | FY25 | FY26 |
|---|---|---|---|
| Revenue (₹ Cr) | 3,163 | 4,320 | 5,268 |
| Operating Profit (₹ Cr) | 303 | 615 | 1,059 |
| Operating Margin | 10% | 14% | 20% |
| Net Profit (₹ Cr) | 32 | 304 | 681 |
| EPS (₹) | 3.53 | 33.74 | 75.47 |
Operating Leverage At Work
In FY26, revenue grew ~22% but net profit grew ~124%. That gap is positive operating leverage: the operating margin expanded from 14% to 20% as fixed costs were spread over higher sales and product pricing recovered. Other income of ₹142 crore also lifted the bottom line, though the core operating recovery did most of the work.
The Base-Effect Caveat
The eye-catching “+124%” is flattered by the fact that FY24 profit had collapsed to ₹32 crore on margin pressure and inventory write-downs across the global agrochemical industry. Measured against a normal year, FY26’s ₹681 crore is a strong-but-not-miraculous result. The five-year profit CAGR of ~24% is the fairer through-cycle read.
A Warning From The Next Quarter
The final dividend was recommended on 13 May 2026, before Q1 FY27 results were out. Those results (quarter ended June 2026) showed revenue up ~9% to ₹1,074 crore but net profit falling to ₹88 crore from ₹143 crore a year earlier, with operating margin compressing to ~17%. In other words, the cyclicality is still very much alive — a reminder that FY26’s peak margins may not persist.
Cash Flow Analysis
Reported profit is an accounting opinion; cash is a fact. A dividend can only be paid in cash, so the cash flow statement is where dividend safety is really tested.
FY26 Cash Flows (₹ Cr)
- Operating Cash Flow (OCF): 656
- Investing Cash Flow: −445
- Financing Cash Flow: −118
- Free Cash Flow (FCF): 158
- Net Profit for reference: 681
Coverage Of The Payout
- Full-year dividend outflow: ~₹135 Cr
- OCF coverage: ~4.8x — very comfortable
- FCF coverage: ~1.2x — adequate but tight
The OCF-To-FCF Gap: Sharda’s Signature Feature
Notice the drop from ₹656 crore of operating cash to just ₹158 crore of free cash flow. That ₹445 crore of investing outflow is not factories — Sharda outsources most manufacturing. It is largely spending on product registrations and dossiers (recorded as intangible assets), which is the company’s core growth engine and also why depreciation and amortisation ran to ~₹325 crore in FY26. This is an asset-light business at the plant level but a capital-intensive one at the registration level. The practical implication for dividend investors: operating cash easily funds the dividend, but the company reinvests so heavily that free cash flow left over is modest. The dividend is genuinely funded from operations — not from borrowings or asset sales — but it competes with a large, ongoing reinvestment programme.
Balance Sheet Strength
Key Balance Sheet Items (Mar 2026)
- Net Worth: ~₹3,136 Cr
- Book Value: ~₹348 per share
- Total Borrowings: ~₹0 Cr (near debt-free)
- Investments: ~₹361 Cr
- ROE (FY26): ~23%
- ROCE (FY26): ~30%
Why This Supports The Dividend
A near debt-free balance sheet is the single strongest argument for dividend safety here. The company is not paying dividends while borrowing to do so — a red flag we always check for. With no meaningful debt to service and healthy reserves of ~₹3,046 crore, Sharda has the financial cushion to sustain (and even raise through reserves) its dividend during a weak earnings year, exactly as it did in FY24.
The Working-Capital Watch-Point
The one blemish is high debtor days of ~166 — meaning it takes the company more than five months, on average, to collect from customers. This is structural for an exporter selling across Europe, LATAM and other regulated markets, but it ties up cash in receivables and is a key reason operating cash flow can lag reported profit in any given year. It is not a debt problem; it is a cash-conversion-timing issue worth monitoring.
Dividend Sustainability Analysis
We run four standard coverage tests — earnings, operating cash flow, free cash flow and balance-sheet liquidity — and then form an overall verdict.
| Test | Result (full-year ₹15 payout) | Verdict |
|---|---|---|
| Earnings (PAT) | Payout ~20%; EPS covers dividend ~5.0x | Strong |
| Operating Cash Flow | OCF ₹656 Cr covers outflow ~4.8x | Strong |
| Free Cash Flow | FCF ₹158 Cr covers outflow ~1.2x | Adequate / Tight |
| Liquidity / Debt | Near debt-free; reserves ~₹3,046 Cr | Strong |
Overall Verdict: Sustainable
On balance, we classify the dividend as Sustainable. Three of the four tests are clearly strong, and the only amber flag — free cash flow coverage of ~1.2x — reflects the company’s choice to reinvest heavily in product registrations, not any weakness in cash generation. The near debt-free balance sheet and large reserves give management the flexibility to hold the dividend steady even in a down year, as FY24 demonstrated. The realistic risk is not a permanent cut but a payout that may not keep growing at the FY26 pace if earnings normalise from their current peak.
Peer Comparison
Sharda Cropchem competes in the Indian agrochemical and crop-protection space. Where verified figures were not available this session, cells are left blank rather than filled with estimates.
| Company | Approx. Dividend Yield | Payout Style | Balance Sheet |
|---|---|---|---|
| Sharda Cropchem | ~1.9% (trailing) | Consistent, cyclical | Near debt-free |
| PI Industries | Low (growth-focused) — verify | Low payout | Net cash |
| Rallis India | Modest — verify | Moderate payout | Low debt |
| UPL | NIV — verify | Variable | Leveraged |
| Insecticides India | NIV — verify | Low payout | Low debt |
Peer yield, payout and leverage figures are not independently verified this session and are indicative only. Confirm each against current data before publication.
How Sharda Stands Out
Two things distinguish Sharda within the peer set. First, its debt-free balance sheet compares favourably with more leveraged names in the space. Second, its asset-light, registration-driven model gives it high return ratios (ROCE ~30%) but also chunky intangible amortisation and long receivables. On dividend yield it screens at the higher end of a generally low-yield sector, but the trade-off is meaningfully higher earnings volatility than a diversified peer.
Promoter Impact Analysis
Shareholding Pattern (Jun 2026)
- Promoters: 74.82%
- FIIs: 3.12%
- DIIs: 9.18%
- Public & Others: 12.88%
Who Gets The Cash
- Total final-dividend outflow: ~₹81 Cr
- Promoter share (74.82%): ~₹61 Cr
- Public float share (12.88%): ~₹10 Cr
- Full-year to promoters (₹15): ~₹101 Cr
Interpreting The Concentration
With promoters holding almost three-quarters of the company, roughly ₹61 crore of the ₹81 crore final-dividend cheque flows to the promoter family. This is not unusual for a founder-run Indian business, and dividends are paid equally per share, so minority shareholders receive exactly the same ₹9 per share. The alignment is broadly positive: promoters benefit most when the dividend rises, which incentivises steady distributions. The flip side is that a high, stable promoter stake means minority investors have limited influence over capital-allocation choices — whether to pay dividends, reinvest, or buy back stock.
Taxation Analysis
How Dividends Are Taxed In India
Since the abolition of the Dividend Distribution Tax in FY21, dividends are taxable in the hands of the shareholder at their applicable income-tax slab rate. The company also deducts TDS at 10% under Section 194 if the total dividend paid to a resident shareholder in a financial year exceeds ₹5,000 (TDS is 20% where PAN is not furnished). The TDS is not an extra cost — it is adjustable against your final tax liability when you file your return.
Worked Example (1,000 Shares, 30% Slab)
- Shares held: 1,000
- Final dividend: ₹9.00 per share
- Gross dividend: 1,000 × ₹9 = ₹9,000
- TDS @10% (as >₹5,000): ₹900 deducted at source (adjustable)
- Tax @30% slab on ₹9,000: ₹2,700
- Net dividend in hand: ₹9,000 − ₹2,700 = ₹6,300
- Effective post-tax yield (on CMP ₹782): ~0.81%
Illustrative only. Actual tax depends on your total income and slab. Investors in lower slabs (5%/20%) or with total annual dividends below ₹5,000 will pay less or have no TDS.
Key Risks
- 1. Earnings cyclicality. Profit swung from ₹349 Cr (FY22) to ₹32 Cr (FY24) to ₹681 Cr (FY26). Such volatility can pressure the payout ratio and any future dividend growth.
- 2. Margin normalisation. FY26’s 20% operating margin was a peak; Q1 FY27 already showed compression to ~17% with profit down ~38% YoY. If margins mean-revert, so may the dividend’s growth trajectory.
- 3. Currency and export exposure. A large share of revenue comes from Europe, LATAM and other overseas markets, exposing earnings to currency swings and global agrochemical pricing.
- 4. High receivables. Debtor days of ~166 tie up cash and can cause operating cash flow to lag reported profit in weaker years.
- 5. Registration and regulatory dependence. The business model rests on securing and maintaining product registrations; delays, rejections or regulatory changes in key markets could hit growth and cash generation.
- 6. Commodity input costs. Management has itself flagged expected increases in procurement costs, which could squeeze margins if not passed through in pricing.
What To Monitor
- 1. Operating margin trend. Watch whether the ~17% seen in Q1 FY27 stabilises or slides further from the FY26 peak of 20%.
- 2. Free cash flow vs registration spend. Track how much operating cash is absorbed by product-registration investment, since that determines how much is left for dividends.
- 3. Debtor days. Any improvement below ~150 days would meaningfully strengthen cash conversion; further deterioration would be a warning.
- 4. Payout-ratio discipline. Note whether management holds the payout in its normal ~16–27% band or lets it spike again as in FY24.
- 5. Dividend guidance and quarterly results. Watch upcoming interim-dividend declarations and quarterly earnings for the direction of FY27 profit.
- 6. Currency and key-market demand. Monitor euro/rupee moves and demand in Europe and LATAM, the company’s largest markets.
Conclusion
Sharda Cropchem’s ₹9.00 final dividend takes its FY26 total to a record ₹15.00 per share, backed by a ₹681 crore profit and a debt-free balance sheet. On the four sustainability tests, the payout looks sustainable — comfortably covered by earnings and operating cash flow, with only free cash flow coverage running tight because of the company’s heavy reinvestment in product registrations.
The positives: a rising dividend track record that survived even the FY24 earnings collapse, no debt, strong return ratios, and a payout funded genuinely from operations.
The negatives and risks: highly cyclical earnings, a “+124%” headline flattered by a weak base, early signs of margin normalisation in Q1 FY27, elevated receivables, and a real yield of only ~1.9% that is partly a function of an 18% price fall rather than dividend strength alone.
Income-focused investors should weigh a dependable, growing dividend against genuine earnings volatility and a modest absolute yield. The information above is intended to help you reach your own view — the decision remains yours.
Frequently Asked Questions
What dividend has Sharda Cropchem announced for FY26?
What is the Sharda Cropchem dividend yield?
What is the record date for the Sharda Cropchem final dividend?
What is the ex-date for this dividend?
When will the dividend be paid?
Who is eligible to receive the dividend?
How is the Sharda Cropchem dividend taxed?
Is the Sharda Cropchem dividend sustainable?
What is Sharda Cropchem’s dividend history?
Does a “90% dividend” mean a 90% return?
Why did FY26 profit jump 124%?
Is Sharda Cropchem a debt-free company?
What should investors monitor going forward?
How much of the dividend goes to promoters?
Disclaimer
This article is published by ShareBazaar Online for informational and educational purposes only. It is financial journalism and analysis, not investment advice, and does not constitute a recommendation to buy, sell or hold any security. ShareBazaar Online is not registered with SEBI as an investment adviser or research analyst. All figures are drawn from company filings and publicly available sources believed to be reliable but are not guaranteed to be accurate or complete; certain figures (including the live market price, inferred ex-date and undisclosed payment date) require independent verification. Dividend yields are price-dependent and change with the market. Investors should conduct their own due diligence and consult a SEBI-registered financial adviser before making any investment decision. ShareBazaar Online accepts no liability for any loss arising from the use of this information.