
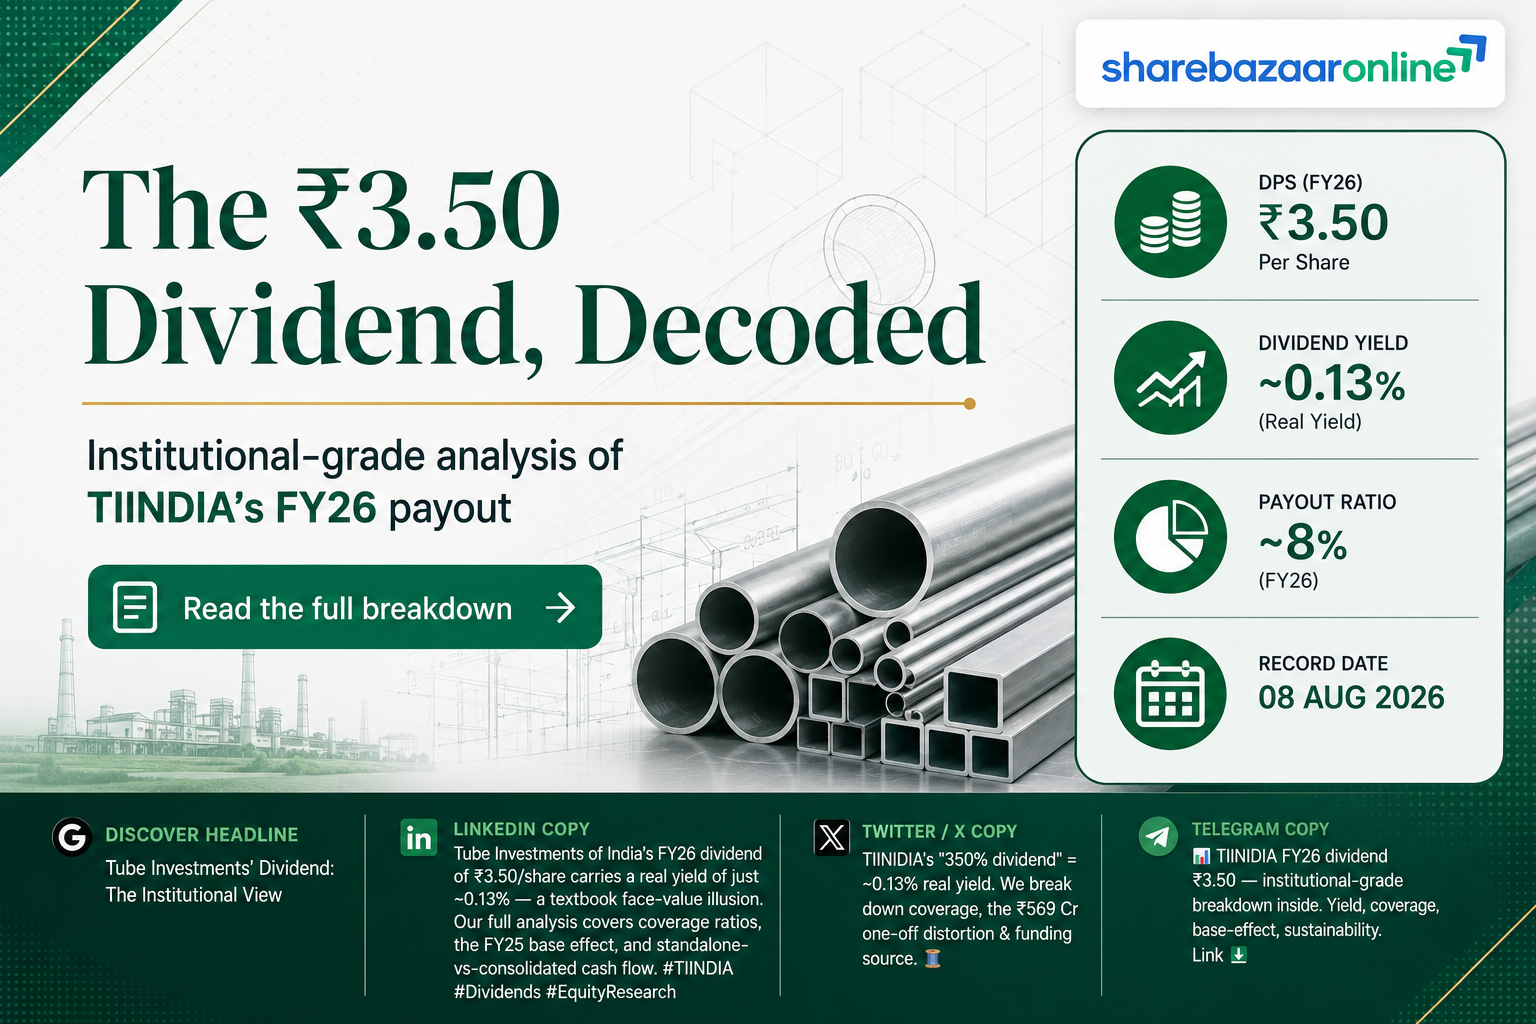
Dividend Snapshot
Tube Investments of India Limited (NSE: TIINDIA, BSE: 540762), the Murugappa Group engineering flagship, has recommended a final dividend of ₹1.50 per equity share of face value ₹1 for FY2025-26. Together with the ₹2.00 interim dividend already paid in February 2026, the total dividend for FY26 works out to ₹3.50 per share. The headline reads like a huge "350% dividend", but on the current market price the real cash yield is only about 0.13% — the single most important number a retail investor needs to internalise before reading further.
Dividend at a glance
- Total FY26 dividend: ₹3.50/share (₹2.00 interim + ₹1.50 final)
- Final dividend: ₹1.50/share (150% of face value)
- Face value: ₹1 per share
- Dividend type: Final (recommended) + Interim (paid)
- Record date (final): 7 August 2026
- Real yield on total ₹3.50 (CMP ~₹2,734): ~0.13%
Company snapshot
- Sector: Auto Components / Diversified Engineering
- Standalone PAT FY26: ₹827.35 Cr
- Standalone EPS FY26: ₹42.76
- Dividend payout (standalone): ~8.2% of PAT
- Market cap: ~₹52,913 Cr
- Promoter holding: 43.93% (Jun 2026)
What wire services miss: TII is not a dividend stock — it is a growth-reinvestment holding company. Its standalone parent collected ₹155.89 Cr of dividends from its own subsidiaries in FY26, which alone covers the entire ₹67.76 Cr payout more than twice over. The dividend you receive is effectively recycled subsidiary cash, not a claim on the group's operating free cash flow — which, at the consolidated level, was actually negative.
Dividend Announcement Summary
At its board meeting held on 13 May 2026, the Board of Directors of Tube Investments of India Limited recommended a final dividend of ₹1.50 (Rupee One and Paise Fifty only) per equity share of ₹1 each for the financial year ended 31 March 2026. This is subject to shareholder approval at the Annual General Meeting. The interim dividend of ₹2.00 per share for FY26 was declared on 4 February 2026 and paid on 25 February 2026.
Board recommendations
- Final dividend of ₹1.50/share recommended for FY2025-26
- Total FY26 dividend of ₹3.50/share (interim + final)
- Long-term borrowing of up to ₹350 Cr approved for FY2026-27 fund requirements
- Audited standalone and consolidated results approved with an unmodified audit opinion
Approval and payment
- Final dividend was subject to approval at the 18th AGM held on 14 August 2026
- If approved, payable within 30 days of the AGM (on or before ~12 September 2026)
- Eligibility was fixed by the register of members as on 7 August 2026
- Total dividend outflow: approximately ₹67.76 Cr (computed)
Note: This analysis is written after the record date. Eligibility for the final dividend was determined as on 7 August 2026 and is referred to in the past tense throughout.
Key Dates Timeline
Final dividend — important dates
- Announcement date: 13 May 2026 (board meeting)
- Record date: 7 August 2026
- Ex-date: 7 August 2026 (as reported; T+1 settlement means ex-date and record date typically coincide — confirm against the official NSE/BSE corporate-action circular)
- AGM: Friday, 14 August 2026 (video conferencing)
- Payment date: Within 30 days of AGM — on or before ~12 September 2026 (specific date to be confirmed by company)
Interim dividend (already paid)
- Declared: 4 February 2026
- Paid: 25 February 2026
- Amount: ₹2.00 per share
Dividend Yield Analysis
This is where the "350% dividend" headline collapses. The percentage a company quotes is always calculated on face value (₹1 here), not on the price you actually pay in the market. Converting to a real yield tells a very different story.
Face value vs real yield
- Quoted "dividend %" (total ₹3.50 on ₹1 FV): 350%
- Quoted "dividend %" (final ₹1.50 on ₹1 FV): 150%
- Real yield, total ₹3.50 at CMP ~₹2,734: ~0.13%
- Real yield, total ₹3.50 at announcement price ~₹2,990: ~0.12%
- Real yield, final ₹1.50 only: ~0.05%
How this compares
- Auto Components industry average yield: ~0.6%
- Indian market bottom-quartile dividend payers: ~0.28%
- TII at ~0.13% sits below even the bottom quartile
- 10-year Indian government bond yields dwarf this many times over
Yield reality check: A ₹3.50 dividend on a share trading near ₹2,734 is not an income proposition. Anyone buying TIINDIA for its dividend is misreading the stock. The market values TII on growth and its portfolio of businesses (a consolidated P/E of ~84x), not on cash returned to shareholders. All yields are price-dependent — re-verify the live CMP before acting on any number here.
Dividend History Analysis
TII has been a consistent but deliberately low dividend payer. It has paid every year in recent memory, but the payout ratio has stayed in single-to-low-double digits — a hallmark of a company retaining cash to fund expansion. The payout ratios below are sourced from consolidated financial data.
Dividend payout ratio trend (consolidated)
- FY19: ~20% | FY20: ~21% | FY21: ~25%
- FY22: ~1% | FY23: ~7% | FY24: ~6%
- FY25: ~10% | FY26: ~11%
- 3-year average payout: ~8.8% of profits (among the lowest in its peer set)
Pattern classification
- Consistent payer — regular annual dividends
- No dividend suspensions in the recent period
- The interim-plus-final structure has become the norm
- FY26 total (₹3.50) is modestly higher than FY25 in payout-ratio terms
Data integrity note
- FY26 per-share dividend (₹3.50) is confirmed from the filing
- Exact per-share amounts for earlier years are Not Independently Verified (NIV) here and should be cross-checked against the annual reports before publication
- Face value has been ₹1 through this period (relevant for like-for-like comparison)
Financial Performance Analysis
On the surface, TII's standalone profit looks like it fell off a cliff: standalone PAT dropped from ₹1,296.66 Cr in FY25 to ₹827.35 Cr in FY26 — a 36% decline. That headline is misleading, and understanding why is central to judging the dividend.
The base-effect trap: FY25's standalone profit included a one-time, non-cash fair-value gain of ₹569 Cr on compulsorily convertible preference shares (CCPS) in a subsidiary. Strip that out and FY25 "core" PAT was ~₹727.66 Cr, against FY26 core PAT of ~₹820.55 Cr — a genuine +12.8% increase, not a collapse. At the consolidated level, profit attributable to owners eased only ~5.5% (₹673.71 Cr to ₹636.84 Cr). The "36% profit fall" that a wire service might headline is largely an accounting mirage.
Standalone FY26 (Rs Cr)
- Total revenue from operations: 8,556.35 (vs 7,892.53) — up ~8.4%
- PBT before exceptional items: 1,105.55 (vs 1,543.53*)
- PAT: 827.35 (vs 1,296.66*)
- EPS: ₹42.76 (vs ₹67.03*)
- *FY25 inflated by the ₹569 Cr CCPS one-off
Consolidated FY26 (Rs Cr)
- Revenue: 22,847 (vs 19,465) — up ~17%
- Net profit (incl. minorities): 1,118 (vs 1,054)
- Profit to owners: 636.84 (vs 673.71)
- ROCE: ~17% | ROE: ~10%
- Operating margin: ~10%
Operating leverage note
Consolidated revenue grew ~17% while owners' profit was broadly flat. The gap reflects heavy investment-phase businesses (semiconductors, electric vehicles, medical) carried within the group that are still scaling and diluting near-term returns — the flip side of a growth-reinvestment strategy. Standalone earnings quality is also worth flagging: a meaningful slice of standalone profit is non-operating dividend income (₹155.89 Cr) from subsidiaries, rather than manufacturing profit.
Cash Flow Analysis
Reported profits are opinions; cash is fact. And on cash, TII tells two very different stories depending on whether you look at the standalone parent or the whole group.
Standalone parent — cash-rich
- Operating cash flow FY26: ₹898.24 Cr
- Capex: ₹233.77 Cr
- Simple free cash flow: ~₹664 Cr
- Company-stated FCF: ~₹826 Cr (~100% of PAT)
- OCF comfortably exceeds PAT — healthy cash conversion
Consolidated group — FCF negative
- Consolidated FCF FY24: ₹-148 Cr
- Consolidated FCF FY25: ₹-22 Cr
- Consolidated FCF FY26: ₹-266 Cr
- Group investing outflow FY26: ~₹3,953 Cr
- Financing inflow FY26: ~₹2,668 Cr (incl. a ₹3,000 Cr QIP at CG Power)
The divergence that matters: the dividend is paid by the standalone parent, which is genuinely cash-generative. But the wider group is consuming cash to build out semiconductors, EVs and other new businesses — it is funding growth with fresh equity and debt, not internal free cash. The dividend is therefore best understood as a small, ring-fenced distribution from a cash-rich parent, sitting on top of a group that is in heavy investment mode.
How the dividend is funded
The FY26 payout of ~₹67.76 Cr is funded from current earnings and subsidiary dividend income, not from borrowings or asset sales. Standalone dividend income of ₹155.89 Cr alone is 2.3x the payout. Working-capital did absorb cash (receivables rose alongside revenue), and consolidated debtor days edged up to ~70, which is worth monitoring, but the parent's dividend is well within its own cash generation.
Balance Sheet Strength
Standalone position (31 Mar 2026)
- Net worth: ₹5,987.39 Cr
- Cash & equivalents: ₹55.32 Cr
- Bank balances (other): ₹51.14 Cr
- Current investments: ₹277.02 Cr
- Total liquid: ~₹383 Cr
- Borrowings: nil (FY25: ₹100 Cr); lease liabilities ~₹50 Cr
What this means for the dividend
- Standalone parent is essentially net-cash (~₹333 Cr liquid net of leases)
- Book value per share: ~₹400 (consolidated)
- Large strategic investments in subsidiaries: ₹3,499 Cr (not liquid, but valuable)
- The ₹67.76 Cr dividend is trivial against liquidity — affordability is not in question
Note: The ₹350 Cr long-term borrowing approved for FY2026-27 is for the company's general fund requirements, not to fund dividends. Consolidated group borrowings are higher (~₹754 Cr) and should be viewed separately from the debt-light parent.
Dividend Sustainability Analysis
Sustainability is assessed against four standard coverage tests, using the standalone parent (the entity that actually pays).
Coverage tests
- Earnings cover: EPS ₹42.76 ÷ DPS ₹3.50 = 12.2x — very comfortable
- Cash cover: liquid ~₹383 Cr ÷ outflow ₹67.76 Cr = 5.7x
- FCF cover (standalone): ~₹826 Cr ÷ ₹67.76 Cr = 12.2x
- Dividend-income cover: ₹155.89 Cr ÷ ₹67.76 Cr = 2.3x (subsidiary dividends alone)
Verdict
Sustainable. With a payout of only ~8% of standalone PAT, 12x earnings and FCF cover, a net-cash parent balance sheet, and a rising underlying earnings trend (core PAT +12.8%), the dividend is highly secure. The real question for investors is not whether it is sustainable, but whether it is large enough to matter — and at ~0.13% yield, it is not the reason to own the stock.
Peer Comparison
TII is classified under Auto Components, though it is really a diversified engineering conglomerate. Against fellow engineering / auto-ancillary names, its yield is very low but so is its payout — consistent with its growth positioning.
Dividend yield & payout (approximate, for context)
- Tube Investments (TIINDIA): yield ~0.13%, payout ~8-11%, ROCE ~17%, ROE ~10%
- Sundram Fasteners: yield ~0.7-0.9%, payout ~30%
- Bharat Forge: pays regular dividends (interim + final); yield low single digits
- Auto Components industry average yield: ~0.6%
Data integrity: peer figures are indicative and drawn from third-party aggregators; ROE/ROCE and cash-position cells for peers are intentionally left unquantified here rather than populated with unverified data. Verify against each company's latest filing before publishing a formal peer table.
Reading the comparison: peers like Sundram Fasteners return roughly a third of profit to shareholders and yield several times more. TII's much lower payout is a capital-allocation choice, not weakness — it is retaining cash to build new businesses. Income-focused investors screen it out; growth investors accept the negligible yield.
Promoter Impact Analysis
Promoter dividend income
- Promoter holding: 43.93% (Jun 2026)
- Promoter share of final ₹1.50 dividend: ~₹12.76 Cr
- Promoter share of total ₹3.50 dividend: ~₹29.77 Cr
- Minority shareholders receive the balance ~₹37.99 Cr
Distribution & ownership trend
- Because the dividend is small, promoter cash benefit is modest
- Promoter holding has drifted down gradually (46.5% in FY22 to 43.9% now)
- FII holding fell sharply: ~28.3% (FY24) to ~21.4% (Mar 2026)
- DII holding rose: ~14.8% to ~21.8% — a clear institutional rotation
The low payout means promoters are not extracting large cash via dividends; the group's return comes from long-term value creation in the underlying businesses. The more notable ownership story is the swing from foreign to domestic institutions over the past two years.
Taxation Analysis
Since the abolition of the Dividend Distribution Tax in FY2020-21, dividends are taxable in the hands of the shareholder at their applicable income-tax slab rate.
Key rules (FY2025-26)
- Dividend added to total income; taxed at slab rate (up to 30% + surcharge + 4% cess)
- TDS under Section 194: 10%, but only if total dividend from the company exceeds ₹10,000 in the financial year (threshold raised from ₹5,000 in Budget 2025)
- No PAN: TDS at 20%
- Non-residents: 20% TDS (Section 195), subject to DTAA relief
- Interest on money borrowed to buy shares is deductible up to 20% of dividend income (Section 57)
Worked example
Generic (₹10/share, 1,000 shares, 30% slab): gross ₹10,000; TDS at 10% applies only above ₹10,000, so borderline; slab tax ₹3,000; net in hand ~₹7,000.
TII actual (₹3.50/share, 1,000 shares, 30% slab): gross ₹3,500; no TDS (below ₹10,000); slab tax ₹1,050; net dividend ₹2,450; effective post-tax yield still a fraction of a percent.
Practical takeaway: a retail holder would need to own roughly 2,857+ TII shares (dividend above ₹10,000/year) before any TDS is deducted at all. For most small investors, the entire ₹3.50/share arrives without TDS, but it still has to be declared and taxed at slab rate when filing returns.
Key Risks
- 1. Growth-investment drag: new businesses (semiconductors via CG Power, EVs via TI Clean Mobility, medical) are cash-consuming and still scaling; consolidated free cash flow has been negative for three years and near-term returns are diluted.
- 2. Rich valuation: at a consolidated P/E of ~84x and ROE of ~10%, the stock prices in substantial future growth; any execution slippage in the new verticals could de-rate the shares. It has already fallen ~11% over the past year.
- 3. Cyclical core: the Engineering and Metal Formed Products segments are tied to automotive, construction and industrial cycles; a demand slowdown pressures the cash-generative parent.
- 4. Working-capital creep: consolidated debtor and inventory days have risen (debtor days ~70), lengthening the cash conversion cycle.
- 5. Negligible income appeal: for anyone buying on the "high dividend %" headline, the ~0.13% real yield is a mismatch of expectations — a behavioural rather than fundamental risk.
What To Monitor
- 1. Path to positive consolidated FCF: watch whether the new businesses start converting revenue into cash, turning group free cash flow positive.
- 2. CG Power & semiconductor build-out: the ₹3,000 Cr QIP and the OSAT/semiconductor investments are the swing factor for consolidated returns.
- 3. EV / TI Clean Mobility losses: track the trajectory of the electric-vehicle segment losses and funding needs.
- 4. Margins & operating leverage: whether ~10% consolidated operating margin expands as new-business scale improves.
- 5. Payout policy: any shift toward a higher payout would signal management's view that the heavy-investment phase is maturing.
- 6. Institutional flows: continuation or reversal of the FII-out / DII-in rotation seen over the last two years.
Conclusion
Positives
- Dividend is highly secure — ~8% payout, 12x earnings and FCF cover, net-cash parent
- Underlying (ex one-off) earnings actually grew ~13% at the standalone level
- Consolidated revenue up ~17%; diversified into high-potential new sectors
- Debt-light standalone balance sheet with strong cash conversion
Negatives / cautions
- Real dividend yield ~0.13% — irrelevant as an income source
- Consolidated free cash flow negative for three years running (growth spending)
- Rich valuation (~84x P/E) with ROE compressed to ~10%
- Reported standalone profit "fall" is a base-effect illusion, easily misread
The bottom line: TII's dividend is safe but tiny. This is a growth-and-reinvestment company that pays a token dividend, not an income stock. The interesting analysis is not the payout itself but what the payout reveals — a cash-rich parent recycling subsidiary dividends while the wider group pours cash into building its next generation of businesses. Investors should weigh the positives, negatives, risks and monitoring factors and reach their own conclusion.
Frequently Asked Questions
What dividend has Tube Investments of India announced for FY2025-26?
What is the dividend yield of TIINDIA?
What was the record date for the Tube Investments final dividend?
What is the ex-date for the dividend?
When will the dividend be paid?
Who was eligible for the dividend?
How is this dividend taxed?
Is the Tube Investments dividend sustainable?
What is the dividend history of TIINDIA?
Why did Tube Investments' profit appear to fall in FY26?
Is Tube Investments of India a good dividend stock?
What should investors monitor going forward?
How much dividend income do promoters receive?
Disclaimer
This article is for informational and educational purposes only and constitutes financial journalism, not investment advice. It does not contain any buy, sell or hold recommendation. ShareBazaar Online is not a SEBI-registered investment adviser. Figures are drawn from the company's audited filings and third-party sources believed to be reliable; some items are marked as "Not Independently Verified" or approximate and must be confirmed before reliance. All dividend yields are price-dependent and change with the live market price. Dividend, tax and corporate-action details should be verified against official NSE/BSE circulars and the company's disclosures. Taxation depends on individual circumstances; consult a qualified tax professional. Investments in securities are subject to market risks — read all related documents carefully. Please do your own research or consult a SEBI-registered adviser before making any investment decision.