
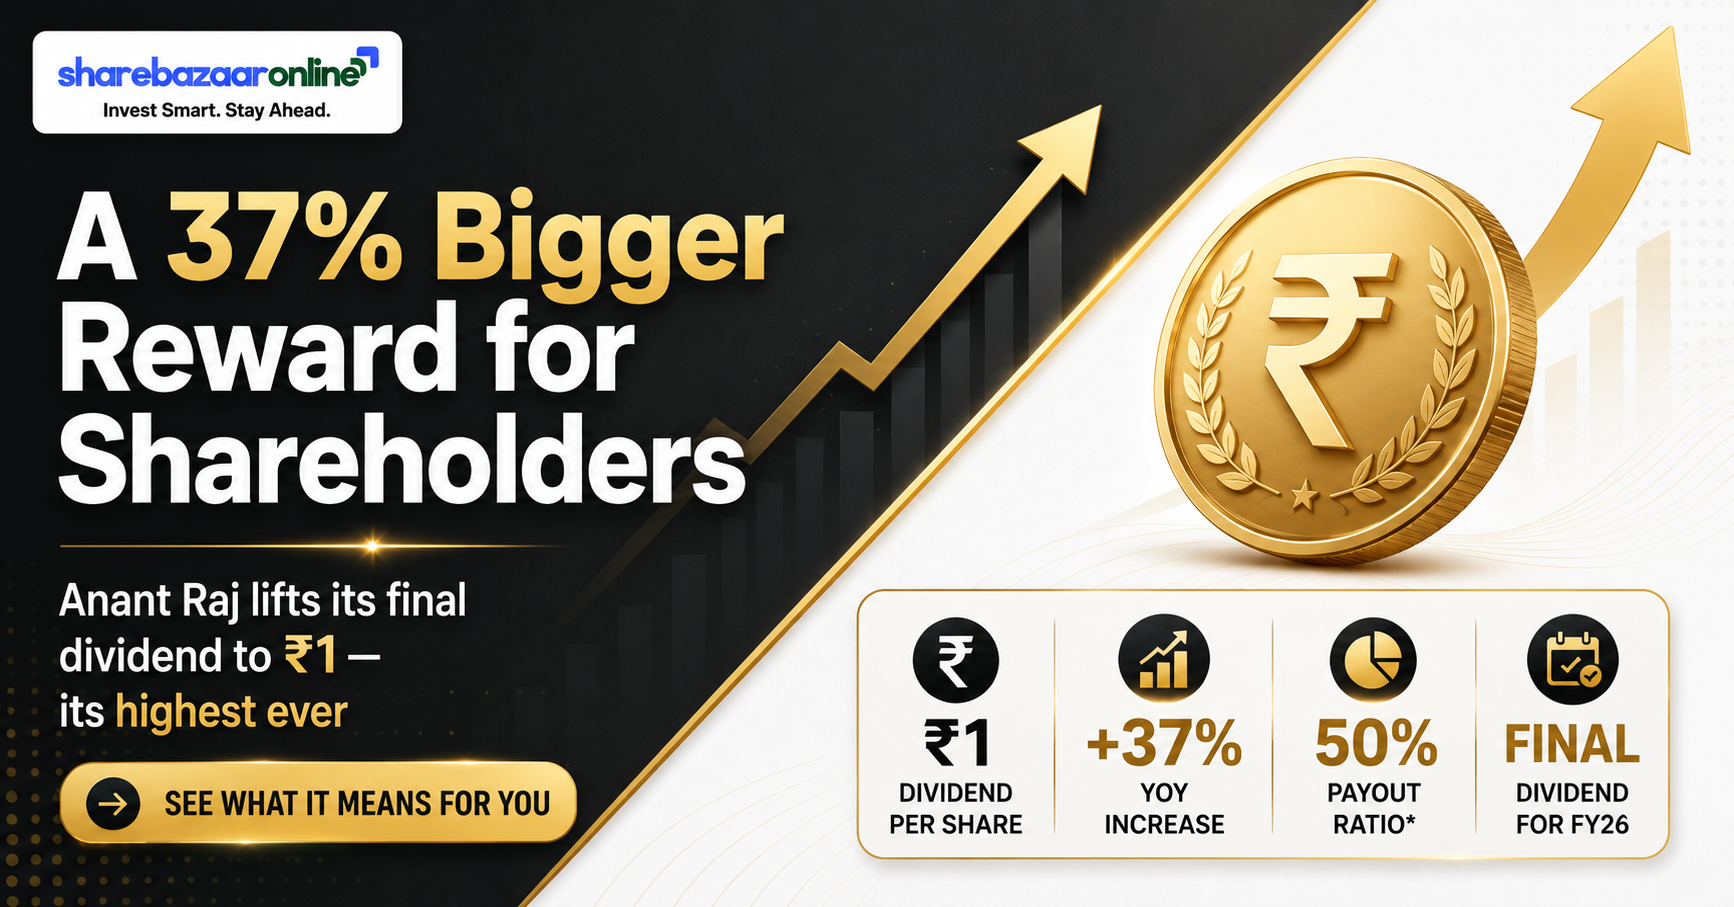
Dividend Snapshot
Company
Anant Raj Limited (NSE: ANANTRAJ · BSE: 515055)
Dividend
₹1.00 per share · Final · FY2025-26
Dividend %
50% of ₹2 face value
Dividend Yield
~0.16% (at CMP ₹610, 30-Jul-2026 — re-verify)
Record / Ex-Date
31 July 2026 (ex-date inferred, T+1)
AGM
07 August 2026 — approval pending
Payment Date
Within 30 days of declaration (specific date not disclosed by company)
Total Outflow (est.)
≈ ₹36 crore (35.99 cr shares × ₹1)
Dividend Announcement Summary
At its board meeting on 11 May 2026, the Board of Directors of Anant Raj Limited recommended a final dividend of Re. 1 per equity share (50%) on shares of ₹2 face value for the financial year ended 31 March 2026. The company's filing stated the dividend would be "paid/dispatched to the shareholders within 30 days of declaration," with the record date to be announced separately.
At a subsequent board meeting on 27 June 2026, the company fixed 31 July 2026 as the record date and convened its 41st Annual General Meeting for 07 August 2026. As a final dividend, the payout is subject to shareholder approval at that AGM before it can be paid.
The same 11 May board meeting also approved the appointment of Sh. Anish Sarin as Whole-time Director (grandson of founder Sh. Ashok Sarin), and — significantly — constituted a committee to evaluate a demerger of the Data Centre business from the Real Estate business. Investors reading this dividend note should treat that demerger as the more material corporate event.
Key Dates Timeline
11 May 2026 — Board recommends ₹1 final dividend (announcement)
27 June 2026 — Record date fixed; AGM convened
31 July 2026 — Ex-Date (inferred, T+1 convention)
31 July 2026 — Record Date (shareholder cut-off)
07 Aug 2026 — 41st AGM (approval)
Payment — within 30 days of declaration (exact date Not Disclosed by Company)
Ex-date is not company-disclosed; inferred as record date under the T+1 settlement convention. Confirm against the exchange corporate-action circular before publishing.
Dividend Yield Analysis
Yield at current price (₹610)
0.16%
Yield on announcement-day close (₹538.55, 11-May-26)
0.19%
Post-tax yield (30% slab holder)
~0.11%
Yield reality check. This is one of the lowest yields in the listed real-estate space. It is low for a straightforward reason: the payout is deliberately small relative to a share price that has re-rated on the data-centre growth story (52-week range roughly ₹403–₹744). A ₹610 share paying ₹1 simply cannot generate meaningful yield.
Do not read the yield as a sign of distress or a falling price. The stock is up over the past year; the low yield reflects a conscious choice to retain capital for expansion, not weak dividends against a collapsing price.
Dividend History Analysis
| Financial Year | Dividend / Share | % of Face Value | Note |
|---|---|---|---|
| FY26 | ₹1.00 | 50% | Current — highest ever |
| FY25 | ₹0.73 | 36.5% | Flat vs FY24 |
| FY24 | ₹0.73 | 36.5% | — |
| FY23 | ₹0.50 | 25% | Step-up |
| FY22 | ₹0.12 | 6% | Recovery |
| FY21 | ₹0.10 | 5% | Recovery |
| FY20 | ₹0.08 | 4% | COVID-era cut (from ₹0.24) |
| FY17–FY19 | ₹0.24 | 12% | Prior stable band |
Compiled from exchange corporate-action records (TipRanks/BSE). All figures on ₹2 face value — no split adjustment required over this window.
Classification: Consistent Payer, currently in a multi-year growth phase — but with a COVID-era reset. Anant Raj has paid a dividend every year for over a decade without a single suspension. However, the honest picture is not one of unbroken growth: the dividend was cut roughly two-thirds in FY20 (₹0.24 → ₹0.08) during COVID, then rebuilt steadily. FY26's ₹1.00 finally takes the payout above its pre-COVID ₹0.24 band. The trajectory since FY22 is genuinely upward (₹0.12 → ₹0.50 → ₹0.73 → ₹1.00), but the absolute amounts remain token relative to earnings.
Financial Performance Analysis (Consolidated)
| Metric (₹ Cr) | FY26 | FY25 | Growth |
|---|---|---|---|
| Revenue from operations | 2,511.60 | 2,059.97 | +21.9% |
| Profit before tax | 661.94 | 490.53 | +34.9% |
| Net profit (total) | 557.02 | 425.82 | +30.8% |
| EPS (basic, ₹) | 15.81 | 12.43 | +27.2% |
On the reported numbers, FY26 was a strong year: revenue up ~22%, net profit up ~31%. Operating leverage worked — profit grew faster than revenue, helped by margin expansion in both real estate and the scaling data-centre business.
Two non-obvious adjustments to keep in mind. First, EPS grew slower than net profit (+27% vs +31%) because the October 2025 QIP (1.66 crore new shares) diluted the per-share base. Second, the effective tax rate was low at roughly 16%, aided by a deferred-tax credit of ₹10.96 crore — so a small slice of profit growth is a tax/accounting effect rather than pure operations. Neither changes the direction, but both temper the headline.
Cash Flow Analysis — The Number Wire Services Miss
The headline finding: profit was ₹557 crore, but operating cash flow was negative ₹434.77 crore.
Reported profit is an accounting opinion; cash is a fact. In FY26, Anant Raj's operations consumed ₹434.77 crore of cash even as the P&L showed a record ₹557 crore profit — a gap of nearly ₹992 crore between reported earnings and cash generated.
Operating cash profit (before working capital)
₹671.07 cr
Cash used by working-capital swings
−₹997 cr (approx)
Net operating cash flow (OCF)
−₹434.77 cr
Free cash flow (OCF − capex ₹258 cr)
−₹693 cr
Why the gap? Working capital ballooned. Within operations, "other financial assets" rose ₹613 crore, other assets ₹177 crore, and trade receivables ₹123 crore, while other liabilities fell ₹277 crore. This is the classic real-estate pattern: revenue is booked on percentage-of-completion, but the matching cash is locked up in projects and unbilled/uncollected receivables. Profit is recognised well before cash arrives.
So how is the dividend funded? Not from operating cash — there wasn't any. The company's ₹911 crore cash balance and the dividend both trace back to financing inflows of ₹1,234 crore, dominated by the ₹1,096.68 crore QIP premium raised in October 2025. In plain terms: this dividend is paid out of raised equity capital and reserves, not out of cash the business earned this year.
Balance Sheet Strength
Cash & bank balances
₹911 cr
Gross borrowings
₹606 cr (+ ₹74 cr leases)
Net position (ex-lease)
Net cash ~₹305 cr
Debt-to-equity (gross)
0.10x
Total equity (parent)
₹5,789 cr
Book value / share
₹161
Price-to-book (at ₹610)
3.8x
ROE (FY26, approx)
11.2%
Dividend Sustainability Scorecard
| Test | Metric | Verdict |
|---|---|---|
| Earnings coverage | EPS ₹15.81 vs DPS ₹1.00 = 15.8x | Pass |
| Cash / balance-sheet coverage | ₹911 cr cash vs ₹36 cr outflow = 25x | Pass |
| Operating cash-flow coverage | OCF −₹435 cr | Fail |
| Free cash-flow coverage | FCF −₹693 cr | Fail |
Verdict: Moderately Sustainable — affordable, but not "earned."
The dividend is trivially affordable: at ₹36 crore it is a rounding error against a ₹911 crore cash pile and is covered nearly 16 times by reported earnings. Continuation is very likely. But it fails both cash-flow tests — neither operating nor free cash flow funded it this year. Income investors should understand this is a token distribution on a capex-hungry growth company, sustained by balance-sheet strength (much of it externally raised), not by surplus cash the business is throwing off.
Peer Comparison (Listed Real Estate)
| Company | Latest DPS | Div Yield | Payout | ROE |
|---|---|---|---|---|
| Anant Raj | ₹1.00 | ~0.16% | ~6% | ~11% |
| Oberoi Realty | ₹2.00 | ~0.4% | ~13–19% | — |
| Godrej Properties | ₹10.00 | — | — | — |
| DLF | — | ~0.5% | — | — |
| Sector average | — | ~3.3%* | — | — |
Cells marked "—" left blank where the figure could not be verified from a primary source. *Broad sector-average yield per third-party aggregators; not a like-for-like real-estate figure. Verify all peer cells before publishing.
Promoter Impact Analysis
Promoter holding (latest)
57.41% (was 60.12%)
Promoter dividend income (est.)
≈ ₹20.7 cr
Public / minority income (est.)
≈ ₹15.3 cr
Of the ~₹36 crore total outflow, roughly ₹20.7 crore flows to the Sarin promoter family. More noteworthy than the dividend, however, is the dilution: the October 2025 QIP cut promoter holding from 60.12% to 57.41%. The promoters chose to dilute their own stake (and accept a smaller share of future dividends) to fund expansion — a capital-allocation signal that says growth is being prioritised over concentrated ownership or cash returns.
Dividend Taxation — With Worked Example
Since FY2020-21, dividends are taxable in the hands of the shareholder at their applicable income-tax slab rate (the Dividend Distribution Tax was abolished). The company deducts TDS under Section 194 at 10% only if a resident's total dividend from that company in the year exceeds ₹5,000. Form 15G/15H can be filed by eligible individuals to avoid TDS; non-residents are taxed per Section 195 / applicable DTAA.
Worked example — investor holding 1,000 shares, 30% tax slab:
- Gross dividend: 1,000 × ₹1 = ₹1,000
- TDS u/s 194: ₹0 (below the ₹5,000 threshold)
- Tax payable at 30% + 4% cess (~31.2%): ₹312
- Net dividend in hand: ₹688
- Effective post-tax yield at ₹610: ~0.11%
Key Risks
1. Cash-conversion risk. Reported profit is running far ahead of operating cash (OCF was −₹435 cr in FY26). If receivables and unbilled revenue keep outpacing collections, the company stays dependent on external funding.
2. Execution & capex risk. A planned ~₹20,000 crore data-centre build-out (357 MW target) is enormous relative to current profitability. Delays, cost overruns, or slower-than-expected data-centre demand would strain returns.
3. Demerger uncertainty. The proposed Real Estate / Data Centre demerger could reshape the dividend policy, share structure and valuation of whatever an investor ends up holding.
4. Dilution risk. The company has already raised ₹1,100 crore via QIP and diluted promoters to 57.4%. Further large capital raises to fund capex could dilute per-share metrics again.
5. Cyclicality & rates. Both real estate and data-centre demand are sensitive to interest rates and the broader economic cycle; a downturn would hit pre-sales and leasing.
What To Monitor
1. Operating cash flow. The single most important line. Watch whether FY27 OCF turns positive as projects are delivered and cash is collected.
2. Data-centre commissioning & utilisation. Track MW of IT load operationalised versus the 357 MW plan, and how quickly capacity fills.
3. Demerger scheme terms. Follow the committee's proposal — entity structure, share entitlement ratio, and each entity's dividend intent.
4. Working-capital & receivables trend. Watch whether "other financial assets" and receivables keep swelling or begin to normalise.
5. Funding mix for capex. Debt vs further equity raises — the balance will determine future dilution and gearing.
Conclusion
Anant Raj's ₹1 final dividend is best understood as a symbolic 37% raise, not an income event. It yields ~0.16%, costs the company just ~₹36 crore, and is amply covered by earnings and cash on the balance sheet.
The differentiated point ShareBazaar readers should take away is the one aggregators skip: the record profit did not convert to cash. Operating and free cash flow were both deeply negative, and the dividend — like the ₹911 crore cash pile — is effectively funded by the October 2025 QIP, not by cash the business earned. That is neither unusual nor alarming for a real-estate developer in an aggressive capex phase, but it reframes the story: this is a growth-and-capex company that pays a token dividend, with a demerger on the horizon that matters far more to shareholders than the ₹1 payout itself.