
Dividend Snapshot
Manba Finance Limited (NSE: MANBA | BSE: 544262), a Mumbai-based two-wheeler and vehicle-financing NBFC, has declared a First Interim Dividend of ₹0.25 per equity share for the financial year 2026-27. The payout was approved at the Board meeting held on 27 July 2026, alongside the company's unaudited results for the quarter ended 30 June 2026. On a face value of ₹10, the ₹0.25 dividend works out to a 2.5% coupon on face value — but only about 0.19% as a real yield on the current market price, a gap every income-focused reader should understand before anything else.
Dividend Per Share
₹0.25
First Interim Dividend, FY2026-27
Face Value
₹10.00
Coupon on face value: 2.5%
Real Dividend Yield
~0.19%
On CMP ₹132.28 (last verified close, 29 Jul 2026)
Total Dividend Outflow
~₹1.26 crore
On ~5.02 crore shares (₹125.60 lakh)
Record Date
7 Aug 2026
Eligibility now closed
Payment Timeline
By 20 Aug 2026
Statutory outer limit per filing
Dividend Announcement Summary
In its Regulation 30 board-outcome intimation to the exchanges, Manba Finance confirmed that its Board of Directors declared the First Interim Dividend of ₹0.25 per equity share (face value ₹10 each) for FY2026-27. Because this is an interim dividend declared by the Board, it does not require separate shareholder approval at an AGM — it is effective on declaration. The company also fixed Friday, 7 August 2026 as the record date under Regulation 42 and stated the dividend would be paid on or before 20 August 2026.
What the Board approved on 27 July 2026
- Unaudited financial results for Q1 FY27 (quarter ended 30 June 2026) with limited review report
- First Interim Dividend of ₹0.25 per share for FY2026-27
- Record date of 7 August 2026 for dividend eligibility
- Security cover certificate and NCD proceeds-utilisation statements
Why this matters
Manba has now paid a ₹0.25 interim dividend in every declared cycle since its September 2024 listing. The pattern signals a steady token-distribution policy from a growth-stage NBFC — useful as a governance signal, but immaterial as an income source. The story here is not the ₹0.25; it is the Q1 results the dividend rode in on, and what a capital-hungry lender's decision to distribute at all tells you.
Key Dates Timeline
| Event | Date | Source / Note |
|---|---|---|
| Board meeting & declaration | 27 July 2026 (Mon) | Confirmed in Reg 30 filing |
| Ex-dividend date | 7 August 2026 (Fri) | Aligned with record date under T+1; corroborated by exchange data |
| Record date | 7 August 2026 (Fri) | Confirmed in Reg 42 filing |
| Payment (outer limit) | On or before 20 August 2026 | Exact credit date: Not Disclosed by Company |
The record date has already passed. Eligibility was determined by holdings as of the close of 7 August 2026; shares bought on or after the ex-date did not carry the dividend entitlement.
Dividend Yield Analysis
The face-value illusion
A “2.5% dividend” sounds meaningful. It is not what shareholders actually earn. That 2.5% is the coupon on the ₹10 face value — a bookkeeping figure. The number that matters is the yield on the price you pay in the market:
Coupon on face value
2.50%
₹0.25 ÷ ₹10 — the headline figure
Real yield on market price
~0.19%
₹0.25 ÷ ~₹132.28 — what you actually earn
On the announcement-date price (approximately ₹133 around 27 July 2026, not precisely confirmed), the yield is essentially identical at about 0.19%. Put plainly: a ₹1 lakh position in Manba earns roughly ₹190 a year from this dividend line. Manba is a growth NBFC, not an income stock. Anyone buying it for dividend income is reading the wrong number. The 2.5% face-value coupon is a governance gesture; the 0.19% real yield is the economic reality.
Dividend History Analysis
Manba Finance listed on 30 September 2024 and began distributing almost immediately. Since then it has repeatedly declared interim dividends of a flat ₹0.25 per share. The absolute amount has never changed — a fixed quarterly-style token rather than an earnings-linked payout that grows with profit.
| Financial Year | Dividend Per Share | Note |
|---|---|---|
| FY2026-27 | ₹0.25 (first interim, ongoing) | Declared 27 Jul 2026 — this event |
| FY2025-26 | ₹0.50 (two interims of ₹0.25) | Second interim record date 6 Feb 2026 |
| FY2024-25 | ₹0.25 per interim (first post-listing cycle) | First interim record date 4 Nov 2024; aggregator totals for the year vary — verify against filings |
Third-party aggregators disagree on the exact FY2024-25 full-year total (figures ranging from ₹0.50 to ₹1.00 appear across sources). Individual ₹0.25 declarations are well documented; the annual sum should be reconciled to company filings before being stated as fact.
Classification: Consistent (token) payer
On a track record this short, Manba reads as a consistent payer of a fixed token amount rather than a growing-dividend compounder. There have been no cuts or suspensions, but nor has the per-share amount risen despite profit growth — because the policy is signalling, not distribution.
Financial Performance Analysis
The dividend rode in on a strong Q1 FY27 (quarter ended 30 June 2026). Revenue from operations rose 38.2% year-on-year to ₹92.61 crore and profit after tax grew 36.0% to ₹13.26 crore, with EPS improving to ₹2.64 from ₹1.94. But two details beneath the headline deserve attention.
Growth scorecard (YoY, Q1 FY27 vs Q1 FY26)
- Revenue from operations: +38.2% (₹92.61 cr)
- Interest income: +35.0% (₹85.12 cr)
- Net interest income: +35.8% (₹41.61 cr)
- PBT: +32.2% (₹16.11 cr)
- PAT: +36.0% (₹13.26 cr)
Earnings-quality flag: the “total income” gap
Total income grew only 34.2% versus 38.2% for core revenue. The reason is a collapse in other income — from ₹201.52 lakh a year ago to just ₹0.19 lakh this quarter. The prior-year base carried a roughly ₹2 crore one-off. Stripping that out, the underlying operating growth is cleaner and stronger than the total-income line suggests — a rare case where the “lower” number is actually the better-quality one.
The number that rose fastest: credit costs
Impairment on financial instruments jumped 82.3% year-on-year to ₹7.91 crore — more than double the pace of revenue growth. For a lender, provisioning growing far faster than the book is the single most important line to watch. It did not dent this quarter's profit (asset-quality ratios still improved), but it is the metric that would turn first if the loan book sours.
Sequential read (QoQ, vs Q4 FY26)
Revenue was essentially flat quarter-on-quarter (−0.9%), yet PAT rose 19.2% — helped by lower impairment (−8.4% QoQ) and a favourable tax line (a ₹121.08 lakh deferred-tax credit). The PBT margin held broadly steady at 17.39% of total income (vs 17.65% a year earlier), so the sequential profit jump is more about provisioning and tax timing than a step-change in operating leverage.
Cash Flow Analysis
Why the usual cash-flow test does not apply cleanly to an NBFC
For a manufacturer, you compare operating cash flow (OCF) and free cash flow (FCF) against the dividend. For a lending NBFC like Manba, that test is misleading. A growing loan book means cash flows out as disbursements — so reported operating cash flow is routinely negative even when the business is thriving. Loan growth is Manba's core activity, not a cash drain to be alarmed about. FCF coverage is therefore not a meaningful sustainability metric here, and we do not treat negative operating cash flow as a red flag on its own.
How this dividend is actually funded
The ₹1.26 crore outflow is funded out of current profits (Q1 PAT alone was ₹13.26 crore) and sits against a large on-balance-sheet liquidity buffer. It is not funded by fresh borrowing raised specifically to pay it, nor by asset sales.
Liquidity backstop (as at 30 June 2026)
- Cash & cash equivalents: ₹98.85 cr
- Other bank balances: ₹37.08 cr
- Investments: ₹108.58 cr
- Liquidity Coverage Ratio: 1.52
Cash and bank balances alone (₹135.93 crore) cover the dividend outflow roughly 108 times over. Affordability, in cash terms, is simply not in question. The genuine question is one of capital allocation, addressed below.
Balance Sheet Strength
Manba's balance sheet is sound but visibly gearing up to fund growth. Two prudential trends move in opposite directions and should be read together.
Net Worth (30 Jun 2026)
₹423.09 cr
Up from ₹378.85 cr a year earlier
Capital Adequacy (CRAR)
24.40%
Down from 28.21% — still well above the 15% NBFC minimum
Debt-to-Equity
3.43x
Rising from 2.90x — leverage building
Asset Quality (Gross Stage 3)
3.60%
Improved from 3.84%; Net Stage 3 at 2.69% (from 2.95%)
The takeaway: asset quality is improving even as the book expands, which is reassuring. But the capital cushion is being drawn down (CRAR 28.21% → 24.40%) and leverage is climbing (D/E 2.90 → 3.43). Neither is alarming in isolation — both remain comfortably inside regulatory and covenant limits — but they are the reason distributing capital, however small the amount, is worth scrutinising rather than applauding automatically.
Dividend Sustainability Analysis
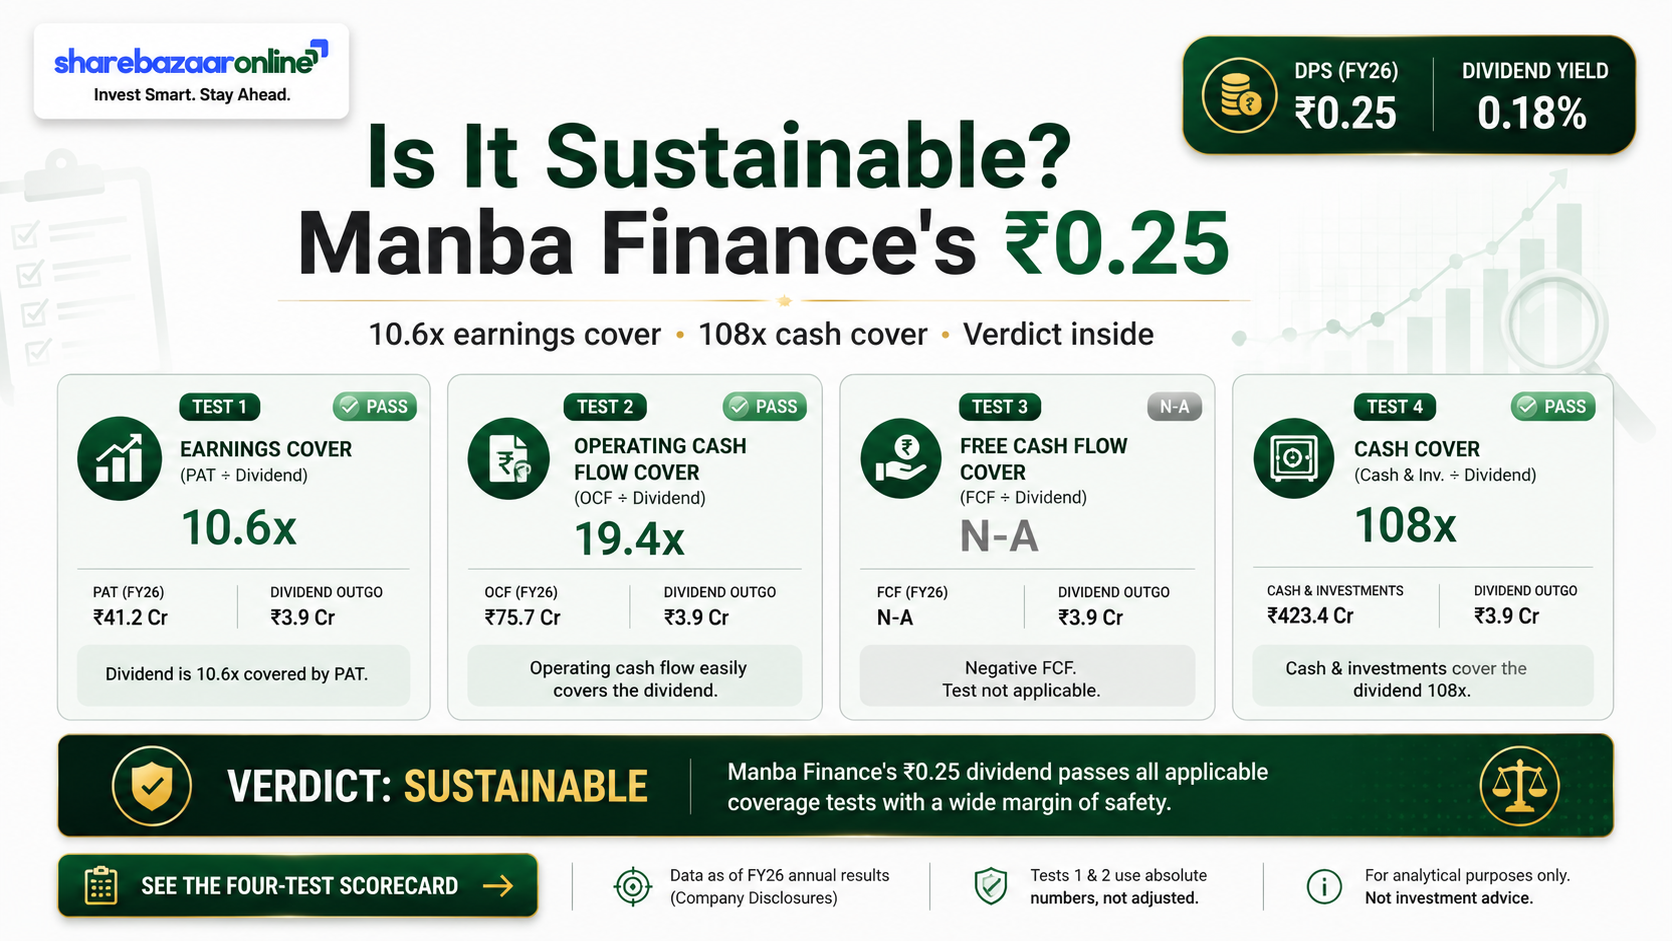
We assess sustainability on four coverage tests. For a lending NBFC, two of them (operating and free cash flow) are structurally not meaningful, so the verdict rests on earnings and liquidity coverage — both of which Manba passes comfortably.
| Coverage Test | Result | Verdict |
|---|---|---|
| Earnings coverage (EPS ÷ DPS, Q1) | 10.6x | Pass |
| Payout ratio (this dividend vs Q1 PAT) | 9.5% | Pass (very low) |
| Operating cash-flow coverage | Not meaningful | N/A for lending NBFC |
| Free cash-flow coverage | Not meaningful | N/A for lending NBFC |
| Cash / liquidity coverage | 108x (cash+bank) | Pass |
Verdict: Sustainable — but that is the easy question
The dividend equals just 0.30% of net worth and under 10% of a single quarter's profit. It is trivially sustainable. The harder, more honest question is whether a growth NBFC that is drawing down its capital cushion and increasing leverage should distribute cash at all rather than retain every rupee to fund loan-book growth — the capital-allocation trade-off, examined next.
Peer Comparison
Manba is a small, base-layer NBFC (NBFC-BL) concentrated in two-wheeler and used-vehicle finance. True like-for-like listed peers of the same size are few; the larger vehicle financiers operate at a completely different scale. Cells are left blank where a verified figure was not available — we do not fill peer tables with estimates.
| Company | Dividend Yield | Payout | 3-yr ROE | Note |
|---|---|---|---|---|
| Manba Finance | ~0.19% | ~5–9% | ~13.3% | 2W / used-vehicle NBFC-BL; CRAR 24.4% |
| Baid Finserv | — | ~6% | ~7.7% | Small NBFC-BL; low payout policy |
| Cholamandalam Inv. & Fin. | — | — | — | Large diversified vehicle financier (different scale) |
| Shriram Finance | — | — | — | India's largest vehicle-finance NBFC (different scale) |
Manba's ~13.3% three-year ROE (per Screener) sits above small-cap NBFC-BL peers such as Baid Finserv but well below the 18%+ benchmark of top-tier NBFCs. Its capital adequacy of 24.4% is a relative strength. Peer yields and payouts should be re-verified live before publication.
Promoter Impact Analysis
Manba is a promoter-dominated company: the promoter group (led by Managing Director Manish Kiritkumar Shah, alongside Manba Investments and Securities Private Limited) held about 74.98% as of the latest shareholding disclosure, with FII holding under 1% and negligible DII participation. That means roughly three-quarters of every rupee distributed flows straight back to the promoter family.
To promoter group (74.98%)
~₹94.2 lakh
Share of the ₹1.26 cr outflow
To public + institutions (~25.02%)
~₹31.4 lakh
Share of the ₹1.26 cr outflow
Because promoters take the lion's share, the token dividend is only mildly cash-positive for minority holders (about ₹31 lakh in aggregate across all public shareholders). On the positive side, promoters have confirmed their shareholding is fully unencumbered — no pledges as of FY26, which is a genuine governance strength for a closely-held NBFC.
Taxation Analysis
How dividends are taxed in India
Since the abolition of Dividend Distribution Tax (April 2020), dividends are taxed in the shareholder's own hands at their applicable income-tax slab rate. The company deducts TDS under Section 194 at 10% only when total dividends paid to a resident shareholder exceed ₹5,000 in a financial year (submit Form 15G/15H to avoid TDS if income is below the taxable limit). The gross dividend is added to “Income from Other Sources” and taxed at slab.
Worked example — investor holding 1,000 Manba shares
| Gross dividend (1,000 × ₹0.25) | ₹250.00 |
| TDS u/s 194 (nil — below ₹5,000 threshold) | ₹0.00 |
| Tax at 30% slab + 4% cess (payable at filing) | ₹78.00 |
| Net dividend in hand | ₹172.00 |
| Effective post-tax yield (on CMP ~₹132.28) | ~0.13% |
A shareholder in a lower slab (e.g. 5% or 20%) keeps proportionately more. The point stands: after tax, the income from this dividend is negligible — roughly ₹172 on a ₹1.3 lakh position for a top-slab investor. Tax rules are illustrative; consult a tax adviser for your specific situation.
Key Risks
- Rising credit costs. Impairment provisioning jumped 82.3% year-on-year — more than double the pace of revenue. If loan-book stress accelerates, this line hits profit first.
- Falling capital cushion with rising leverage. CRAR slipped from 28.21% to 24.40% and debt-to-equity rose from 2.90 to 3.43. Rapid growth is consuming capital; the company may need to raise fresh capital or slow growth to protect buffers.
- Concentration in a cyclical, competitive segment. Two-wheeler and used-vehicle finance is highly competitive (banks, larger NBFCs, fintechs) and sensitive to interest-rate cycles, fuel prices and rural demand. Manba's book is concentrated by both product and geography.
- Funding-cost and liability dependence. As a wholesale-funded NBFC reliant on bank term loans and NCDs (over ₹450 crore of listed NCDs outstanding), any tightening in credit markets or rating action would pressure net interest margins.
- Very high promoter concentration. ~74.98% promoter holding gives strong alignment but limits float, concentrates decision-making, and means minority holders have limited influence over capital-allocation choices such as dividends.
- New-geography execution risk. The move into South India (Karnataka, Tamil Nadu via a partnership) takes Manba beyond its core six-state base — growth optionality, but also unproven underwriting in new markets.
What To Monitor
- Impairment trend vs book growth. Watch whether provisioning growth normalises back below revenue growth, or keeps outpacing it. This is the single most important number for a lender.
- CRAR trajectory. Track whether capital adequacy stabilises above the ~24% level or continues sliding toward the regulatory floor — and whether management signals a capital raise.
- Asset quality (Gross/Net Stage 3). Currently improving (GNPA 3.60%, NNPA 2.69%). Any reversal, especially alongside rising impairment, would be a warning.
- Net interest margin and cost of funds. With debt-to-equity rising, monitor whether spreads hold as the company borrows more via NCDs and bank lines.
- South India / new-product ramp. Track disbursement growth, early-delinquency data and AUM contribution from the new geographies and product lines (used cars, small business, personal loans).
- Dividend policy consistency. Whether the ₹0.25 token continues, rises, or is redirected into growth — a signal of how management weighs distribution against retention.
Conclusion
Manba Finance's First Interim Dividend of ₹0.25 for FY2026-27 is best understood as a governance signal, not an income event. The 2.5% face-value coupon translates to a real yield of roughly 0.19% — about ₹190 a year on a ₹1 lakh holding, and less after tax. It is trivially affordable, covered more than 10 times by quarterly earnings and over 100 times by cash on hand.
The substance sits in the results the dividend accompanied: 38% revenue growth, 36% profit growth, improving asset quality, and a clean underlying earnings mix once a prior-year other-income one-off is stripped out. Set against that are the honest cautions — credit costs up 82%, a capital cushion being drawn down, and leverage climbing — which are the real reasons to watch this NBFC closely rather than the dividend. For a growth-stage lender that is roughly 75% promoter-owned, the more interesting long-term question is not whether the ₹0.25 is sustainable (it obviously is) but whether distributing capital at all is the best use of it. We present the positives, negatives and risks in parallel and leave that judgement to you.
Frequently Asked Questions
What dividend has Manba Finance announced?
What is the Manba Finance dividend yield?
What is the record date for the Manba Finance dividend?
What is the ex-dividend date?
When will the dividend be paid?
Who was eligible for the dividend?
How is this dividend taxed?
Is the Manba Finance dividend sustainable?
What is Manba Finance's dividend history?
What should investors monitor going forward?
How did Manba Finance perform in Q1 FY27?
Is Manba Finance a good dividend stock?
Disclaimer
ShareBazaar Online is not registered with SEBI as an investment adviser or research analyst. This article is for informational and educational purposes only and does not constitute investment advice or any buy, sell or hold recommendation. Figures are drawn from Manba Finance Limited's exchange filings dated 27 July 2026 and publicly available secondary sources; market price, ex-date and certain aggregator figures should be independently re-verified before any decision, as prices and yields change continuously. Dividend taxation is illustrative and general in nature. Securities markets carry risk, including loss of capital. Please consult a SEBI-registered investment adviser and a qualified tax professional before acting on any information here. ShareBazaar Online accepts no liability for decisions taken based on this content.