
Dividend Snapshot
Dividend Announcement Summary
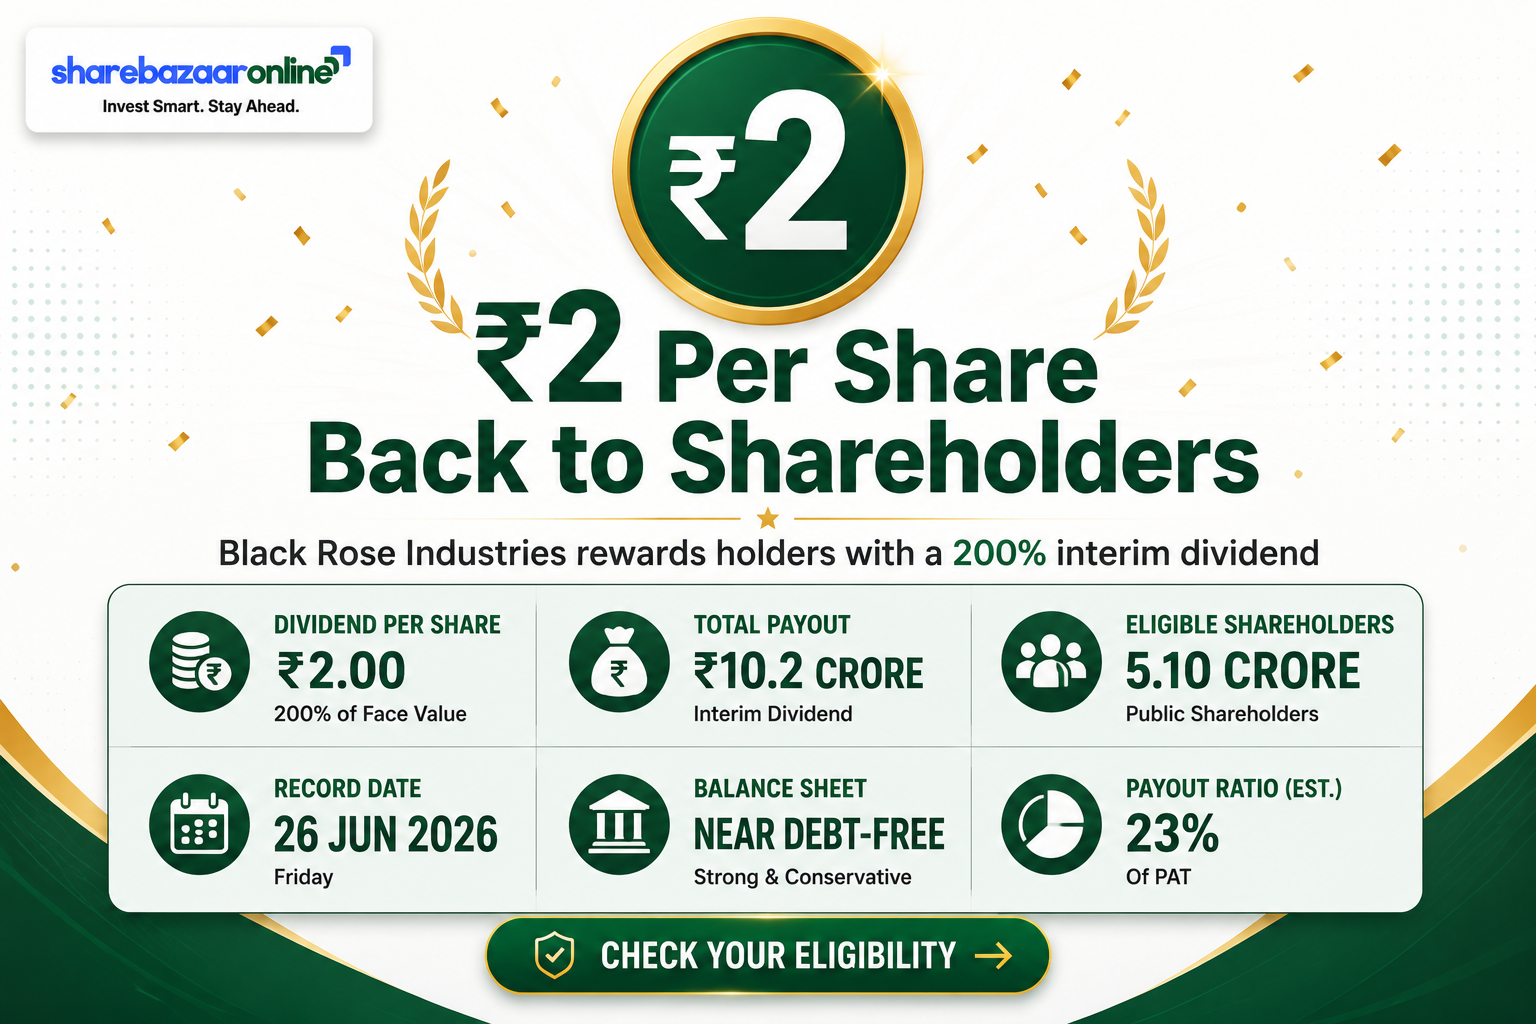
At its Board meeting on 31 July 2026, Black Rose Industries approved its unaudited results for the quarter ended 30 June 2026 (Q1 FY27) and declared an interim dividend of ₹2 per equity share — described as a 200% dividend on the paid-up capital of ₹1 face value shares. The company fixed 6 August 2026 as the record date for eligibility.
The dividend rode on a strong quarter: standalone revenue from operations rose to ₹89.08 crore (up ~48.8% year-on-year) and standalone net profit jumped to ₹10.41 crore (up ~145% year-on-year). The statutory auditors, M M Nissim & Co LLP, issued an unmodified limited-review report. Separately, the Board approved the winding up of the Japanese subsidiary, B.R. Chemicals Co. Ltd — a capital-allocation signal worth noting.
Note: The record date of 6 August 2026 has already passed. This report is an analytical record of the event; no live eligibility banner applies.
Key Dates Timeline
*Under India's T+1 settlement cycle, the ex-date and record date typically coincide; the 6 Aug 2026 ex-date is inferred and should be confirmed against the official NSE/BSE corporate-action circular. **Interim dividends must be paid within 30 days of declaration under the Companies Act, 2013; the exact payment date was not disclosed by the company.
Dividend Yield Analysis
The "200% dividend" illusion. The 200% figure is calculated on the ₹1 face value, not on the market price. In rupee terms the payout is only ₹2 per share. Against the current market price of roughly ₹106, the real dividend yield from this single interim is about 1.89%.
*Illustrative only: combines the FY26 final dividend (₹1.25) and this FY27 interim (₹2.00). The exact trailing yield depends on which record dates fall inside a 12-month window and is Not Independently Verified (NIV). All yields move inversely with price — re-verify at the live CMP.
Dividend History Analysis
| Financial Year | EPS (₹) | Dividend Payout % | Character |
|---|---|---|---|
| FY22 | 6.25 | 12% | Low payout, peak profit |
| FY23 | 1.55 | 35% | Profit slump year |
| FY24 | 4.16 | 16% | Recovery |
| FY25 | 4.11 | 77% | High payout — funded despite negative cash flow |
| FY26 | 4.40 | 28% | Final ₹1.25 recommended |
| FY27 (interim) | 2.04 (Q1) | — | Largest single interim to date (₹2) |
Classification: Consistent but variable payer. Black Rose has paid dividends every year since FY17, but the payout ratio swings widely — from 8–16% in strong-profit years to 77% in FY25. That volatility means the dividend tracks management's cash-and-confidence view rather than a fixed policy. Per-share amounts for individual interim/final tranches across years are NIV and should be reconciled against official exchange filings before republishing.
The step-up to a ₹2 interim at the very start of FY27 — before the year's profits are even booked — is the most aggressive early-year payout in the company's recent history and signals management confidence in FY27 cash flows.
Financial Performance Analysis
Q1 FY27 vs Q1 FY26 (standalone)
FY26 vs FY25 (consolidated)
The non-obvious finding — profit grew while revenue shrank. In FY26, sales fell ~17% yet net profit still rose ~7%. That is margin-led profit: operating margin expanded (roughly 8% to 10%) as the mix shifted toward higher-value manufacturing and the low-margin distribution top-line contracted. In Q1 FY27 the leverage worked the other way — revenue up ~49% but profit up ~145%, meaning profit grew roughly 3x faster than sales (positive operating leverage). Return ratios remain healthy: ROCE ~18.9% and ROE ~14%.
Cash Flow Analysis
Reported profits are opinions; cash is fact — and here the cash story is the headline. In FY25 the company reported a healthy ₹21 crore profit, but its operating cash flow was actually NEGATIVE at about –₹13 crore, and free cash flow was about –₹16 crore. In plain terms: the FY25 dividends were not funded by that year's operations — they leaned on the balance sheet while working capital ballooned.
FY26 reversed this sharply. Operating cash flow swung to +₹45 crore and free cash flow to +₹38 crore, as stretched inventory and receivables unwound. On these FY26 numbers, the ₹10.2 crore FY27 interim outflow is covered 4.4x by operating cash flow and 3.7x by free cash flow — comfortable.
Balance Sheet Strength
Black Rose is effectively debt-free, with borrowings cut to about ₹1 crore (from ~₹11 crore a year earlier). A debt-light balance sheet means the ₹10.2 crore dividend is not being funded by fresh borrowing — a key affordability positive. Exact period-end cash is Not Independently Verified here; the confirmed ₹20 crore investment book alone covers the payout ~2x.
Dividend Sustainability Analysis
| Coverage Test | Metric | Verdict |
|---|---|---|
| Earnings (FY26 EPS) | 2.2x | Pass |
| Earnings (Q1 FY27 EPS only) | 1.02x | Amber — thin on one quarter |
| Operating Cash Flow (FY26) | 4.4x | Pass |
| Free Cash Flow (FY26) | 3.7x | Pass |
| Liquidity / Debt | Near debt-free | Pass |
Overall verdict: Sustainable, with one nuance. On full-year earnings, FY26 cash flow, and a debt-free balance sheet, the ₹2 interim is comfortably affordable. The single caution: the ₹2 interim almost equals the entire ₹2.04 Q1 EPS (a ~98% single-quarter payout), so continued heavy payouts depend on the strong Q1 momentum holding through FY27. If the FY25-style negative cash-flow pattern were to recur, the margin of safety would narrow quickly.
Peer Comparison
| Company | Div Yield | ROCE | ROE | Debt/Equity |
|---|---|---|---|---|
| Black Rose Industries | ~1.9% | 18.9% | 14.0% | ~0.01 |
| Specialty Chem peer set | NIV | NIV | NIV | NIV |
| Industry avg (trade distributors) | ~0.2%* | NIV | NIV | NIV |
Peer-specific cells are deliberately left as NIV rather than populated with unconfirmed figures. What the confirmed data does show: Black Rose's dividend yield of ~1.9% sits well above the very low yields typical of its trade-distribution industry (industry average around 0.2%*), while its near-zero leverage and ~19% ROCE are respectable for a small-cap specialty-chemicals name. *Industry-average yield per a third-party screen and marked as a directional benchmark only.
Promoter Impact Analysis
With promoters (the Jatia family group) holding 75%, roughly ₹7.65 crore of the ₹10.2 crore outflow flows to the promoter group, versus about ₹2.55 crore to all public and institutional shareholders combined. High promoter ownership means dividends are a primary route for promoters to draw cash from a debt-free, cash-generating company — alignment that can be a positive, but also a reason payout decisions closely mirror promoter preferences. FII holding is currently nil.
Taxation Analysis
Since April 2020, dividends in India are taxed in the hands of the investor at their applicable income-tax slab rate (dividend distribution tax was abolished). The company deducts TDS at 10% only if total dividend paid to a resident shareholder exceeds ₹5,000 in a financial year (10% applies where PAN is available; 20% without PAN).
Worked Example — 1,000 shares, ₹2/share, 30% slab
Illustrative only; assumes a 30% marginal slab and does not include cess/surcharge. Consult a tax professional for your situation.
Key Risks
1. Revenue contraction. Consolidated sales fell ~17% in FY26 and the 5-year sales CAGR is negative (~–3%). Profit is currently margin-driven, not volume-driven.
2. Working-capital swings. The cash-conversion cycle widened to ~112 days; a fresh build-up could turn operating cash flow negative again, as it did in FY25.
3. Commodity & input cyclicality. Acrylamide/specialty-chemical demand and raw-material prices are cyclical and can compress margins quickly.
4. Concentration & scale. This is a small-cap (~₹540 crore market cap) with high 75% promoter ownership and low institutional float, which can mean thin liquidity and price volatility.
5. Regulatory / operational. The plant faced a temporary GPCB closure order in FY26 (since revoked); environmental compliance remains an operational risk. The winding-up of the Japanese subsidiary adds execution/transition uncertainty.
What To Monitor
1. Operating cash flow trend — does FY27 sustain positive OCF, or does working capital reabsorb it?
2. Margin durability — whether the Q1 FY27 OPM (~16%) holds as the mix and volumes normalise.
3. Manufacturing ramp-up — progress on the PAM solid project, new acrylamide downstream products, and the specialty amines JV with Koei.
4. Dividend cadence — whether the ₹2 interim is followed by further interims/a final, and how full-year payout settles.
5. Capital allocation — use of the cash freed by the Japanese subsidiary wind-up (reinvestment vs further distribution) and any capex announcements.
Conclusion
Positives: Effectively debt-free; a ₹10.2 crore payout covered 3–4x by FY26 cash flows; strong Q1 FY27 momentum (revenue +49%, profit +145%); healthy ~19% ROCE; and a real yield (~1.9%) above its industry norm.
Negatives / cautions: The "200%" headline overstates the ₹2 real payout; FY25 showed that reported profit did not translate to cash; sales have been shrinking; and the ₹2 interim consumes almost the whole Q1 EPS, so future payouts hinge on momentum continuing.
In short, this is a cash-backed interim from a debt-free small-cap whose profit engine has shifted from top-line growth to margin and mix. The information above is presented so readers can weigh it themselves — this article offers no buy, sell, or hold recommendation.
Frequently Asked Questions
What dividend has Black Rose Industries announced?
What is the Black Rose Industries dividend yield?
What is the record date for the Black Rose Industries dividend?
What is the ex-dividend date?
When will the dividend be paid?
Who is eligible for the dividend?
How is this dividend taxed?
Is the Black Rose Industries dividend sustainable?
Why did profit rise when revenue fell in FY26?
What is Black Rose Industries' dividend history?
How much of the dividend goes to promoters?
What should investors monitor going forward?
What does Black Rose Industries do?
Disclaimer
This article is for informational and educational purposes only and does not constitute investment, financial, or tax advice, nor a recommendation to buy, sell, or hold any security. ShareBazaar Online is not a SEBI-registered advisor. Figures are compiled from company filings and third-party sources; some values are inferred or Not Independently Verified (NIV) and should be re-checked against primary exchange disclosures. Dividend yields are price-dependent and change with the market. Please verify the live current market price and consult a qualified financial and tax professional before making any investment decision. Investments in securities are subject to market risks.