
Dividend Snapshot
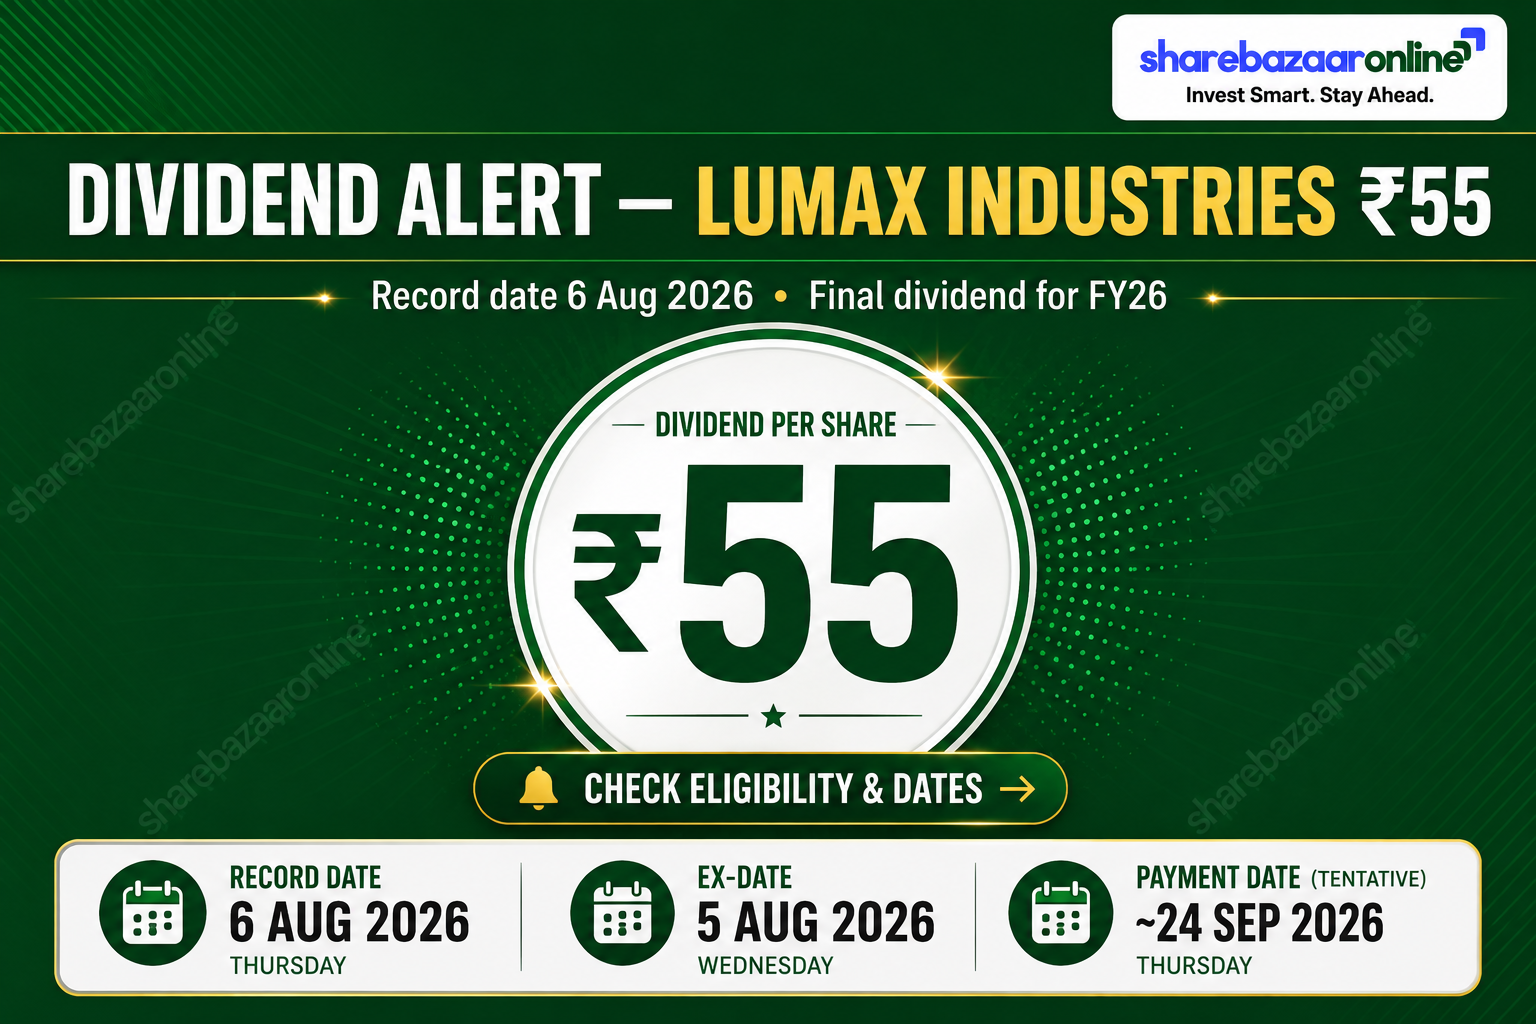
Dividend Per Share
₹55.00
Final dividend — 550% of ₹10 face value
Dividend Yield (at CMP ~₹5,936)
~0.93%
Yield on announcement-window price ~0.92%
Record Date
06 Aug 2026
Ex-date: 06 Aug 2026 (T+1)
Total Dividend Outflow
₹51.41 cr
55 × 93,47,700 shares
Company: Lumax Industries Limited
NSE / BSE: LUMAXIND / 517206
ISIN: INE162B01018
Dividend Type: Final Dividend
Financial Year: FY 2025-26
Announcement Date: 28 May 2026
Payout Ratio (consolidated): 29.8%
Dividend Coverage (consol EPS/DPS): 3.35x
Payer Classification: Consistent / Progressive
Sustainability Verdict: Moderately Sustainable
Approval status: subject to shareholder approval at the 45th AGM. CMP and yields are price-dependent — re-verify the live price before acting.
Dividend Announcement Summary
At its board meeting held on Thursday, 28 May 2026 (commenced 03:45 PM, concluded 04:45 PM), the Board of Directors of Lumax Industries approved the audited results for Q4 and the full year ended 31 March 2026 and recommended a final dividend of ₹55 per equity share (550%) on the ₹10 face value for FY 2025-26.
This is a meaningful step-up from the ₹35 per share paid for FY 2024-25 — a ~57% increase in the rupee dividend. Per the company’s filing, the dividend, if approved by shareholders, will be paid within 30 days of approval/declaration at the AGM.
Note on the AGM: The filing dated 28 May 2026 fixed the AGM for 24 August 2026. Per subsequent exchange disclosures, the 45th AGM was later revised to Wednesday, 26 August 2026 (via video conferencing). The record date remains 06 August 2026. Confirm the final AGM date and payment date against the latest NSE/BSE circular before publication.
Also approved at the same board meeting (context, not dividend-related): change in designation of Mr. Deepak Jain to Chairman (Whole-Time Director) and Mr. Anmol Jain to Managing Director; re-appointment of Mr. Tadayoshi Aoki as Senior Executive Director; and re-appointment of internal and cost auditors. The results carried an unmodified (clean) audit opinion from S.R. Batliboi & Co. LLP.
Key Dates Timeline
Announcement Date
28 May 2026
Record Date
06 Aug 2026
Ex-Dividend Date
06 Aug 2026 (T+1, inferred)
AGM Date
26 Aug 2026 (revised)
Cut-off Date (AGM voting)
18 Aug 2026
Payment Date
By ~24 Sep 2026 (within 30 days of AGM approval)
Ex-date and payment date are inferred (T+1 settlement and the statutory 30-day outer limit respectively) and are flagged for human verification against the official corporate-action circular. Because the record date of 06 August 2026 has already passed, eligibility is now fixed to holders on record as of that date.
Dividend Yield Analysis
The 550% headline vs the real yield. A “550% dividend” simply means 550% of the ₹10 face value = ₹55 per share. Face value has nothing to do with what you paid for the share. Divide ₹55 by the market price to get the true yield:
Yield on Face Value
550%
₹55 / ₹10 — cosmetic
Yield at CMP (~₹5,936)
~0.93%
₹55 / ₹5,936 — the real number
Yield at Announcement (~₹5,979)
~0.92%
Inferred from 27-May close
Yield Reality Check — why the yield looks “low”
The dividend actually rose from ₹35 to ₹55 (+57%). Yet the yield stays under 1% for one dominant reason: the share price has roughly doubled over the past year (LUMAXIND is up ~126% over 12 months, with a 52-week range of about ₹3,266–₹6,970). A rising denominator, not a weak dividend, compresses the yield. In other words, this is a “low yield because the stock re-rated,” not a “low yield because the payout is stingy.” Lumax Industries has historically been a growth-plus-modest-income stock, not a high-yield play.
Dividend History Analysis
| Financial Year | EPS (₹, consol) | Dividend Payout % | Dividend Per Share (₹) |
|---|---|---|---|
| FY26 | 184.51 | 30% | 55.00 |
| FY25 | 149.67 | 23% | 35.00 |
| FY24 | 118.77 | 29% | 35.00 |
| FY23 | 110.27 | 24% | ~26–27 † |
| FY22 | 43.56 | 31% | ~13–14 † |
| FY21 | 19.42 | 36% | 7.00 |
| FY20 | 76.92 | 31% | ~24 † |
| FY19 | 111.03 | 32% | ~35 † |
| FY18 | 76.34 | 30% | ~23 † |
| FY17 | 58.16 | 25% | ~14–15 † |
| FY16 | 55.66 | 22% | ~12 † |
EPS and Dividend Payout % sourced from Screener.in (consolidated). † Dividend-per-share figures marked with a dagger are derived from payout × EPS and are Not Independently Verified (NIV) against company records — treat as approximate. FY21 (₹7), FY24 (₹35), FY25 (₹35) and FY26 (₹55) are confirmed.
What the record shows
- Consistency: Lumax Industries has paid a dividend every year for well over a decade — no suspensions in the visible history.
- Cyclicality: The payout tracks earnings. In the COVID-hit FY21, EPS collapsed to ₹19.42 and the dividend was trimmed to ₹7 — even as the payout ratio rose to 36%, showing the board’s willingness to protect the dividend proportionally in a weak year.
- Growth trend: From the FY21 trough of ₹7, the dividend has climbed ₹7 → ~₹13 → ~₹26 → ₹35 → ₹35 → ₹55, broadly in step with a strong earnings recovery.
- Payout discipline: The payout ratio has sat in a steady 22%–36% band, indicating a policy that returns roughly a quarter to a third of profit while retaining the rest for capex.
Classification: Consistent / Progressive Payer with cyclical sizing — the dividend is reliably paid but its size flexes with the earnings cycle.
Financial Performance Analysis (FY26, Consolidated)
Revenue from Operations
₹4,184 cr
+23.0% YoY (vs ₹3,400 cr)
EBITDA (Operating Profit)
~₹406 cr
+45% YoY; margin ~8.2% → ~9.7%
Consolidated PAT
₹172.47 cr
+23.2% YoY; EPS ₹184.50
Standalone PAT
₹146.50 cr
+60.1% YoY; EPS ₹156.72
Operating Leverage — margins finally expanding
Revenue grew 23% while EBITDA grew ~45% — positive operating leverage, with the operating margin widening from ~8.2% to ~9.7%. After years of thin, single-digit margins typical of an auto-lighting supplier, FY26 shows better fixed-cost absorption as new plants (Chakan, Sanand) ramp up. Reported PBT was dented by a one-time exceptional charge of ₹17.85 cr (a provision linked to the new Labour Codes), so the underlying operating improvement is slightly better than the headline PAT suggests.
The non-obvious finding: a third of profit is not from operations
Consolidated PAT of ₹172.47 cr includes ₹54.02 cr as Lumax’s share of profit from its associate, SL Lumax Limited — that is roughly 31% of consolidated profit. This is a genuine, high-quality earnings stream, but investors should recognise that Lumax’s own manufacturing operations generate the other ~69%. There is also an accounting subtlety: standalone “other income” includes ₹23.56 cr of dividends received from that associate, which flatters standalone profit (and helps fund the standalone dividend). In the consolidated accounts that intra-group dividend is eliminated and replaced by the equity-method share of the associate’s actual earnings.
Cash Flow Analysis
Operating Cash Flow (FY26)
₹372.56 cr
OCF / PAT = 2.16x — strong cash conversion
Capital Expenditure (FY26)
₹289.43 cr
Heavy plant & capacity investment
Free Cash Flow (OCF − Capex)
₹83.13 cr
Turned positive after two negative years
FY26 Dividend Outflow (the ₹55)
₹51.41 cr
FCF coverage = 1.62x
Reported profit is an opinion; cash is a fact
The good news: operating cash flow of ₹372.56 cr comfortably exceeded PAT (2.16x), driven by heavy depreciation (~₹152 cr) and disciplined working capital — Screener pegs FY26 cash-flow-to-operating-profit at ~103%. That is high-quality, cash-backed profit.
The caveat: Lumax is in a heavy capex cycle. Free cash flow was negative in FY24 (−₹124 cr) and FY25 (−₹110 cr) as it built out new plants, and only turned positive (+₹83 cr) in FY26. So while this year’s FCF covers the ₹51.41 cr dividend 1.6 times, the dividends paid during the expansion years were effectively funded by a mix of operating cash and rising borrowings, not surplus free cash. This is the single most important nuance in the whole story.
How is the dividend funded?
- Current earnings: Yes — EPS of ₹184.50 covers the ₹55 dividend 3.35x.
- Free cash flow: Yes, but only recently — FY26 FCF of ₹83 cr covers it 1.6x, after two years of negative FCF.
- Liquid cash reserves: Thinly — on-balance-sheet cash & liquid investments of only ~₹26.5 cr cover the dividend just 0.52x.
- Borrowings: Indirectly — total borrowings rose to ~₹807 cr (ex-lease), so the dividend co-exists with a leveraged, expanding balance sheet.
Balance Sheet Strength
Total Equity (Consolidated)
₹917.50 cr
Book value ~₹982/share
Gross Borrowings (ex-lease)
₹806.82 cr
Incl. leases: ~₹973 cr
Cash & Liquid Investments
₹26.49 cr
Cash & equiv + bank + current inv.
Net Debt (ex-lease)
~₹780 cr
Net D/E ≈ 0.85x
Lumax runs a moderately leveraged balance sheet by design. Debt-to-equity on borrowings (ex-lease) is ~0.88x, and total borrowings have climbed steadily from ~₹431 cr (FY23) to ~₹807 cr (FY26) to fund the multi-plant expansion. A key data point that keeps this manageable: Return on Equity of ~22% and ROCE of ~17.7% in FY26 — the company is earning well above its cost of capital, which is what makes leveraged growth and a growing dividend defensible. The balance sheet also carries a ₹267 cr equity-accounted investment in associate SL Lumax, a genuine value store that does not show up in reported operating cash. Credit context: ICRA revised Lumax Industries’ long-term rating during 2026 (into the A+/AA “Stable” band) — the exact notch should be confirmed against the latest rationale before publication (NIV).
Dividend Sustainability Analysis
| Coverage Test | Metric | Result | Rating |
|---|---|---|---|
| Earnings coverage | EPS ₹184.50 / DPS ₹55 | 3.35x | Pass |
| Operating cash flow | OCF ₹372.56 cr / outflow ₹51.41 cr | 7.2x | Pass |
| Free cash flow | FCF ₹83.13 cr / outflow ₹51.41 cr | 1.62x | Amber |
| Cash / liquidity | Liquid ₹26.49 cr / outflow ₹51.41 cr | 0.52x | Fail |
Overall verdict: Moderately Sustainable
Earnings and operating cash flow cover the ₹55 dividend with a wide margin, and the payout ratio (~30%) leaves ample room. The dividend is affordable out of profit. The two amber/red flags are structural, not alarming: free cash flow only just turned positive as the capex cycle peaks, and the company holds very little idle cash (by choice — surplus is deployed into plants and working capital). As long as earnings keep compounding and capex normalises, the dividend looks safe. The risk case is a demand downturn colliding with a still-elevated capex commitment and ~₹807 cr of borrowings.
Peer Comparison
| Company | Div. Yield | Payout % | ROE | ROCE |
|---|---|---|---|---|
| Lumax Industries | ~0.93% | ~30% | ~22% | ~17.7% |
| Lumax Auto Technologies | ~0.4–0.5% | ~21% (SWS) | ||
| Uno Minda | ~16% (FY25) | |||
| Auto Components industry avg. | ~0.6% |
Blank cells are intentionally left empty rather than filled with unconfirmed figures. Peer yield/payout are indicative, sourced from public aggregators as of Aug 2026 and should be refreshed at publication. Note Lumax Auto Technologies has a ₹2 face value (its ₹5.50 = 275%), so face-value percentages are not comparable across the group — only rupee yield is.
Read across the auto-ancillary space, Lumax Industries offers a slightly higher yield and a higher payout ratio than its sister firm Lumax Auto Technologies and than growth-focused peers like Uno Minda, which retain more earnings for expansion. None of these are “dividend stocks” in the classic sense — the sector average yield is only ~0.6%. Investors buy this cluster for earnings growth; the dividend is a modest bonus. On returns, Lumax Industries’ ROE of ~22% is competitive within the group.
Promoter Impact Analysis
Promoter Holding
75.00%
37.5% Stanley Electric (Japan) + 37.5% D.K. Jain family
Promoter Dividend Income
₹38.56 cr
75% of the ₹51.41 cr outflow
With promoters owning three-quarters of the company, the lion’s share of every dividend rupee flows to them. Of the ₹51.41 cr total, an estimated ₹38.56 cr goes to promoters — split roughly ₹19.28 cr to Stanley Electric Co. Ltd., Japan (the 37.5% JV/technology partner) and ₹19.28 cr to the D.K. Jain family (Anmol Jain alone disclosed a 37.5% / 35,05,399-share holding). Public and institutional minority shareholders (the other 25%) collectively receive about ₹12.85 cr.
Alignment read: A high promoter stake means promoter and minority interests are aligned on dividends — the family and Stanley Electric want the payout too. The flip side is that with 75% held, the dividend is also a legitimate cash-repatriation channel for the promoters, and minority holders have limited sway over payout policy.
Taxation Analysis
Since April 2020, dividends in India are taxable in the hands of the shareholder at their applicable income-tax slab rate (there is no separate Dividend Distribution Tax anymore). The company also deducts TDS under Section 194 at 10% if a resident’s total dividend from the company in a financial year exceeds ₹10,000 (this threshold was raised from ₹5,000 with effect from FY 2025-26). TDS is 20% (plus surcharge/cess) for many non-residents, subject to treaty relief. The TDS is only an advance — it is adjusted against your final tax liability.
Worked Example — investor holding 1,000 shares, 30% slab
| Shares held | 1,000 |
| Dividend per share | ₹55 |
| Gross dividend | ₹55,000 |
| TDS @ 10% (deducted at source, > ₹10,000) | ₹5,500 |
| Total tax @ 30% + 4% cess | ₹17,160 |
| Net dividend in hand (after full tax) | ₹37,840 |
| Effective post-tax yield (at CMP ~₹5,936) | ~0.64% |
Illustrative only. A lower-slab investor pays less; the ₹5,500 TDS is credited against the final ₹17,160 liability, leaving ₹11,660 payable on filing. Surcharge may apply at higher incomes. Not tax advice — consult a qualified professional.
Key Risks
- Auto-cycle dependence & customer concentration: As an OEM lighting supplier, revenue is tied to India’s passenger-vehicle production cycle and to a concentrated OEM customer base. A slowdown at key customers directly hits volumes and, in turn, dividend capacity.
- Elevated leverage during expansion: Borrowings have risen to ~₹807 cr (ex-lease); interest cost was ~₹74 cr in FY26. Paying a larger dividend while debt is high leaves less buffer if earnings wobble.
- Thin liquidity cushion: Only ~₹26.5 cr of liquid cash on the balance sheet (0.52x the dividend). The dividend depends on cash generation continuing, not on a cash pile.
- Associate-earnings reliance: ~31% of consolidated profit comes from associate SL Lumax; any downturn there disproportionately dents consolidated earnings and the dividend narrative.
- Margin pressure from input costs & technology shift: Raw-material inflation, forex on imported components, and the fast transition to LED/premium lighting require continuous R&D and capex — a mis-step could compress the ~10% operating margin.
- Approval & timing risk: The dividend is still subject to shareholder approval at the (revised) 26 August 2026 AGM; the exact payment date is inferred, not confirmed.
What To Monitor
- Free cash flow trajectory: Does FCF stay positive as capex normalises? FY26’s +₹83 cr must become a trend, not a one-off, for the higher dividend to be durable.
- Capex intensity & debt path: Watch whether borrowings peak and begin to decline, and whether new plants (Chakan, Sanand) hit their utilisation and margin targets.
- Operating margin & LED mix: Track the operating margin around ~10% and the shift toward higher-value LED/premium lighting content per vehicle.
- Associate (SL Lumax) performance: Since it drives ~31% of consolidated profit, its quarterly contribution and dividend up-streaming are critical.
- Payout-ratio policy: Whether management holds the ~22%–36% payout band or lifts it as FCF improves — a signal of confidence.
- Order book & OEM wins: New-model wins and order-book growth are the leading indicators of future revenue, earnings and dividend capacity.
Conclusion
Lumax Industries’ ₹55 (550%) final dividend for FY26 is a real, well-earned increase — up 57% on last year — backed by 23% revenue growth, margin expansion and strong operating cash conversion (OCF/PAT of 2.16x). On earnings, it is comfortably covered 3.35 times.
The honest picture, though, is more textured than the “550%” headline. The real yield is under 1% because the stock has re-rated sharply; free cash flow only just turned positive after two negative years; the balance sheet carries ~₹807 cr of borrowings; and roughly a third of profit comes from an associate. This is a growth-first auto-ancillary compounder that pays a modest, consistent dividend — not an income stock. We classify it as a Consistent / Progressive payer with a Moderately Sustainable dividend. The Positives, Negatives, Risks and Monitoring Factors are laid out above so you can weigh them yourself.
Frequently Asked Questions
What dividend has Lumax Industries announced for FY26?
What is the Lumax Industries dividend yield?
What is the record date for the Lumax Industries dividend?
What is the ex-dividend date?
When will the Lumax Industries dividend be paid?
Who is eligible for the dividend?
How is the Lumax Industries dividend taxed?
Is the Lumax Industries dividend sustainable?
What is Lumax Industries’ dividend history?
What should investors monitor going forward?
Why is the dividend yield below 1% if the dividend increased?
How much of the dividend goes to promoters?
Should I buy Lumax Industries for the dividend?
Disclaimer
This article is published by ShareBazaar Online for informational and educational purposes only and does not constitute investment, financial, legal or tax advice, nor a recommendation to buy, sell or hold any security. ShareBazaar Online is not a SEBI-registered investment adviser or research analyst. Figures are drawn from the company’s exchange filing dated 28 May 2026 and audited FY26 results, supplemented by publicly available data (Screener.in and others); market prices, yields and certain per-share history are indicative, time-sensitive and may contain items marked “inferred” or “Not Independently Verified (NIV).” All ratios are computed by ShareBazaar Online and should be independently verified. Dividends are subject to shareholder approval and to change. Investments in securities are subject to market risks; please read all related documents carefully and consult a SEBI-registered adviser before investing. ShareBazaar Online accepts no liability for any loss arising from the use of this information.