
Dividend Snapshot
Investment & Precision Castings Ltd (IPCL) has declared a final dividend of ₹1.00 per equity share for FY2025–26 — a 10% payout on the ₹10 face value. On the current market price of about ₹1,219, that headline “10%” converts to a real cash yield of only 0.08%. This snapshot captures the essentials of the Investment & Precision Castings dividend 2026 before we go deeper than the wire services.
CMP is price-dependent and moves daily; verify the live price before relying on any yield figure. Dividend, dates and financials sourced from the company’s BSE filing dated 19 May 2026 and exchange corporate-action disclosures.
Dividend Announcement Summary
At its board meeting held on 19 May 2026, the Board of Directors of Investment & Precision Castings Ltd recommended a final dividend of ₹1 per equity share (10%) for the year ended 31 March 2026, subject to shareholder approval. That approval was obtained at the company’s 51st Annual General Meeting held on 13 August 2026, at which the dividend was declared.
The recommendation came alongside a strong set of full-year results: standalone net profit of ₹11.77 crore (up ~94% from ₹6.07 crore) and consolidated net profit of about ₹12.93 crore, on total income that rose ~14% to roughly ₹189–196 crore. The statutory auditor issued a clean opinion with no material misstatement.
The finding aggregators miss: IPCL issued a 1:1 bonus during FY26 (record date 27 June 2025), doubling its share count from about 50 lakh to roughly 1 crore shares. So this ₹1 dividend is paid on twice as many shares as the year before. A shareholder who held before the bonus now owns two shares for every one, and collects ₹2 for each original share — four times the ₹0.50 they received a year earlier. The plain per-share number hides that.
Key Dates Timeline
Because the ex-date and record date of 6 August 2026 have now passed, eligibility is settled: only investors who held the shares in their demat account as on the record date were entitled to this dividend. The payment date shown aligns with the statutory limit — a company must pay a declared dividend within 30 days of declaration — measured from the AGM date. Confirm the exact credit date against the company’s registrar records.
Dividend Yield Analysis
This is where the “10% dividend” headline needs a reality check. That 10% is a coupon on the ₹10 face value, not a yield on what you pay in the market. The real dividend yield is the cash divided by the market price:
Yield reality check: the real yield fell by roughly half between the announcement and today — from 0.167% to 0.082%. The dividend did not shrink; it is fixed at ₹1. The yield collapsed because the share price roughly doubled in about three months. This is the opposite of the classic value trap, where yield looks high because the price is falling. Here, IPCL is a very low-yield stock whose income return has been crushed by a sharp price rally. Anyone buying for income is buying almost none.
Dividend History Analysis
IPCL has a long record of paying small dividends — it has declared dividends many times since 2002 — but the payout has always been modest and has wobbled during weak years. The table shows the dividend per share as declared on the ₹10 face value.
| Financial Year | Dividend / Share (as declared) | % on Face Value |
|---|---|---|
| FY2025–26 | ₹1.00 | 10% |
| FY2024–25 | ₹0.50 | 5% |
| FY2023–24 | ₹1.00 | 10% |
| FY2022–23 | ₹1.00 | 10% |
| FY2019–20 to FY2021–22 | Nil / minimal (loss & recovery years) | — |
| FY2018–19 | ~₹1.00 | 10% |
| FY2011–12 | ₹1.00 | 10% |
| FY2010–11 | ₹1.25 | 12.5% |
Per-share figures are as declared on the ₹10 face value. A 1:1 bonus in June 2025 doubled the share count, so pre-bonus and post-bonus per-share figures are not directly comparable — a pre-bonus holder now owns two shares for every one. Nil/minimal marker for FY20–FY22 reflects the loss in FY20 and the thin-profit recovery that followed. Figures compiled from exchange filings and dividend-history aggregators; verify each line against the registrar before publishing.
Classification — Consistent but modest payer. IPCL keeps the habit of paying a token dividend most years, but the absolute cash is tiny (5%–12.5% of face value) and it was cut or suspended around the FY20 loss. It is a symbolic-payout company, not an income stock.
Financial Performance Analysis
FY26 was IPCL’s strongest year in a while, and the profit surge is what has excited the market. But it is worth separating genuine operating improvement from the low base it is measured against.
Operating-leverage read: revenue grew ~14% but profit nearly doubled. That is real operating leverage — margins widened as higher volumes and a richer aerospace/defence mix spread over a fixed cost base, and the margin climb continued into Q1 FY27 (OPM 20.7%). But temper the headline: the ~102% five-year profit CAGR is flattered by a very low base — the company posted a loss in FY20 and near-zero profit in FY21–FY22, so growth off that trough looks spectacular. Return on equity is still only about 12.5%, and the three-year average is roughly 9.7% — modest returns for the valuation the market is now paying.
*Five-year profit CAGR per Screener; distorted by the FY20 loss base. Consolidated figures unless stated.
Cash Flow Analysis
Reported profit is an opinion; cash is a fact. For a dividend, what matters is whether the cash is genuinely there. IPCL’s FY26 cash generation was healthy, but almost all of it went straight back into the ground as capex.
Is the dividend cash-funded? Yes. Operating cash flow of about ₹26 crore is more than 26 times the roughly ₹1 crore paid out, so the dividend is comfortably covered by current cash from operations — it is not funded from borrowings or asset sales. The catch is free cash flow of only about ₹2 crore: the company ploughed roughly ₹24 crore into fixed assets in FY26 (including a newly commissioned 4 MWp solar plant), so little cash is left over after growth spending. FY24 was a warning of how thin this can get — OCF fell to about ₹6 crore that year, translating to negative free cash flow.
The ₹1 crore dividend is trivially affordable out of operating cash. The real cash story is not the dividend — it is that IPCL is in an investment phase, converting almost all its cash into capacity rather than distributions.
Balance Sheet Strength
Read carefully: IPCL is not a cash-rich company paying out of a war chest. It carries roughly ₹72 crore of borrowings against a ₹103 crore net worth (D/E ~0.70x) and holds negligible surplus investments. The dividend is affordable only because it is tiny relative to operating cash flow — not because the balance sheet is flush. Debt has actually risen year-on-year to fund the capex cycle, which is the item to watch, not the payout.
Dividend Sustainability Analysis
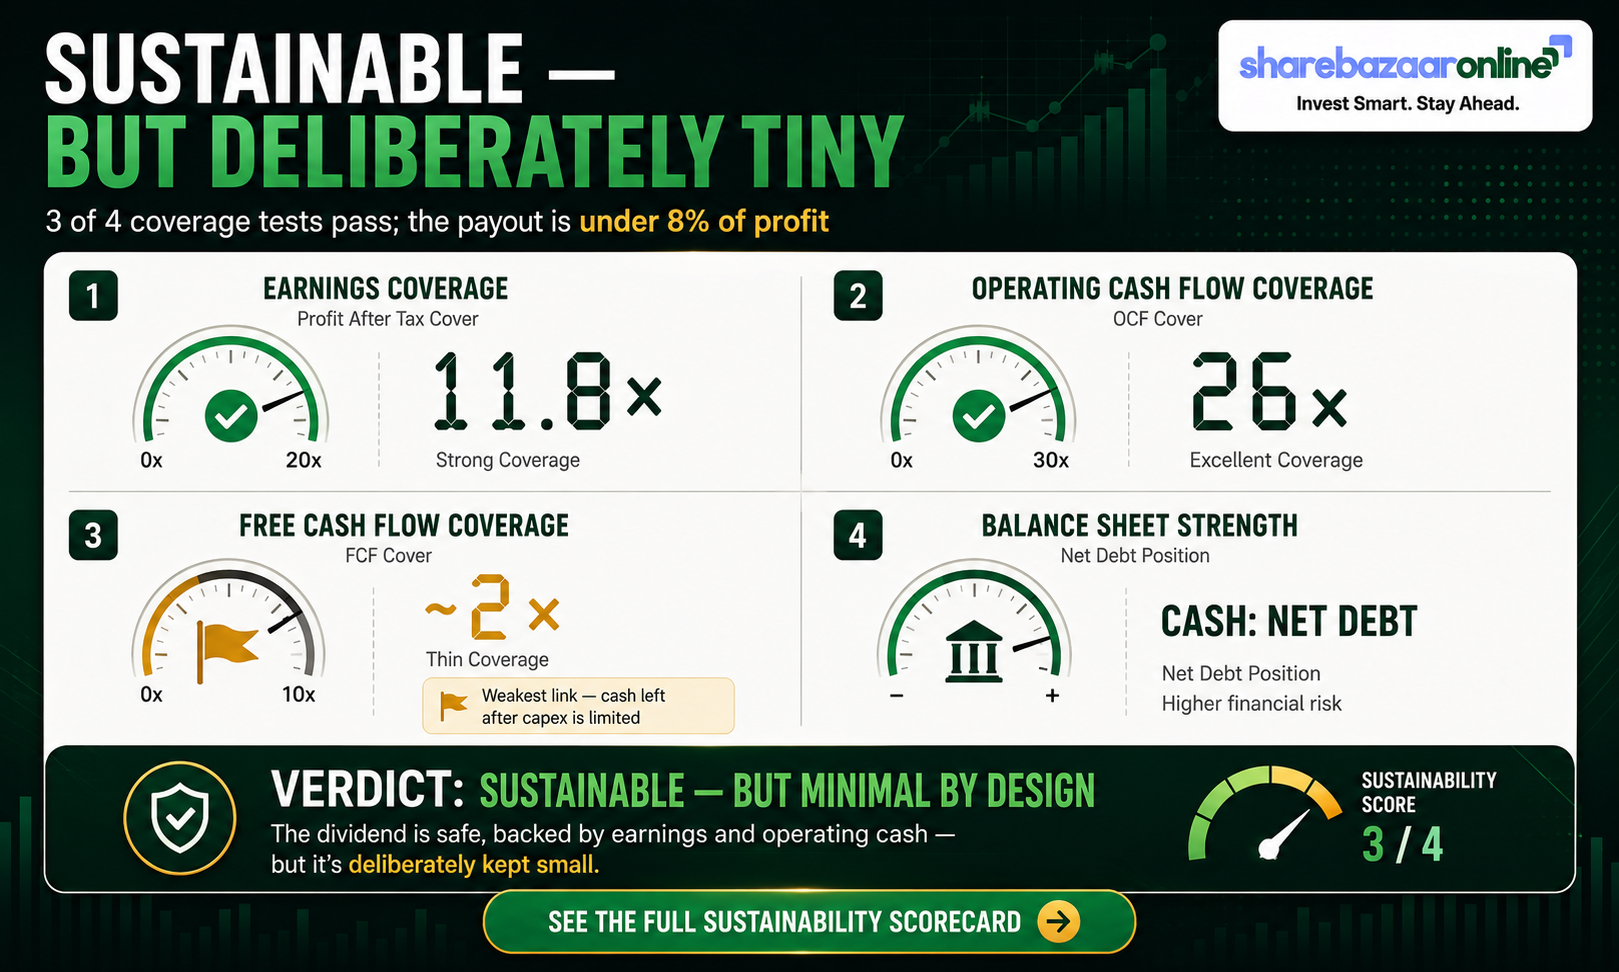
We run the dividend through four independent coverage tests. The bar is easy to clear here precisely because the payout is so small.
Verdict — Sustainable (3 of 4 tests pass). Earnings, payout ratio and operating cash flow all cover the ₹1 dividend many times over. Free cash flow is thin (about 2x) only because of the capex cycle, and the cash/liquidity test is the weak spot since the company runs net debt. But the payout is so small — under 8% of profit — that it is easily sustainable and could even be raised without strain. The honest caveat is that sustainability here reflects a deliberately minimal dividend, not balance-sheet richness.
Peer Comparison
Against other listed castings and forgings names, IPCL stands out for its extreme valuation and near-zero yield, not for its distribution. Blank cells are left deliberately empty where a figure could not be independently verified — we do not fill gaps with guesses.
| Company | Div. Yield | Payout | ROE | P/E |
|---|---|---|---|---|
| Investment & Precision Castings | ~0.08% | ~7.7% | ~12.5% | ~82–94x |
| Ramkrishna Forgings | ~0.2–0.35% | ~8.7% | ~13.7% | ~48–140x* |
| Precision Camshafts | ~0.53% | ~15.5% | ||
| MM Forgings | ~20x |
*Ramkrishna Forgings P/E has been quoted anywhere from ~48x (post strong-quarter EPS) to ~140x on trailing depressed earnings across sources. Peer cells are indicative and must be re-verified at desk before publishing. Auto-components industry average P/E is roughly 34x and peer average dividend yield roughly 0.6% — IPCL trades well above the first and well below the second.
Takeaway: IPCL’s dividend yield is at the bottom of its peer set while its valuation multiple is at the top. Investors are clearly paying for growth and the aerospace/defence story, not for income.
Promoter Impact Analysis
Of the roughly ₹1 crore total payout, the promoter group (led by chairman and managing director Piyush I. Tamboli) receives about ₹0.52 crore and public shareholders share the remaining ₹0.48 crore. Institutional ownership is virtually nil — there are no meaningful FII or DII holders — so this is a promoter-plus-retail register, with retail shareholder count rising toward 4,800.
Alignment note: because the promoter owns just over half the equity, roughly half of every rupee distributed flows to the family — but the payout is so small that the dividend is not a promoter cash-extraction mechanism. Retained earnings, not dividends, are doing the heavy lifting for the promoter’s wealth here, via the stock’s re-rating and the bonus issue.
Taxation Analysis
Since April 2020, dividends in India are taxed in the hands of the shareholder. There is no dividend distribution tax at the company level any more — instead the dividend is added to your total income and taxed at your applicable income-tax slab rate.
- The full dividend is taxable at your slab rate (0% to 30% plus surcharge and cess).
- The company deducts TDS at 10% under Section 194 only if your total dividend from that company in the year exceeds ₹5,000. Below that, no TDS is deducted (a lower/nil rate applies with Form 15G/15H where eligible).
- You can claim credit for any TDS deducted when you file your return.
Worked example — 1,000 shares at ₹1 dividend, 30% slab
In this example the shareholder keeps ₹700 of a ₹1,000 dividend — a post-tax yield of well under a tenth of a percent on today’s price. For a high-slab investor, the dividend from IPCL is close to a rounding error; the return case, if any, rests entirely on capital appreciation.
Tax treatment is general and illustrative, not personal tax advice. Surcharge and cess, and the ₹5,000 TDS threshold, apply per company per year. Consult a qualified tax professional for your own situation.
Key Risks
1. Extreme valuation. At roughly 82–94x earnings and ~12x book, IPCL trades far above the auto-components average of about 34x. Any earnings disappointment leaves a long way to fall.
2. Sharp, unexplained price run-up. The stock roughly doubled in three months, and the exchange sought a clarification on the price movement in June 2026. Momentum this steep can reverse quickly.
3. Trade-for-trade / low liquidity. The NSE line trades in the “BE” (trade-for-trade) segment — delivery only, no intraday netting — and daily volumes are thin, which can amplify price swings.
4. Net-debt balance sheet in a capex cycle. Borrowings of about ₹72 crore have been rising to fund expansion, and free cash flow is thin. Rising rates or a demand dip would pressure both.
5. Customer and cyclicality risk. A large share of revenue is tied to the automotive cycle; a slowdown in auto OEM demand would hit volumes and the recently expanded margins.
6. Modest through-cycle returns. Three-year average ROE near ~9.7% shows the business historically earns modest returns on capital, which sits awkwardly against the current premium multiple.
What To Monitor
1. Margin durability. OPM jumped to ~20.7% in Q1 FY27. Watch whether the higher-margin aerospace/defence mix holds or whether margins revert toward the mid-teens.
2. Aerospace & defence order flow. Track new approvals and orders (e.g. the MKU precision-aluminium/thermal-sight order) and how quickly they convert to revenue.
3. Debt trajectory. Watch whether borrowings keep climbing with capex, or start to ease as the new capacity (including the solar plant) generates returns.
4. Free cash flow recovery. FCF was thin (~₹2 Cr) in a heavy-capex year. Monitor whether it strengthens once the investment phase moderates.
5. Payout policy. With payout under 8%, watch whether management lifts the dividend as profits scale, or keeps retaining for growth.
6. Institutional entry. With FII/DII near zero, any first meaningful institutional buying (or a liquidity/segment upgrade) would be a notable signal.
Conclusion
Investment & Precision Castings’ FY26 final dividend of ₹1 per share is best understood as a token, symbolic payout — comfortably affordable (under 8% of profit, covered ~26x by operating cash) but delivering a real yield of only about 0.08% after the stock’s dramatic re-rating. The more important corporate action of the year was the 1:1 bonus, which doubled the share base and means continuing holders collect four times the cash-per-original-share they did a year earlier, even though the headline per-share figure looks small.
The positives: genuine operating leverage, expanding margins, a growing aerospace/defence/medical mix, and a dividend that is easily sustainable. The negatives and risks: an extreme valuation, a sharp price move that drew an exchange query, a net-debt balance sheet in a capex-heavy phase, thin free cash flow, low liquidity, and modest through-cycle returns on equity. This is unambiguously a growth / re-rating story, not a dividend-income story. We present the evidence on both sides; the decision is yours.
Frequently Asked Questions
What dividend has Investment & Precision Castings announced for FY2025–26?
What is the Investment & Precision Castings dividend yield?
What was the record date for the dividend?
What was the ex-dividend date?
When will the dividend be paid?
Who was eligible for this dividend?
How is this dividend taxed?
Is the Investment & Precision Castings dividend sustainable?
What is the company’s dividend history?
Did the 1:1 bonus affect this dividend?
Why has the dividend yield fallen even though the dividend rose?
What should investors monitor going forward?
Disclaimer
ShareBazaar Online is not registered with SEBI as an investment adviser or research analyst. This article is for informational and educational purposes only and does not constitute investment advice or any buy, sell or hold recommendation. Figures are compiled from company exchange filings and public data sources and may contain errors or become outdated; the market price in particular changes continuously, so all yield figures must be re-verified against the live price. Dividend dates and amounts are subject to the company’s and regulator’s final records. Taxation is general and not personal tax advice. Please verify all data from primary sources and consult a SEBI-registered adviser and a qualified tax professional before making any investment decision. Investments in securities are subject to market risks.