
Dividend Snapshot
Total Dividend (FY2025–26)
₹1.00 per share (10% of face value)
₹0.50 Final + ₹0.50 Special · Face value ₹10
Dividend Yield (on CMP ₹162)
~0.62%
~0.50% on the announcement-day price (₹199.30)
Record Date (revised)
Thursday, 6 August 2026
Revised from 31 July 2026 via corrigendum dated 31 July 2026
AGM & Approval
16th AGM: 7 August 2026
Held via VC/OAVM; dividend was subject to member approval
The one line that matters: InfoBeans’ total dividend outflow rose to roughly ₹9.70 crore for FY26 — about 4× the ~₹2.4 crore the same ₹1.00-per-share rate would have cost before the 3:1 bonus. The per-share figure looks unchanged; the actual cash returned to shareholders has multiplied.
Dividend Announcement Summary
The Board of Directors of InfoBeans Technologies Ltd, at its meeting held on 28 April 2026, recommended a final dividend of ₹0.50 per equity share along with a special dividend of ₹0.50 per equity share for the financial year ended 31 March 2026, subject to shareholder approval at the 16th Annual General Meeting.
The company later issued a corrigendum dated 31 July 2026 revising the dividend record date from Friday, 31 July 2026 to Thursday, 6 August 2026. The corrigendum clarified that only the dividend record date changed — the AGM date, the e-voting cut-off and all other particulars of the AGM notice stayed the same.
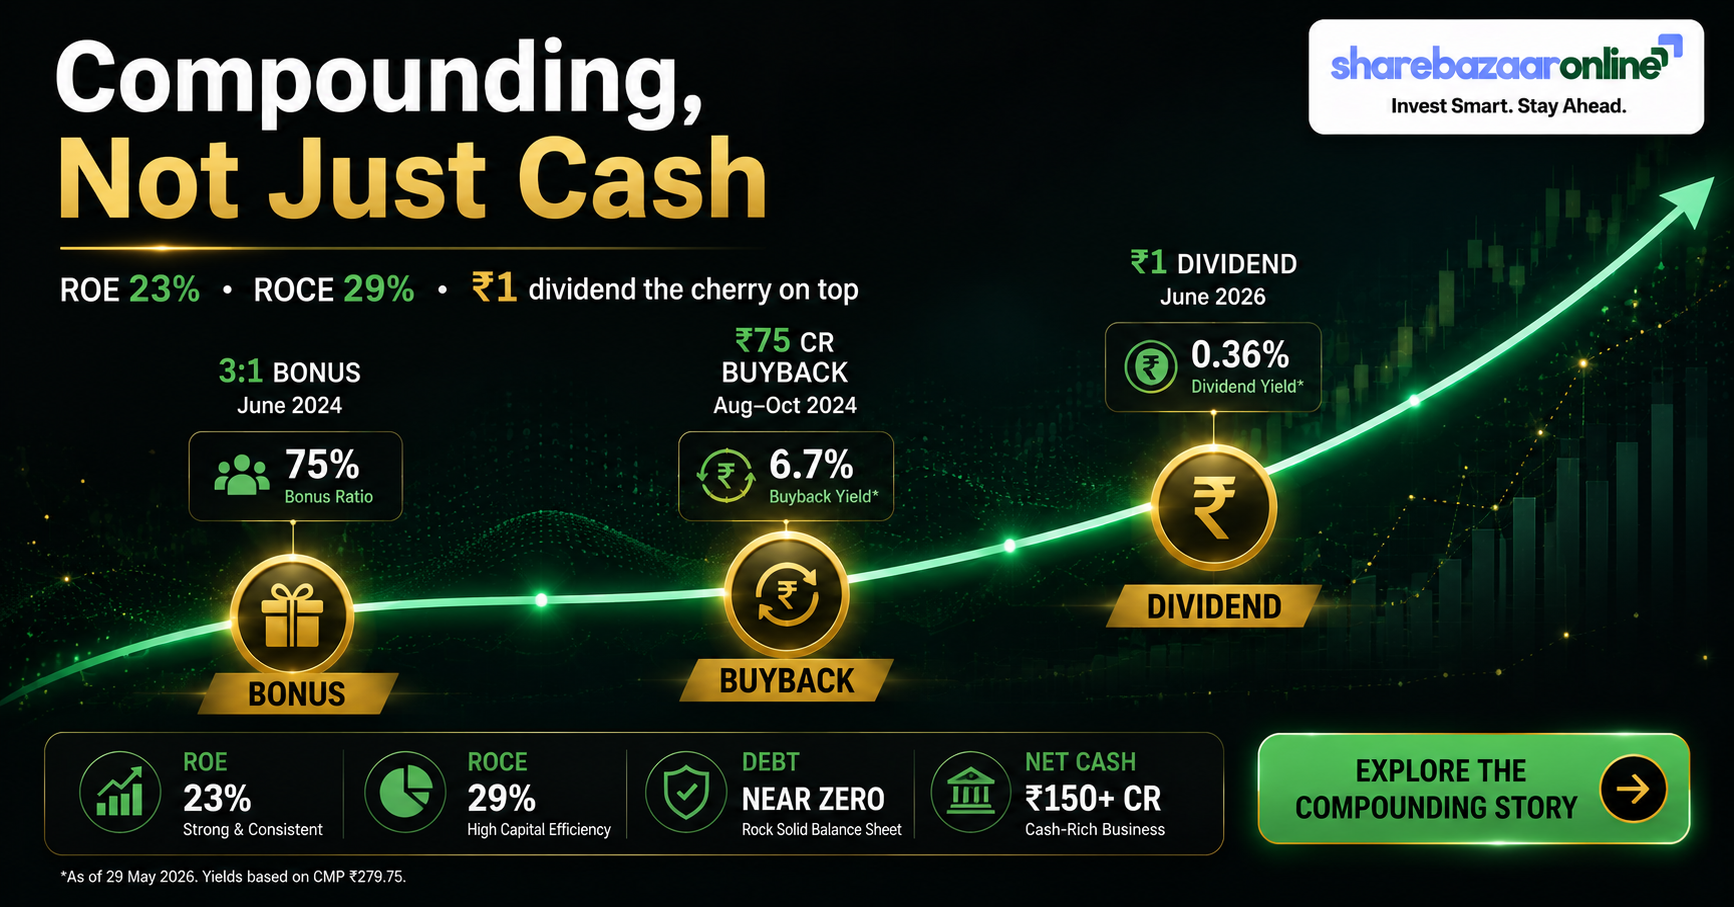
The context to remember: this is the first cash dividend declared after the company’s 3:1 bonus issue (ex-date 27 February 2026) and its FY25 buyback at ₹464 per share. So the same ₹1.00 rate now applies to a much larger post-bonus share base.
Identity & Instrument
- Company: InfoBeans Technologies Ltd
- NSE: INFOBEAN · BSE: 543644
- ISIN: INE344S01016
- CIN: L72200MP2011PLC025622
- Face Value: ₹10 per share
Dividend Terms
- Final dividend: ₹0.50 / share
- Special dividend: ₹0.50 / share
- Total: ₹1.00 / share (10% of FV)
- For: FY2025–26 (ended 31 Mar 2026)
- Board recommendation date: 28 Apr 2026
Key Dates Timeline
| Event | Date | Source / Status |
|---|---|---|
| Board recommendation | 28 April 2026 | Company / press reports |
| Original record date | 31 July 2026 | Superseded |
| Revised record date | 6 August 2026 | Corrigendum (31 Jul 2026) — disclosed |
| Ex-dividend date | ~6 August 2026 | Inferred under T+1 convention — verify NSE/BSE circular |
| 16th AGM | 7 August 2026 | Disclosed (VC/OAVM) |
| Payment date | Not Disclosed by Company | Statutory outer limit ~6 Sep 2026 (within 30 days of AGM) |
Note for readers: the record date is the eligibility cut-off — you needed the shares in your demat account as of the end of 6 August 2026. Since India settles on a T+1 basis, the ex-date and record date effectively coincide. The exact payment date was not specified in the filing; under the Companies Act it must be paid within 30 days of the AGM declaration.
Dividend Yield Analysis
The two yields that matter
- On current price (~₹162): ~0.62%
- On announcement-day price (~₹199.30): ~0.50%
- Post-tax yield (30% slab): ~0.43%
Yield reality check
A sub-1% yield is not a red flag here — it is exactly what you expect from a fast-growing, capital-light IT services company that reinvests most of its earnings. InfoBeans keeps its payout ratio near 11%; the return to shareholders is coming through growth, bonus shares and buybacks, not through dividend cheques.
Why the yield “10% dividend” headline is misleading: a “10% dividend” sounds large, but that 10% is on the ₹10 face value — i.e. ₹1.00 per share. Against the market price of ~₹162, the real cash yield is only ~0.62%. Always divide the rupee dividend by the market price, never the face value, to get the yield that actually lands in your account.
Dividend History Analysis
| Financial Year | Dividend Payout Ratio* | Bonus-adjusted EPS* |
|---|---|---|
| FY2021 | ~20% | ₹3.83 |
| FY2022 | ~4% | ₹5.69 |
| FY2023 | ~7% | ₹3.71 |
| FY2024 | ~11% | ₹2.31 |
| FY2025 | ~6% | ₹3.89 |
| FY2026 | ~11% | ₹8.94 |
*Payout ratio and per-share figures per Screener (consolidated). EPS is shown bonus-adjusted for comparability. Aggregator sites report per-share dividend history inconsistently across the 2026 bonus; figures cross-referenced and flagged where not primary-source confirmed.
The bonus illusion most reports miss
Before the 3:1 bonus, InfoBeans had about 2.42 crore shares and typically paid around ₹1.00 per share — an annual outflow of roughly ₹2.4 crore. After the bonus, the share count rose to about 9.70 crore shares. Paying the same ₹1.00 rate now costs about ₹9.70 crore — a ~4× jump in the actual cash distributed.
Put the other way round: a pre-bonus ₹1.00 dividend is worth only about ₹0.25 in today’s post-bonus share terms. So the FY26 ₹1.00 is effectively 4× the bonus-adjusted run-rate. Headlines calling this a “flat ₹1 dividend” are technically correct on the per-share number but economically wrong on what shareholders received.
Classification: Consistent Payer with a clear step-up. InfoBeans has paid a dividend every year since listing, has never suspended it, and has now layered a special dividend, a bonus and a buyback on top — a shareholder-friendly capital-return posture, funded from a strong balance sheet.
Financial Performance Analysis
| Consolidated (₹ cr) | FY2024 | FY2025 | FY2026 |
|---|---|---|---|
| Revenue | 369 | 395 | 514 |
| Operating Profit | 51 | 68 | 113 |
| Operating Margin | 14% | 17% | 22% |
| Net Profit (PAT) | 22 | 38 | 87 |
| EPS (bonus-adjusted) | ₹2.31 | ₹3.89 | ₹8.94 |
Source: Screener (consolidated). FY26 revenue ₹514 cr (core); total income including other income was ~₹539 cr per company reporting.
Operating leverage worked in FY26
Revenue grew ~30%, but PAT more than doubled (+128% to ₹87 cr) and operating margin expanded from 17% to 22%. Costs grew slower than sales — textbook positive operating leverage. The result: EPS jumped even after the bonus enlarged the share base.
Watch the base effect & Q1FY27
Part of the +128% PAT leap is a low FY25 base (₹38 cr) and FY26 also carried a chunky ₹25 cr other income. In Q1FY27 (Jun 2026), sales rose ~37% YoY to ₹153 cr but PAT fell ~7% to ₹21.6 cr — a reminder that the headline growth rate can be lumpy quarter to quarter.
Cash Flow Analysis
| Consolidated (₹ cr) | FY2024 | FY2025 | FY2026 |
|---|---|---|---|
| Operating Cash Flow (CFO) | 44 | 50 | 85 |
| Free Cash Flow (FCF) | 42 | 45 | 71 |
| CFO / Operating Profit | 108% | 94% | 94% |
Profit is backed by cash
FY26 operating cash flow of ₹85 cr converted ~94% of operating profit into cash — healthy for an IT services firm. Reported profit here is not an accounting mirage; it is arriving as real cash. Debtor days actually improved to 77 from 80.
How is the dividend funded?
The ₹9.70 cr dividend is a small fraction of the ₹71 cr free cash flow InfoBeans generated in FY26 — a coverage of about 7.3×. This payout is funded comfortably from current-year operations, not from reserves, asset sales or borrowings.
Balance Sheet Strength
Near debt-free, cash-rich
- Investments: ₹165 cr
- Borrowings: ₹15 cr (down from ₹20 cr)
- Net cash / investments: ~₹150 cr
- Debt-to-equity: ~0.04
Return ratios & net worth
- ROE (FY26): 23.2%
- ROCE (FY26): 29.2%
- Net worth: ~₹414 cr
- Book value: ~₹42.6 per share
Read the equity-capital jump correctly: equity capital leapt from ₹24 cr to ₹97 cr in FY26. That is not a fresh fund-raise — it is the accounting entry for the 3:1 bonus, where ~₹73 cr of reserves was capitalised into share capital. That is also why reserves barely moved (₹308 cr → ₹317 cr) despite ₹87 cr of profit. The dividend is being paid against a fortress balance sheet with net cash of about ₹150 crore.
Dividend Sustainability Analysis
| Coverage Test | Metric | Verdict |
|---|---|---|
| Earnings coverage | EPS ₹8.94 vs ₹1.00 = 8.9× | Pass |
| Operating cash flow | ₹85 cr vs ₹9.7 cr = 8.8× | Pass |
| Free cash flow | ₹71 cr vs ₹9.7 cr = 7.3× | Pass |
| Cash / liquidity | ₹165 cr vs ₹9.7 cr = 17× | Pass |
Overall verdict: Sustainable
All four coverage tests pass comfortably. The payout ratio is a conservative ~11%, earnings and cash flow are growing, debt is negligible and liquidity is deep. The one nuance: ₹0.50 of the ₹1.00 is a special dividend — by definition one-time. The recurring base to model going forward is the ₹0.50 final dividend; the special top-up may or may not repeat. Even so, the recurring ₹0.50 is itself a step-up over the bonus-adjusted historical run-rate.
Peer Comparison
| Company / Benchmark | Dividend Yield | Payout | ROE |
|---|---|---|---|
| InfoBeans Technologies | ~0.62% | ~11% | 23.2% |
| Wipro (large-cap ref.) | ~6.0% | ~87% | |
| TCS (large-cap ref.) | ~46% | ||
| Indian IT industry avg. | ~1.2%–3.7% | ||
| Indian market top-25% payers | ~1.51% |
Blank cells are left empty rather than filled with unverified figures. Small-cap direct peers (Nucleus Software, Expleo, Ramco, Alldigi, Accelya) were Not Independently Verified this session. Large-cap and index yields are reference benchmarks, not direct comparables.
How to read this: mature large-caps like Wipro yield ~6% because they pay out most of their profit (payout ~87%). InfoBeans yields far less because it is a growth-stage compounder retaining ~89% of earnings to fund expansion — while still delivering a superior ROE of 23% and ROCE near 29%. Comparing InfoBeans’ yield to a mature payer’s misreads the business stage.
Promoter Impact Analysis
Where the ₹9.70 cr goes
- Promoter holding: ~72.82%
- Promoter dividend income: ~₹7.06 cr
- Public / minority (~27.18%): ~₹2.64 cr
Alignment check
With promoters holding nearly 73%, the bulk of every dividend rupee flows to the promoter group — but crucially, they receive it pro-rata, exactly like every other shareholder. There is no preferential mechanism. Interests are aligned: the same ₹1.00 per share reaches promoters and retail investors alike.
Context: promoter holding has drifted down slightly (from ~74% to ~72.8%) around the bonus and buyback period, while the number of public shareholders has surged from ~25,000 to over 34,000 — a sign of rising retail interest. FII holding remains minimal (~0.4%), so this is largely a promoter-plus-retail ownership story.
Taxation Analysis
Since April 2020, dividends are taxed in the hands of the investor at their applicable income-tax slab rate — there is no Dividend Distribution Tax anymore. The company deducts TDS at 10% under Section 194 if your total dividend from that company in the year exceeds ₹10,000 (threshold raised from ₹5,000 with effect from FY2025–26). For NRIs, TDS is higher (typically 20% plus surcharge/cess, subject to treaty relief).
Worked example — retail (1,000 shares)
- Gross dividend: 1,000 × ₹1.00 = ₹1,000
- TDS: Nil (below ₹10,000 threshold)
- Tax at 30% slab + 4% cess: ~₹312
- Net in hand after filing: ~₹688
- Post-tax yield on ₹162: ~0.43%
Worked example — larger holding (20,000 shares)
- Gross dividend: 20,000 × ₹1.00 = ₹20,000
- TDS at 10% (over ₹10,000): ₹2,000
- Credited after TDS: ₹18,000
- Total tax at 30% + cess: ~₹6,240
- Balance payable at filing: ~₹4,240
Illustrative only; assumes highest slab. Your actual tax depends on your total income and regime. Consult a tax adviser.
Key Risks
- Client & geography concentration: InfoBeans is a mid/small-cap IT services firm serving Fortune-500 clients concentrated in the US and Germany. A slowdown or a single large client loss can swing quarterly earnings materially.
- Margin volatility: operating margin has swung between 14% and 22% over three years. The strong FY26 margin (22%) may not hold if wage inflation, currency, or discretionary-spend cuts bite. Q1FY27 PAT already fell ~7% YoY.
- Reliance on other income & base effects: FY26 PAT (+128%) was flattered by a low FY25 base and ~₹25 cr of other income. Core operating growth is strong but the headline number overstates the run-rate.
- Special dividend is not recurring: half of the ₹1.00 is a one-time special dividend. Investors modelling ₹1.00 as a permanent rate may be disappointed if only the ₹0.50 final repeats.
- AI disruption to IT services: the same AI wave InfoBeans is monetising could compress pricing and headcount-linked revenue across the sector — a structural risk for all traditional IT services providers.
- Structural / subsidiary changes: the board approved voluntary liquidation of its US LLC (operations shifting to a DMCC entity), a reorganisation whose tax and operational effects should be monitored.
What To Monitor
- Recurring vs special split next year: does the FY27 dividend keep the ₹0.50 final and repeat (or drop) the special? That tells you the true sustainable payout.
- Operating margin trajectory: can InfoBeans hold ~20%+ margins, or was FY26 a peak? Watch each quarter’s OPM print.
- Revenue quality: track the mix of core operating profit vs other income, and whether AI-augmented services (reported as a rising share of revenue) actually convert to margin.
- Cash conversion & debtor days: continued CFO/OP near 90%+ and debtor days near 77 would confirm earnings quality; a rise would be a caution flag.
- Capital-allocation cadence: after a bonus, a buyback and a special dividend, watch whether management keeps returning surplus cash or pivots to acquisitions/capex.
- Promoter holding & institutional interest: any further promoter dilution, or a pickup in FII/DII holding from the current near-zero base.
Conclusion
InfoBeans Technologies’ FY2025–26 dividend of ₹1.00 per share is far more interesting than the flat per-share number suggests. Because it follows a 3:1 bonus, the same rate now moves roughly ₹9.70 crore of cash — about 4× the pre-bonus equivalent — and it is backed by record profits (₹87 cr), strong free cash flow (₹71 cr), a near debt-free balance sheet and net cash of ~₹150 crore.
On every affordability test — earnings, operating cash flow, free cash flow and liquidity — the payout is comfortably covered, making it sustainable. The honest caveats: the yield is low (~0.62%) because this is a reinvesting growth company, half the dividend is a one-time special, and the +128% profit jump rode a low base plus other income. InfoBeans is a capital-return and compounding story, not an income-yield story.
We present the positives, the negatives, the risks and the monitoring factors. The decision — whether this fits your portfolio — is yours to make.
Frequently Asked Questions
What dividend has InfoBeans Technologies announced for FY2025–26?
What is the InfoBeans dividend yield?
What is the record date for the InfoBeans dividend?
What is the ex-date for the InfoBeans dividend?
When will the InfoBeans dividend be paid?
Who is eligible to receive the dividend?
How is the InfoBeans dividend taxed?
Is the InfoBeans dividend sustainable?
What is InfoBeans’ dividend history — and how did the bonus change it?
Did InfoBeans issue bonus shares and do a buyback recently?
Why is the dividend yield so low if the company is doing well?
How much of the dividend goes to promoters?
What should investors monitor going forward?
Disclaimer
This article is for informational and educational purposes only and does not constitute investment, legal or tax advice, nor a buy/sell/hold recommendation. ShareBazaar Online is not a SEBI-registered investment adviser. Figures are drawn from company filings and public sources (including Screener, exchange filings and press reports) believed to be reliable but not independently guaranteed; some values (announcement-day price, ex-date, payment date, per-share dividend history across the bonus) are inferred or cross-referenced and are flagged accordingly. Market prices are dynamic — verify live data before acting. Dividend, bonus and buyback details are subject to statutory approvals and corporate-action circulars. Investments in securities are subject to market risks; please read all related documents carefully and consult a SEBI-registered adviser and a qualified tax professional before investing. ShareBazaar Online and its authors accept no liability for any loss arising from the use of this information.