
Dividend Snapshot
Dividend Per Share
₹1.00
Final dividend — 10% of ₹10 face value
Dividend Yield (on current price)
~0.55%
On CMP of ~₹183 (NSE, 12 Aug 2026)
Record Date
06 Aug 2026
Eligibility cut-off (already passed)
Payment Date
On / around 12 Sep 2026
Subject to AGM approval on 13 Aug 2026
Type
Final
Face Value
₹10
Financial Year
FY2025-26
Dividend Outflow
~₹3.20 cr
Figures: exchange filing dated 19 May 2026 (dividend, face value); NSE/Screener.in (price, yield); NSE/BSE corporate-action circulars (record & payment dates). All yield figures are price-dependent — re-verify against the live quote.
Dividend Announcement Summary
At its board meeting on 19 May 2026, the Board of Directors of Mindteck (India) Limited approved the audited financial results for the quarter and year ended 31 March 2026 and recommended a final dividend of Re. 1 per equity share (10%) for FY2025-26. The recommendation is made under Regulation 30 read with Schedule III of the SEBI (LODR) Regulations, 2015, and is subject to shareholder approval at the company’s 35th Annual General Meeting.
What the company said
Chairman Javed Gaya said the year reflected a “weaker revenue performance” but that operational discipline and cost efficiency helped protect profitability. CEO Karim Dhanani attributed the revenue decline mainly to the divestiture of low-margin business, noting that a focus on higher-quality revenue and cost management lifted consolidated net profit 9.9%.
Same amount, third year running
The Re. 1 payout is unchanged from FY2024-25 (also Re. 1) and restores the level after a dip to ₹0.80 in FY2023-24. The board framed it as a “final dividend” only — Mindteck did not pay any interim or special dividend during the year.
Latest available context (Q1 FY27)
On 12 August 2026, Mindteck reported Q1 FY27 results with consolidated revenue of about ₹104.08 crore and net profit of roughly ₹8.36 crore — a firm start to the new year and a data point worth reading alongside this dividend. (Source: BSE filing, 12 Aug 2026.)
Key Dates Timeline
| Event | Date | Status |
|---|---|---|
| Board / Announcement | 19 May 2026 | Done |
| Record Date | 06 Aug 2026 (Thu) | Passed |
| Ex-Dividend Date | 06 Aug 2026 | Passed |
| Register of Members closed | 07 Aug – 13 Aug 2026 | Book closure |
| 35th AGM (approval) | 13 Aug 2026 (Thu), via VC | Pending approval |
| Expected Payment | On / around 12 Sep 2026 | Upcoming |
The ex-date and record date fall on the same day under the current T+1 settlement cycle. Dates sourced from the company’s AGM/book-closure newspaper notice and corporate-action data; the payment date is the widely-reported expected date and should be confirmed against the final AGM outcome.
Dividend Yield Analysis
The “10% dividend” headline vs. real yield
Wire coverage often says Mindteck declared a “10% dividend.” That 10% is only the payout on the ₹10 face value — it is not what an investor earns. On the market price, the real yield is under 0.6%. Because the dividend is a flat Re. 1, the yield an investor actually gets depends entirely on the price paid.
Yield on announcement-day price
~0.47%
Re. 1 ÷ ~₹213 (NSE close, 19 May 2026)
Yield on current price
~0.55%
Re. 1 ÷ ~₹183 (NSE, 12 Aug 2026)
Yield Reality Check
The current yield (~0.55%) is higher than the announcement-day yield (~0.47%) — but not because the dividend grew. It didn’t; it is flat at Re. 1. The yield rose only because the share price fell about 14% from ~₹213 on 19 May to ~₹183 by 12 August 2026. A rising yield driven by a falling price is not the same as a rising yield driven by a bigger dividend. Mindteck remains a low-yield stock; investors buy it for growth and balance-sheet strength, not income.
Dividend History Analysis
| Financial Year | Dividend / Share | EPS (₹) | Payout % |
|---|---|---|---|
| FY2025-26 | ₹1.00 | 9.86 | ~10% |
| FY2024-25 | ₹1.00 | 8.99 | ~11% |
| FY2023-24 | ₹0.80 | 8.62 | ~9% |
| FY2022-23 | ₹1.00 | 6.57 | ~12% |
| FY2021-22 | ₹1.00 | 10.38 | ~8% |
| FY2020-21 | Nil | 3.39 | 0% |
| FY2019-20 | Nil | -20.25 | 0% |
| FY2018-19 | ₹1.00 | 0.86 | ~92% |
| FY2016-17 | ₹1.00 | 2.93 | ~27% |
What the record actually shows
Mindteck is best described as a cyclical / recently-normalised payer, not a steady grower. It paid Re. 1 for years, then suspended the dividend for two years (FY20 and FY21) around the pandemic, trimmed to ₹0.80 in FY24, and restored Re. 1 in FY25 and FY26. The absolute payout has not grown in a decade.
The FY19 payout distortion
The ~92% payout in FY19 looks alarming but is a base-effect illusion: earnings that year collapsed to an EPS of just ₹0.86, so a flat Re. 1 dividend swallowed almost all profit. In a normal-earnings year the same Re. 1 is a comfortable ~10–12% of profit. Face value has stayed ₹10 throughout, so per-share comparisons above need no split adjustment.
Financial Performance Analysis
| Consolidated (₹ cr) | FY2025-26 | FY2024-25 | Change |
|---|---|---|---|
| Revenue from operations | 407.30 | 424.42 | -4.0% |
| Operating profit | ~38 | ~35 | +8.6% |
| PBT (pre-exceptional) | 42.35 | 37.02 | +14.4% |
| Net profit (PAT) | 31.52 | 28.68 | +9.9% |
| EPS (basic) | ₹9.86 | ₹9.02 | +9.3% |
Operating leverage: revenue down, profit up
This is the year’s central story. Revenue fell 4.0% yet PAT rose 9.9% and operating margin expanded from about 8.2% to 9.3%. Management says this reflects a deliberate exit from low-margin business plus tight cost control — consolidated other expenses fell sharply year-on-year. In other words, Mindteck shrank its top line on purpose to lift the quality of its earnings. The flip side: a company that is not growing revenue has limited scope to grow the dividend from operations over time.
One-offs to keep in view
FY26 PAT is stated after a ₹5.30 crore exceptional charge for the new Labour Codes (a one-time past-service gratuity/leave impact) and a ₹1.91 crore recovery linked to prior US sales-restructuring. Roughly ₹10 crore of “other income” (largely interest on the company’s cash pile) also sits inside profit, so a slice of reported earnings is treasury income rather than core services profit.
Cash Flow Analysis
Reported profit is an accounting opinion; cash is a fact. On a consolidated basis the dividend is very comfortably funded — but the standalone (parent) cash flow, which actually pays the dividend, weakened sharply this year, and that is the finding wire coverage misses.
Consolidated — healthy
- Operating cash flow: ₹26.03 cr (about 92% of operating profit — good conversion)
- Free cash flow: ₹25.52 cr (capex is tiny for an asset-light services firm)
- Dividend outflow: ~₹3.20 cr — covered ~8x by FCF
Standalone (parent) — the flag
- Standalone OCF fell from ₹15.99 cr to ₹4.28 cr (-73%)
- Cause: standalone trade receivables jumped +50% (₹36.2 cr → ₹54.6 cr)
- That single-year OCF covers the ~₹3.20 cr dividend only ~1.3x
Receivables growing faster than revenue
Consolidated debtor days rose to about 102 days (from ~87) and working-capital days to ~66 (from ~53). Revenue fell 4% while receivables rose — cash is being tied up in the balance sheet. This did not threaten the dividend (the company sits on a large cash pile), but it is a genuine cash-quality signal to watch, especially at the parent level where the standalone dividend is actually paid from. The verdict: the dividend is funded comfortably from accumulated cash and reserves; it was not fully funded from this year’s standalone operating cash generation.
Balance Sheet Strength
Cash, bank & treasury (consolidated)
~₹191.8 cr
Cash ₹61.7 cr + bank ₹73.9 cr + treasury bills ₹56.3 cr
Total equity (net worth)
~₹303.6 cr
Book value ~₹95 per share
Borrowings
Effectively nil
Almost debt-free; only small lease liabilities
Cash coverage of dividend
~60x
Liquid assets ÷ ~₹3.20 cr outflow
Mindteck runs a fortress balance sheet for a small-cap: it is almost debt-free and holds liquid assets of roughly ₹192 crore — about a third of its entire market capitalisation. The proposed dividend is a rounding error against this cash. Affordability is not in question; the honest debate is about capital allocation (below).
Dividend Sustainability Analysis
| Coverage test | Reading | Verdict |
|---|---|---|
| Earnings coverage | EPS ₹9.86 vs DPS Re. 1 = 9.9x | Strong |
| Consolidated OCF coverage | ~8.1x | Strong |
| Consolidated FCF coverage | ~8.0x | Strong |
| Cash / liquidity coverage | ~60x | Very strong |
| Standalone (parent) OCF coverage | ~1.3x (OCF fell 73%) | Watch |
Verdict: Sustainable
On every consolidated test the Re. 1 dividend is easily covered, and the enormous cash cushion makes a cut highly unlikely in the near term. The one amber note is that the standalone operating cash flow — the pool the parent actually distributes from — shrank 73% this year on a receivables build-up. That is a quality caveat, not a solvency problem: the dividend stays sustainable, but a small-cap that isn’t growing revenue is unlikely to raise the payout aggressively.
Peer Comparison
| Company (engineering / IT services) | Dividend Yield | Payout | ROE | ROCE |
|---|---|---|---|---|
| Mindteck (India) | ~0.55% | ~10% | ~12.1% | ~15.1% |
| Sasken Technologies | ~2.5% | ~100% | NA* | NA* |
| Cyient | ~3.4% | NA* | NA* | NA* |
| Tata Elxsi | ~1.3–1.8% | ~63% | ~28.6% | NA* |
Against dividend-paying engineering/IT peers, Mindteck is a low-yield, low-payout name. Sasken and Cyient return far more of their profit to shareholders (Sasken at ~100% payout, Cyient at a ~3%+ yield), while Tata Elxsi pairs a modest yield with a much higher ROE (~28%). Mindteck’s ~10% payout means it retains ~90% of profit — consistent with a company hoarding cash rather than distributing it. Its ROE (~12%) is respectable but below the best-in-class peers.
*Cells marked NA are left blank rather than filled with unconfirmed figures. Yields/payouts sourced from Screener.in, Simply Wall St, INDmoney and marketscreener; peer prices move daily — treat as indicative. Not a like-for-like recommendation.
Promoter Impact Analysis
Promoter holding
64.20%
FII ~0.06%, DII ~0% (Jun 2026)
Promoter share of dividend
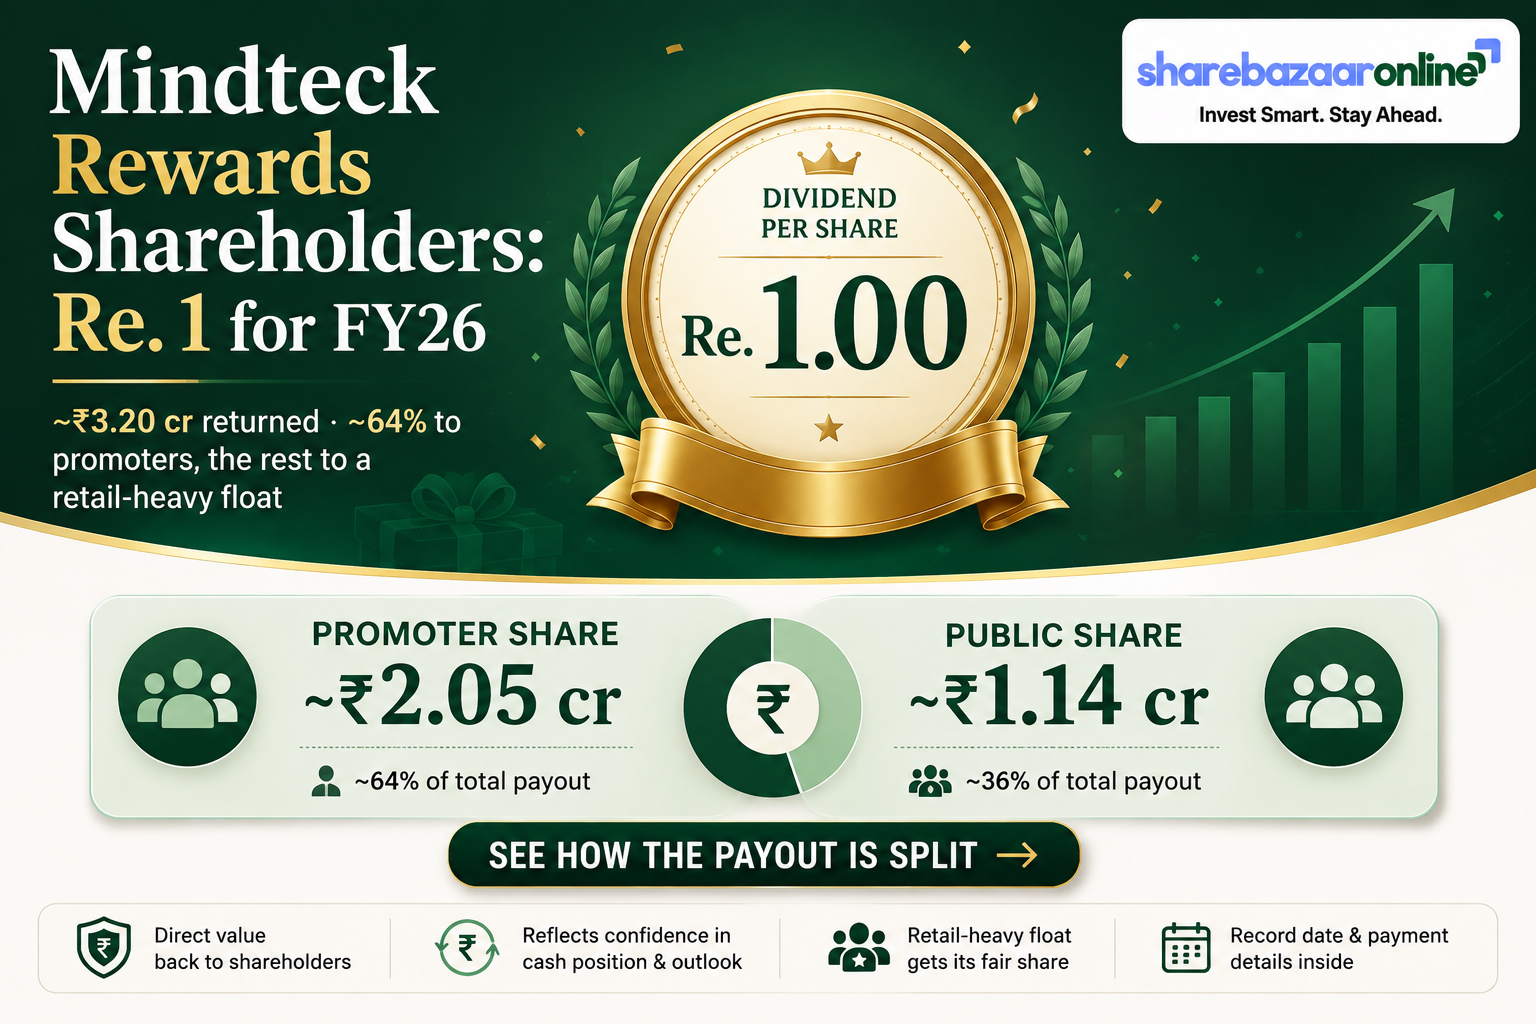
~₹2.05 cr
Public shareholders receive ~₹1.14 cr
With a 64.2% promoter stake, roughly ₹2.05 crore of the ~₹3.20 crore payout flows to the promoter group, and ~₹1.14 crore to public shareholders. Because institutional ownership is negligible, the dividend is essentially a distribution shared between the promoter and a retail-heavy public float. The payout is too small to meaningfully move promoter cash flows, and it is spread proportionately — there is no structural bias against minority shareholders here. The larger question is not who gets the dividend but whether so much cash should be retained at all.
Taxation Analysis
How dividends are taxed in India
Since the abolition of Dividend Distribution Tax, dividends are taxable in the hands of the shareholder at their applicable income-tax slab rate. The company deducts TDS at 10% once total dividend paid to a resident shareholder in a financial year crosses the threshold (currently ₹10,000 for resident individuals); TDS is 20% where a valid PAN is not furnished. Non-resident shareholders face different rates, subject to tax-treaty benefits and documentation.
Worked example — 1,000 shares, 30% slab
| Gross dividend (1,000 × Re. 1) | ₹1,000 |
| TDS deducted (below ₹10,000 threshold) | ₹0 |
| Tax at 30% slab (+4% cess) | −₹312 |
| Net dividend in hand | ₹688 |
| Effective post-tax yield (on ~₹183) | ~0.38% |
Illustrative only. Cess, surcharge and slab differ by investor; the ₹10,000 TDS threshold and slab treatment reflect current rules. Consult a tax adviser for your situation. Mindteck issued a shareholder TDS communication ahead of the record date.
Key Risks
1. Shrinking / stagnant revenue
Revenue fell 4% in FY26 and 5-year sales growth is only ~7%. Profit growth has come from margins and cost cuts, which have limits; the top line must eventually turn to sustain earnings.
2. Client & geographic concentration
A large share of revenue is USA-linked (~₹160 cr of ₹407 cr). A US demand slowdown, or the loss of a large storage/semiconductor/medical-device client, would hit results directly.
3. Rising receivables / working capital
Debtor days rose to ~102 and standalone OCF fell 73%. Sustained receivables build-up ties up cash and can signal collection or client-quality stress.
4. Currency exposure
Most revenue is billed in USD and other foreign currencies. Rupee appreciation, or volatile forex translation, can swing reported profit — part of FY26 “other comprehensive income” was translation gains.
5. Low liquidity & small-cap volatility
Daily traded volumes are thin and the stock is high-beta; it fell ~14% between the dividend announcement and mid-August. Price swings dwarf the ~0.55% yield.
6. Idle-cash / capital-allocation risk
Holding ~₹192 cr (a third of market cap) in cash and treasury bills while paying out only ~10% of profit can depress ROE if the cash is neither reinvested for growth nor returned more generously.
What To Monitor
- Revenue trajectory: whether the “higher-quality revenue” strategy translates into a return to top-line growth. Q1 FY27 revenue of ~₹104 cr and PAT of ~₹8.4 cr (reported 12 Aug 2026) is an encouraging first read.
- Receivables & standalone OCF: a reversal of the debtor-day rise and a recovery in parent-level operating cash flow would remove the year’s main cash-quality flag.
- Operating margin: can the ~9% OPM hold now that the easy cost cuts and low-margin exits are done?
- Capital-allocation signals: any buyback, special dividend, acquisition or step-up in payout would show what management intends to do with the ~₹192 cr cash pile.
- Client & US demand: commentary on order intake, large-client renewals and the storage/semiconductor/medical-device end markets.
- Next dividend size: whether the board keeps Re. 1 or finally lifts the flat, decade-old payout.
Conclusion
Mindteck’s FY26 final dividend of Re. 1 is safe, small and static. It is covered nearly 10x by earnings and ~60x by cash, from a company that is almost debt-free and holds liquid assets worth about a third of its market capitalisation — so sustainability is not in doubt. But the headline “10% dividend” is a face-value figure; the real yield is only ~0.55%, and it rose from ~0.47% only because the share price fell ~14% since the announcement, not because the dividend grew.
Positives
- Profit up 9.9% despite a 4% revenue dip — better earnings quality
- Almost debt-free; ~₹192 cr cash and treasury
- Dividend covered ~8x by free cash flow (consolidated)
- Firm Q1 FY27 start
Negatives / Watch-outs
- Very low yield (~0.55%) and flat, decade-old payout
- Revenue shrinking; growth reliant on cost cuts
- Standalone OCF fell 73%; receivables up 50%
- Large idle cash could weigh on ROE
Net: this is a balance-sheet-strong small-cap where the dividend is a token of shareholder friendliness rather than a reason to own the stock. Income seekers will find far more yield elsewhere; the Mindteck thesis, if any, rests on earnings quality, cash and a potential capital-allocation catalyst — each investor should weigh that for themselves.
Frequently Asked Questions
What dividend has Mindteck (India) announced for FY2025-26?
What is the Mindteck dividend yield?
What is the record date for the Mindteck dividend?
What is the ex-dividend date?
When will the Mindteck dividend be paid?
Who is eligible to receive the dividend?
How is the Mindteck dividend taxed?
Is the Mindteck dividend sustainable?
What is Mindteck’s dividend history?
Why did net profit rise when revenue fell in FY26?
How much of the dividend goes to the promoters?
What should investors monitor after this dividend?
Is Mindteck a good dividend stock for income?
Disclaimer
This article is for informational and educational purposes only and does not constitute investment, financial, legal or tax advice, nor a recommendation to buy, sell or hold any security. ShareBazaar Online is not a SEBI-registered investment adviser. Figures are drawn from Mindteck’s exchange filings dated 19 May 2026, Screener.in, NSE/BSE and third-party aggregators, and may contain errors or become outdated; all price-dependent figures (yield, market cap, P/E) change with the live market price and must be re-verified before any decision. Dividend payment remains subject to shareholder approval at the AGM. Investments in securities are subject to market risks; read all related documents carefully. Please consult a SEBI-registered adviser and a qualified tax professional before investing. ShareBazaar Online and its authors accept no liability for any loss arising from the use of this content.