
Dividend Snapshot
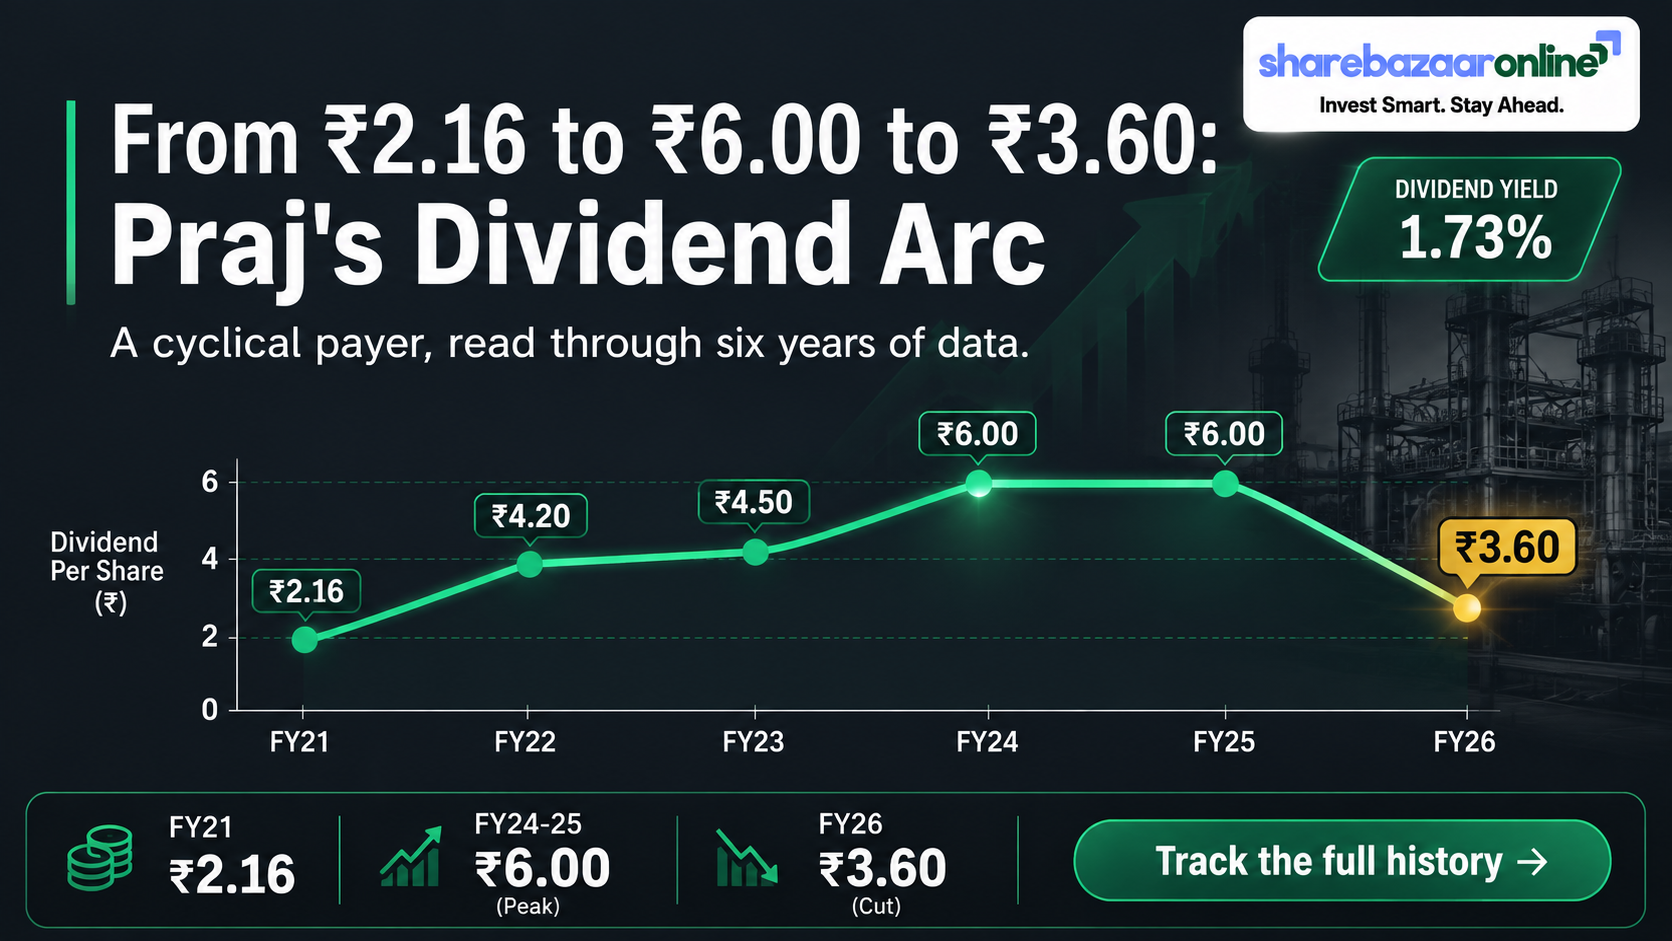
Praj Industries Limited (NSE: PRAJIND, BSE: 522205) has recommended a final dividend of ₹3.60 per equity share for the financial year ended 31 March 2026, equal to 180% of the ₹2 face value. On the current market price of about ₹330, this works out to a modest dividend yield of roughly 1.09%. The headline most aggregators miss: this is a 40% cut from last year’s ₹6.00 payout, declared in a year when consolidated profit fell almost 90%.
All yield figures are price-dependent and move as the stock price changes. Face value ₹2. Consolidated financials used unless stated. Dividend is subject to shareholder approval at the 40th AGM.
Dividend Announcement Summary
At its Board Meeting held on 28 May 2026 (10:30 a.m. to 4:00 p.m.), the Board of Praj Industries recommended a final dividend of ₹3.60 per equity share (180% of face value of ₹2) for the year ended 31 March 2026. The dividend is subject to approval by shareholders at the ensuing Annual General Meeting and, once approved, will be paid within 30 days of that approval.
What the filing confirmed
- Final dividend of ₹3.60/share for FY 2025-26.
- Payment within 30 days of AGM approval.
- Re-appointment of Ms. Rujuta Jagtap as Independent Director (21 Aug 2026 to 20 Aug 2029).
- Appointment of Internal Auditors (Khare Deshmukh & Co.) and Cost Auditors (Dhananjay V. Joshi & Associates) for FY 2026-27.
The context the wire missed
The “180%” headline sounds large, but it is calculated on the tiny ₹2 face value, not on the market price. In cash terms the payout was cut 40% (from ₹6.00 to ₹3.60) because FY26 was a weak earnings year — consolidated net profit collapsed from ₹219 Cr to about ₹24 Cr.
Key Dates Timeline
Ex-date aligns with the record date under India’s T+1 settlement and should be confirmed against the final NSE/BSE corporate-action circular. Because the record date of 6 August 2026 has already passed, eligibility for this dividend is now closed; buyers after the ex-date will not receive this payout.
Dividend Yield Analysis
Dividend yield tells you the cash return you earn relative to the price you pay. For Praj Industries the yield is low, whichever price you use:
Yield reality check
Praj is not a high-yield stock. The “180%” figure refers to face value, not price. At around 1.1%, the yield is below a typical liquid-fund or savings return — Praj is owned for its clean-energy and bioprocess growth story, not for income. The yield looks “stable” only because the share price has also fallen sharply (down roughly a third over the year), partly offsetting the dividend cut.
Dividend History Analysis
| Financial Year | Dividend Per Share | On ₹2 Face Value | Trend |
|---|---|---|---|
| FY 2025-26 | ₹3.60 | 180% | Cut (−40%) |
| FY 2024-25 | ₹6.00 | 300% | Flat |
| FY 2023-24 | ₹6.00 | 300% | Up |
| FY 2022-23 | ₹4.50 | 225% | Up |
| FY 2021-22 | ₹4.20 | 210% | Up |
| FY 2020-21 | ₹2.16 | 108% | Up |
| FY 2019-20 | ₹2.70 | 135% | Incl. special |
What the record tells us
Praj had built a rising dividend track through FY25 — from ₹2.16 in FY21 to a peak of ₹6.00 in FY24 and FY25 (a compound growth of roughly 29% a year over that stretch). The FY26 reduction to ₹3.60 breaks that streak. Based on this pattern — steady rises followed by a profit-linked cut — Praj is best classified as a cyclical dividend payer: it pays every year, but the amount tracks the earnings cycle rather than growing in a straight line. Historical per-share figures are cross-referenced across public aggregators; older years (pre-FY21) also included occasional interim/special components.
Financial Performance Analysis
| Consolidated (₹ Cr) | FY24 | FY25 | FY26 |
|---|---|---|---|
| Revenue | 3,466 | 3,228 | 3,168 |
| Operating Profit | 372 | 314 | 155 |
| Operating Margin | 11% | 10% | 4.9% |
| Net Profit | 283 | 219 | 24 |
| EPS (₹) | 15.42 | 11.91 | 1.30 |
Operating leverage worked in reverse
Revenue fell only 1.9%, yet operating profit dropped 50.6% and net profit fell 89.1%. The reason is margin compression: operating margin nearly halved, from 10% to 4.9%. Management attributed this to longer order-conversion cycles, cost escalations and raw-material volatility. Higher depreciation (₹86 Cr to ₹106 Cr as GenX and R&D assets came on stream) and interest, plus an unusually high 52% effective tax rate, magnified the fall to the bottom line.
Standalone vs consolidated: the hidden split
The parent company is far healthier than the group. Standalone net profit was about ₹120.5 Cr (EPS ~₹6.56), against consolidated profit of only ₹23.8 Cr. The roughly ₹97 Cr gap reflects losses and investment spend at subsidiaries and overseas/GenX operations. Crucially, dividends are paid out of the standalone entity — where a ₹66 Cr payout is comfortably below ₹120.5 Cr of standalone profit.
Cash Flow Analysis
Reported profit is an opinion; cash is a fact — and here cash tells a more reassuring story than the profit line. Despite the earnings collapse, FY26 operating cash flow was strong at about ₹200 Cr (up from just ₹43 Cr in FY25) and free cash flow was around ₹157 Cr. The reason: heavy depreciation is a non-cash charge that is added back, and the cash-conversion cycle turned negative (−8 days) as working capital released cash.
How is the dividend funded?
This dividend is funded from current-year cash generation, not from borrowings or asset sales. Free cash flow of ~₹157 Cr covers the ~₹66 Cr payout about 2.4 times over, and operating cash flow covers it ~3 times. So while the dividend is not covered by consolidated accounting profit, it is well covered by cash — an important distinction retail readers should understand.
Balance Sheet Strength
A lightly-geared balance sheet
Praj remains effectively net-cash: its investment book of ~₹418 Cr comfortably exceeds gross debt of ~₹173 Cr. That gives it room to keep paying dividends even through a weak earnings year. One watch-point: consolidated reserves dipped (from ~₹1,345 Cr to ~₹1,272 Cr) because the prior-year ₹6.00 dividend paid out during FY26 exceeded the year’s consolidated profit — a reminder that repeated above-earnings payouts slowly draw down the reserve buffer.
Dividend Sustainability Analysis
| Coverage Test | Result | Verdict |
|---|---|---|
| Earnings coverage (consolidated) | 0.36x | Fail |
| Earnings coverage (standalone) | 1.82x | Pass |
| Free cash flow coverage | 2.37x | Pass |
| Operating cash flow coverage | 3.02x | Pass |
| Liquidity / investments coverage | 6.32x | Pass |
Verdict: Moderately Sustainable
On a consolidated payout of ~278% the dividend fails the accounting-profit test — the group paid out nearly three times what it earned. But on standalone earnings (~55% payout), cash flow and liquidity, the current ₹3.60 is affordable. The key condition is that earnings recover: if consolidated profit stays depressed for another year or two, further dividend trimming or continued reserve draw-down becomes likely. We therefore classify sustainability as Moderately Sustainable — safe from cash today, but dependent on an earnings turnaround to stay that way.
Peer Comparison
| Company | Div. Yield | Payout | ROE | ROCE |
|---|---|---|---|---|
| Praj Industries | ~1.09% | 278% cons / 55% standalone | 1.5% (3Y ~12%) | 6.1% |
| Thermax | ~0.4% | ~25% | Not verified | Not verified |
| Triveni Turbine | ~0.78% | ~37% | ~29% | ~32% |
| Va Tech Wabag | ~0.33% | ~8% | Not verified | Not verified |
Where Praj sits
Across the capital-goods and process-engineering space, dividend yields are uniformly low — these are growth-and-order-book stocks, not income stocks. Praj’s ~1.1% yield is actually a touch higher than Thermax, Triveni Turbine and Va Tech Wabag, but that partly reflects Praj’s weaker recent price performance. Its FY26 return ratios (ROE ~1.5%, ROCE ~6%) are the lowest in this set because of the profit collapse; in normal years Praj’s ROCE has run in the high-20s to low-30s. Peer cells marked “Not verified” were not independently confirmed from primary filings and are left unstated rather than estimated.
Promoter Impact Analysis
Who gets the ₹66 Cr
Of the ~₹66.2 Cr total payout, promoters receive about ₹21.7 Cr (32.81% stake), while the public shareholders — the single largest block at 35.34% — collect roughly ₹23.4 Cr. Institutions (FIIs + DIIs, ~31.8%) take the remainder. Because Praj’s promoter holding is relatively low (under 33%), the majority of every dividend rupee flows to non-promoter shareholders — a genuinely broad-based distribution rather than a promoter-skewed one.
Taxation Analysis
Since the abolition of the Dividend Distribution Tax, dividends in India are taxable in the hands of the investor at their income-tax slab rate. The company also deducts TDS at 10% under Section 194 if the total dividend paid to a resident shareholder in a financial year exceeds ₹5,000 (20% if PAN is not furnished). Any TDS deducted can be adjusted against final tax liability when filing returns.
Worked example (resident, 30% slab)
Case A — 1,000 shares
Case B — 2,000 shares (crosses TDS limit)
Illustrative only, based on current dividend-tax rules for resident individuals; actual tax depends on your personal slab and total income. Not tax advice — consult a qualified professional.
Key Risks
- Earnings volatility: Consolidated net profit fell ~89% in FY26 on margin compression; a further weak year could pressure future payouts.
- Margin pressure: Operating margin nearly halved to 4.9% on cost escalations and raw-material volatility; contract repricing takes time to flow through.
- Order-conversion cycle: Longer conversion of the sizeable order backlog (~₹4,300 Cr) delays revenue recognition and profit.
- Subsidiary / GenX drag: The ~₹97 Cr gap between standalone and consolidated profit shows overseas and new-business units are still loss-making or investment-heavy.
- Policy dependence: The core 1G-ethanol and bio-energy business is sensitive to government ethanol-blending policy and feedstock economics.
- Above-earnings payout: A consolidated payout of ~278% slowly draws down reserves if earnings do not recover.
What To Monitor
- Margin recovery: Watch whether operating margin rebuilds toward its historical 10-11% range in FY27.
- Order intake & backlog conversion: New wins (e.g. the recent US$52 million GenX data-centre supply agreement) and the pace at which backlog turns into revenue.
- Standalone vs consolidated gap: A narrowing gap would signal subsidiaries and GenX turning profitable.
- Ethanol / SAF policy: Government blending mandates and Sustainable Aviation Fuel progress that drive the order pipeline.
- Free cash flow trend: Whether FCF stays comfortably above the dividend (it did in FY26 at ~2.4x).
- Reserve movement & next dividend: Direction of consolidated reserves and the FY27 dividend as a read on management’s confidence.
Conclusion
Praj Industries’ FY26 final dividend of ₹3.60 per share is a 40% cut that mirrors a difficult year in which consolidated profit collapsed on margin pressure and subsidiary drag. Yet the picture is more nuanced than the profit line suggests: standalone earnings, strong free cash flow (~2.4x cover) and a net-cash balance sheet mean the payout is affordable today, even though it is not covered by consolidated accounting profit. The yield at ~1.1% confirms Praj is owned for its clean-energy and bioprocess growth optionality, not for income. The real question for shareholders is not this year’s dividend but whether margins and consolidated earnings recover in FY27 — that, more than anything, will decide the direction of future payouts. This article presents the positives, the negatives and the risks so you can form your own view; it does not make any buy, sell or hold recommendation.
Frequently Asked Questions
What dividend has Praj Industries announced for FY 2025-26?
What is the Praj Industries dividend yield?
What is the record date for the Praj Industries dividend?
What is the ex-dividend date?
When will the Praj Industries dividend be paid?
Who is eligible for the dividend?
How is the Praj Industries dividend taxed?
Is the Praj Industries dividend sustainable?
Why did Praj cut its dividend this year?
What is Praj Industries’ dividend history?
Does the “180%” dividend mean a high return?
What should investors monitor going forward?
Disclaimer
This article is for informational and educational purposes only and does not constitute investment, financial, legal or tax advice, nor a recommendation to buy, sell or hold any security. ShareBazaar Online is not a SEBI-registered investment adviser. Figures are drawn from the company’s exchange filing and publicly available sources believed to be reliable; some external data points (such as current market price, announcement-date price and inferred ex-date) are price-sensitive or subject to confirmation and may change. All dividend yield figures depend on the live market price and should be re-verified before acting. The dividend is subject to shareholder approval at the AGM. Please conduct your own research and consult a qualified, registered financial or tax adviser before making any investment decision. Investments in securities are subject to market risks.