
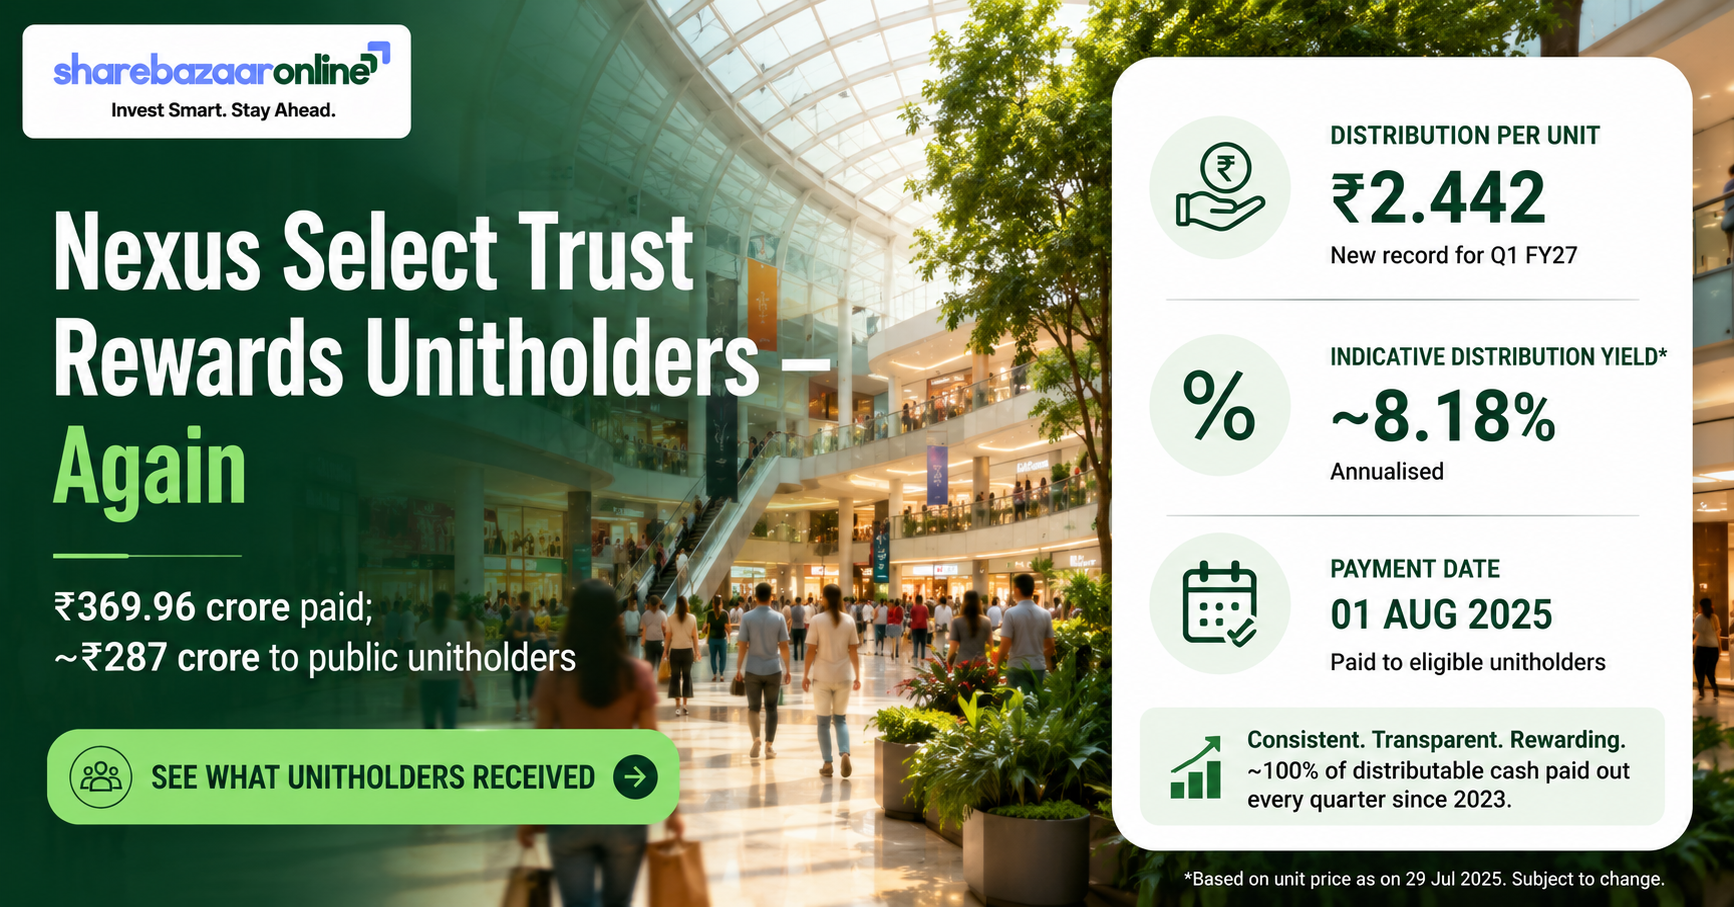
Distribution Snapshot
Nexus Select Trust — India's first and only listed retail (shopping-mall) REIT, sponsored by a Blackstone affiliate — has declared its Q1 FY27 distribution for the quarter ended June 30, 2026. Read one number carefully: this is a REIT distribution, not a company dividend. It arrives in four separate tax buckets (interest, dividend, other income and a return of your own capital), and that structure changes both the real yield and the tax you actually pay. We break down all four below.
Distribution Per Unit (Q1 FY27)
₹2.442
Up ~10% vs ₹2.230 in Q1 FY26 · highest-ever quarterly DPU
Total Distribution Outflow
₹369.96 Cr
Across ~151.5 crore units outstanding
Trailing 12-Month Distribution Yield
~5.50%
TTM DPU ₹9.29 ÷ CMP ₹169
Distribution Type
Quarterly REIT Distribution
Interest + Dividend + Other income + Return of capital
The one-line takeaway: aggregator screens show a "dividend yield" of just ~1.44% for Nexus Select Trust. That figure captures only the dividend slice of the payout. The real distribution yield is ~5.5% — roughly 3.8× higher. If you judge a REIT by the "dividend yield" field alone, you will badly under-read what it actually pays.
Distribution Announcement Summary
The Board of Nexus Select Mall Management Private Limited (the Manager) approved the unaudited standalone and consolidated results for the quarter ended June 30, 2026 at its meeting on August 03, 2026, and declared a total distribution of ₹369.96 crore (₹2.442 per unit). The auditor's limited review report was noted and was unmodified.
The distribution was made under Regulation 51 of SEBI (LODR) Regulations, 2015 and Regulation 23(5) of the SEBI (REIT) Regulations, 2014. Management reported Q1 FY27 net operating income (NOI) up 11% year-on-year to ₹510 crore, portfolio consumption up 17% to ~₹3,850 crore, and stated it maintained its track record of a ~100% payout of net distributable cash flow (NDCF). The Manager also disclosed it has identified eight malls for potential acquisition (no sizes, locations or timelines given).
How the ₹2.442 per unit is built (this is the part most reports skip)
| Component | ₹/Unit | ₹ Crore | % of Payout | How it is taxed |
|---|---|---|---|---|
| Interest (less taxes) | 1.041 | 157.71 | 42.6% | Taxable at slab; 10% TDS |
| Dividend | 0.861 | 130.44 | 35.3% | Slab if SPV opted 115BAA |
| Other income | 0.003 | 0.46 | 0.1% | Taxable at slab |
| SPV debt repayment (return of capital) | 0.537 | 81.35 | 22.0% | Not taxed now; reduces cost base |
| Total distribution | 2.442 | 369.96 | 100% | Mixed (see Taxation) |
Component split sourced from the Trust's exchange disclosure dated August 3, 2026. Note the striking fact: 22% of this "distribution" is a repayment of your own capital (via SPV-level debt repayment), not fresh income.
Key Dates Timeline
Announcement / Board Meeting
August 03, 2026
Record Date
August 06, 2026
Ex-Date (NSE/BSE)
Not Disclosed by Company
Under T+1, typically same as record date; verify against the exchange corporate-action circular
Payment Date
On or before August 13, 2026
Both the record date (August 6) and the payment window (on or before August 13) have already passed relative to publication. Eligibility was fixed for unitholders on the register as of the August 6, 2026 record date; unitholders who bought on or after the ex-date did not receive this particular distribution.
Distribution Yield Analysis
For a REIT, "yield" only makes sense on the full distribution and the market price — never on a face value or on the dividend slice alone. At a current market price of ₹169 (Screener, August 13, 2026 close):
Trailing 12-Month Yield
5.50%
TTM DPU ₹9.29 ÷ ₹169
Annualised (Q1 FY27 × 4)
5.78%
₹9.77 ÷ ₹169 (run-rate)
FY26 (Actual) Yield
5.37%
FY26 DPU ₹9.081 ÷ ₹169
Aggregator "Dividend Yield"
1.44%
Dividend component only — misleading for a REIT
Yield reality check — why the yield has actually fallen
Nexus has raised its DPU every year (FY26 DPU ₹9.081, up 9%), yet the yield on today's price is lower than the ~7% brokerages modelled a year ago. The reason is not a weaker payout — it is a stronger unit price. The units traded in a 52-week band of ₹143–₹192 and are up ~12% over one year, which mechanically compresses the yield. A rising, not falling, price is behind the "lower" yield — the healthy version of yield compression.
Distribution History Analysis
| Quarter | DPU (₹) | Note |
|---|---|---|
| Q1 FY26 (Jun-25) | 2.230 | 100% NDCF payout |
| Q2 FY26 (Sep-25) | 2.198 | +10% YoY |
| Q3 FY26 (Dec-25) | 2.367 | Record at the time |
| Q4 FY26 (Mar-26) | 2.286 | ₹346.33 Cr |
| Q1 FY27 (Jun-26) | 2.442 | New highest-ever |
Full-year DPU: FY24 ₹8.40 → FY25 ~₹8.20–₹8.40 → FY26 ₹9.081 (+9%). Cumulatively the Trust has distributed over ₹15–16 per unit since its May 2023 listing, with a stated total return above 50% since IPO.
Payer classification: Consistent Payer
Since listing in May 2023, Nexus has paid a distribution every single quarter with a 100% NDCF payout record and a rising DPU trajectory. There have been no cuts and no suspensions. The one nuance a retail investor should hold onto: consistency of the headline DPU masks a shifting internal mix — the pure "dividend" slice has drifted down (from ₹1.299 in Q1 FY26 to ₹0.861 now) while interest and capital-return slices have risen.
Financial Performance Analysis
| Consolidated (₹ Cr) | FY24 | FY25 | FY26 |
|---|---|---|---|
| Revenue | 1,916 | 2,283 | 2,568 |
| Operating Profit | 1,284 | 1,552 | 1,733 |
| Operating Margin | 67% | 68% | 67% |
| Net Profit (PAT) | 599 | 483 | 403 |
| EPS (₹) | 3.95 | 3.19 | 2.66 |
Source: Screener.in consolidated. TTM revenue ₹2,635 Cr, TTM PAT ₹440 Cr.
Operating leverage: revenue up, profit down — why?
Revenue grew ~12% in FY26 and operating profit rose to ₹1,733 Cr, yet reported PAT fell ~16% to ₹403 Cr. This is not operational weakness. Two structural items sit between operating profit and PAT: (1) depreciation of ₹620 Cr on investment property (a non-cash charge), and (2) a one-time tax hit of ₹122.81 Cr from the Minimum Alternate Tax (MAT) amendment in the Finance Act, 2026. The MAT charge single-handedly drove the profit decline — and crushed the Mar-26 quarter to just ₹12 Cr PAT.
Q1 FY27 momentum
The June-26 quarter reset the trend: sales ₹681 Cr, operating margin back to 69%, and PAT recovered to ₹157 Cr (EPS ₹1.03). NOI rose 11% to ₹510 Cr on a 17% jump in mall consumption to ~₹3,850 Cr, with leased occupancy around 97%.
Cash Flow Analysis
For a REIT, cash flow is the real story — not accounting profit. Depreciation depresses PAT but is not a cash outflow, so a REIT can (and must) distribute far more than its net profit. Nexus distributes out of net distributable cash flow (NDCF), and the cash statement backs this up.
Operating Cash Flow (FY26)
₹1,662 Cr
CFO/OP ratio ~104% — profits convert fully to cash
Free Cash Flow (FY26)
₹1,302 Cr
After capex; before acquisition outflows
Net Operating Income (FY26)
~₹1,900 Cr
+13% YoY
FY26 Distribution Outflow
~₹1,376 Cr
DPU ₹9.081 × ~151.5 Cr units
Is the distribution genuinely cash-funded?
Yes, from operations — but with a caveat. Operating cash flow of ₹1,662 Cr comfortably covers the ~₹1,376 Cr paid out (1.21×). However, free cash flow of ₹1,302 Cr is fractionally below the payout (~0.95×) once maintenance capex is netted. The Trust bridges this by design: about 22% of each distribution is a return of capital (SPV-level debt repayment), which is funded from the balance sheet, not from current-year surplus. That is normal and legal for a REIT, but it means not every rupee you receive is fresh income — part is your own invested capital coming back.
Balance Sheet Strength
Net Asset Value (NAV) per Unit
₹164
31-Mar-2026; CMP ₹169 = ~3% premium to NAV
Gross Asset Value (GAV)
~₹30,558 Cr
19 consumption centres + offices + hotels
Net Debt / LTV
~₹5,400 Cr / 18.0%
Well under SEBI's 49% ceiling — large headroom
Weighted Avg. Cost of Debt
7.3%
Down ~60 bps YoY; IFC-anchored green bond raised
The balance sheet is a clear strength. At an 18% loan-to-value, Nexus carries roughly ₹15,000+ crore of unused debt headroom before hitting the regulatory cap — the fuel behind its stated acquisition pipeline of eight malls. Falling borrowing costs (7.3%) and a NAV that has tracked the unit price both point to conservative gearing. Reserves show as negative on Screener (–₹1,885 Cr), which looks alarming but is an accounting artefact of a REIT structure distributing more than book profit — it is not distress; the asset base is carried at ₹30,000+ crore of fair value.
Distribution Sustainability Analysis
The standard four coverage tests need REIT-specific interpretation. Earnings coverage is not a meaningful test here (depreciation is a large non-cash charge), just as free-cash-flow coverage is treated cautiously during an acquisition-led growth phase.
1. NDCF Coverage — PASS
~100% of NDCF paid out every quarter since listing. Meets SEBI's 90% minimum comfortably — but leaves essentially no retained buffer.
2. Operating Cash Flow Coverage — PASS
CFO ₹1,662 Cr vs ~₹1,376 Cr distribution = 1.21×. Operations fund the payout.
3. Free Cash Flow Coverage — MARGINAL
FCF ₹1,302 Cr vs ~₹1,376 Cr = 0.95×. Slightly under 1×; the gap is bridged by the return-of-capital component — acceptable in a growth REIT, but worth monitoring.
4. Earnings Coverage — NOT MEANINGFUL
PAT ₹403 Cr vs distribution ₹1,376 Cr = 0.29× (payout ~341% of PAT). Structural, not a red flag — ₹620 Cr of depreciation is non-cash.
Verdict: Sustainable
On a cash basis the distribution is well-supported: operations cover it 1.2×, leverage is low (18% LTV) and borrowing costs are falling. The two honest caveats: (a) the 100% NDCF payout leaves zero cushion if consumption slows, and (b) roughly a fifth of the payout is return of capital, so the "income" is flattered. Sustainable — provided occupancy and consumption growth hold.
Peer Comparison
| Listed REIT | Asset Type | Approx. Distribution Yield | Approx. Market Cap |
|---|---|---|---|
| Nexus Select Trust | Retail malls | ~5.5% | ~₹25,600 Cr |
| Embassy Office Parks | Offices | ~5.3% | ~₹39,800 Cr |
| Mindspace Business Parks | Offices | ~5%+ | |
| Brookfield India REIT | Offices | ~5–7% | ~₹23,900 Cr |
Peer yields are approximate and price-dependent; blank cells are left intentionally where a figure was not independently verified. Cross-check live before publishing.
Nexus is the only retail-mall REIT among four (soon five) listed Indian REITs; the others are office-focused. Retail REITs typically trade at a slightly lower yield than office peers because mall income is expected to grow faster in a consumption-led economy — the lower yield reflects higher growth expectations, not a weaker payout. Nexus's differentiators: 97% occupancy, contractual rent escalations, turnover-linked rent upside, and an acquisition pipeline. Its structural risk versus offices is direct exposure to discretionary consumer spending.
Promoter / Sponsor Impact Analysis
Sponsor Group Holding (~)
~22.30%
Blackstone affiliate (Wynford Investments) — reduced from IPO levels via block deals
Q1 FY27 Distribution to Sponsor
~₹82.5 Cr
Public unitholders receive ~₹287.5 Cr (77.7%)
Of the ₹369.96 crore paid this quarter, the sponsor group receives roughly ₹82.5 crore and the broad public base of unitholders around ₹287.5 crore. Unlike a typical promoter-controlled company, a Blackstone-sponsored REIT is designed for gradual sponsor sell-down; Blackstone has been trimming its stake over time. Two governance items deserve a flag: (1) the Manager is a related party (Nexus Select Mall Management Pvt Ltd), so acquisition pricing and management fees warrant scrutiny; and (2) one data aggregator reports a high level of sponsor-unit pledging — this figure should be verified directly against the latest shareholding and encumbrance filing before being relied upon, as REIT sponsor-pledge data is often mis-tagged.
Taxation Analysis
REIT taxation is completely different from equity dividend tax, and this is where most retail investors get surprised. Under Section 115UA and Section 194LBA of the Income-tax Act, each of the four components in a REIT distribution is taxed differently:
- Interest (₹1.041/unit): fully taxable at your slab rate; the Trust deducts 10% TDS for residents (Section 194LBA).
- Dividend (₹0.861/unit): taxable at your slab rate because the underlying SPVs have opted for the concessional corporate-tax regime (Section 115BAA); 10% TDS applies. (If an SPV had stayed in the old regime, its dividend would be exempt — verify SPV election.)
- Other income (₹0.003/unit): taxable at slab.
- Return of capital / SPV debt repayment (₹0.537/unit): not taxed on receipt. Post the Finance Act 2023 rules, it reduces your cost of acquisition — tax is deferred to when you sell (as capital gains), and only the portion that eventually exceeds your issue price becomes taxable as income from other sources.
Worked example — 1,000 units, this Q1 FY27 distribution, 30% slab investor
| Gross distribution (1,000 × ₹2.442) | ₹2,442 |
| — Interest (taxable now) | ₹1,041 |
| — Dividend (taxable now) | ₹861 |
| — Other income (taxable now) | ₹3 |
| — Return of capital (tax-deferred) | ₹537 |
| Taxable this year | ₹1,905 |
| Tax @ 31.2% (30% + 4% cess) | ₹594 |
| TDS deducted (10% on interest + dividend) | ₹190 |
| Net in-hand (this distribution) | ₹1,848 |
Surcharge (if applicable at higher incomes) is ignored for simplicity. On an annualised basis (~₹9.77/unit), the pre-tax yield of ~5.78% translates to roughly a ~4.4% post-tax yield for a top-slab investor — before accounting for the deferred tax on the return-of-capital slice. Lower-slab investors keep more. This is not tax advice; confirm your position with a qualified advisor.
Key Risks
- Consumption-cycle exposure: as India's only retail REIT, distributions ride directly on discretionary mall spending. A consumption slowdown hits turnover-linked rents and re-leasing spreads first.
- Zero payout buffer: a ~100% NDCF payout means any dip in NOI flows straight into a lower DPU — there is no retained cushion to smooth a weak quarter.
- Return-of-capital flatters the yield: ~22% of the current distribution is repayment of your own capital, not fresh income. The "true income" yield is lower than the headline distribution yield.
- Tax and regulatory change: the FY26 MAT amendment cost the Trust a one-time ₹122.81 Cr. REIT taxation has changed repeatedly (2020 dividend rules, 2023 return-of-capital rules) and remains a policy variable.
- Interest-rate sensitivity: REIT unit prices move inversely to bond yields. A rise in rates makes the ~5.5% distribution relatively less attractive and can pressure the unit price.
- Acquisition and related-party risk: growth depends on buying eight-plus malls via a related-party Manager; over-paying or integration slippage would dilute per-unit distributions.
What To Monitor
- Quarterly DPU trajectory and mix: is DPU still rising, and is the dividend + interest (real income) share holding up versus the return-of-capital slice?
- Same-store consumption & tenant sales growth: the leading indicator for turnover rents — watch whether the ~15–17% growth rate sustains.
- Leased and trading occupancy: currently ~97%; any slippage signals weakening demand for mall space.
- Loan-to-value and cost of debt: LTV is 18% with room to gear up for acquisitions; track how new debt affects the 7.3% average cost.
- Acquisition execution: pricing, cap rates and NDCF accretion of the eight-mall pipeline — accretive deals lift DPU, expensive ones dilute it.
- Interest-rate direction: the RBI policy path directly influences REIT valuations and relative yield attractiveness.
Conclusion
Nexus Select Trust's Q1 FY27 distribution of ₹2.442 per unit (₹369.96 crore) is a new quarterly high and extends an unbroken record of quarterly, ~100%-NDCF payouts since its 2023 listing. Operationally the Trust is firing well: NOI up 11%, consumption up 17%, occupancy near 97%, leverage low at 18% LTV, and borrowing costs falling.
The nuances a careful investor should carry away are three. First, the real distribution yield is ~5.5% — nearly four times the ~1.44% "dividend yield" that generic screens display. Second, about a fifth of the payout is a return of your own capital, so the true income component is smaller than the headline. Third, the tax treatment splits four ways, and a top-slab investor keeps roughly 4.4% post-tax. The payout looks sustainable on cash flow, with the honest caveats of a zero retained buffer and direct exposure to the consumption cycle.
This is an informational analysis presenting positives, negatives and risks in parallel. It is not a recommendation to buy, sell or hold. Please make your own assessment or consult a SEBI-registered adviser.
Frequently Asked Questions
What distribution has Nexus Select Trust announced for Q1 FY27?
What is the actual distribution yield of Nexus Select Trust?
What was the record date for the Q1 FY27 distribution?
What is the ex-date?
When was the distribution paid?
Who was eligible to receive it?
Why is a REIT distribution different from a company dividend?
How is the Nexus Select Trust distribution taxed?
Is the distribution sustainable?
Why did Nexus Select Trust's net profit fall in FY26 even though revenue rose?
What is the distribution history of Nexus Select Trust?
How does Nexus compare with Embassy, Mindspace and Brookfield REITs?
What should investors monitor going forward?
What is the NAV of Nexus Select Trust and is it trading at a premium?
Disclaimer
ShareBazaar Online is not a SEBI-registered investment adviser or research analyst. This article is for informational and educational purposes only and does not constitute investment, tax or legal advice, nor a recommendation to buy, sell or hold any security or unit. Figures are drawn from exchange filings, the Trust's disclosures and third-party data sources (including Screener.in) believed to be reliable but not independently guaranteed; several figures — including the current market price, ex-date and any sponsor-pledge data — are price- or filing-dependent and must be re-verified before any decision. All distribution yields are sensitive to the prevailing market price. REIT taxation depends on individual circumstances and SPV-level tax elections; consult a qualified tax professional and a SEBI-registered adviser before acting. Investments in REIT units are subject to market risk, including possible loss of principal.