
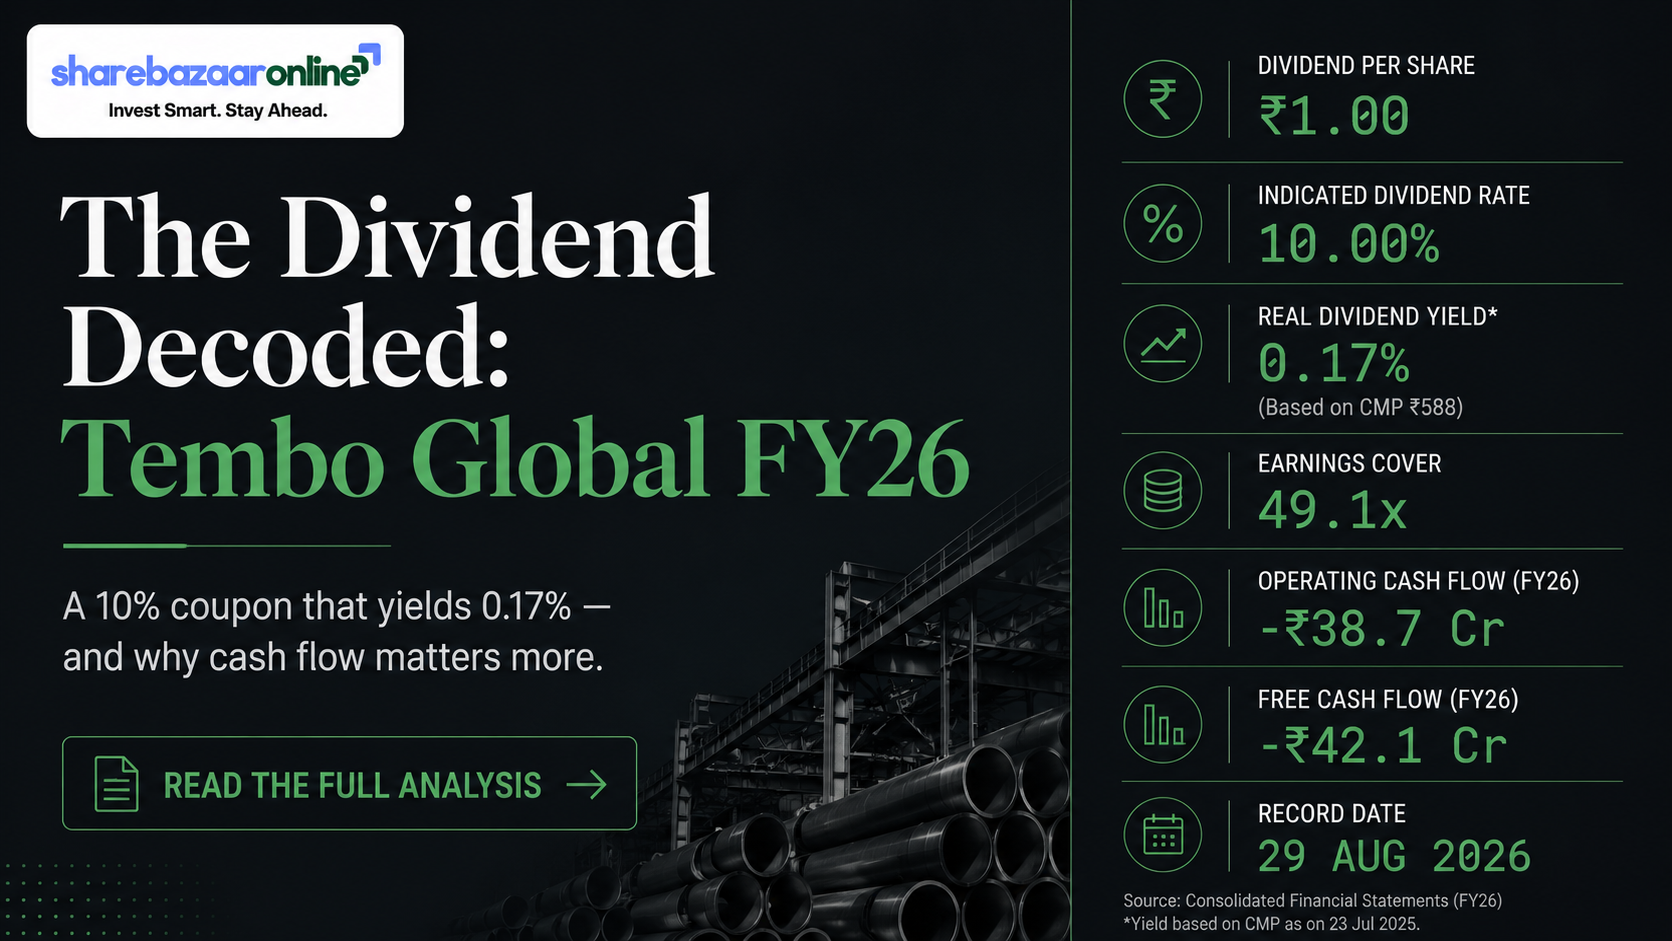
1. Dividend Snapshot
Dividend Per Share
₹1.00 (FV ₹10)
Equivalent to 10% on face value; ₹0.10 per share after the 10:1 split.
Real Dividend Yield
~0.17%
Against the market price — not the face-value coupon.
Dividend Type
Interim
First interim dividend for FY2025-26.
Record Date
16 Jan 2026
Payment on or before 10 Feb 2026.
The one-line takeaway: the earnings can pay this dividend roughly 49 times over, yet the company's operating and free cash flow were both negative in FY26. The payout is trivially small (about ₹1.5 crore) and therefore comfortably affordable from cash raised in the market — but it is not being generated by the operating business. That distinction is the heart of this report.
2. Dividend Announcement Summary
At its meeting on 12 January 2026, the board of Tembo Global Industries approved a first interim dividend of Re 1.00 per equity share of face value ₹10 for the financial year 2025-26. The company fixed 16 January 2026 as the record date and stated the dividend would be paid to eligible shareholders on or before 10 February 2026.
The same board meeting carried governance changes: the appointment of an additional independent director for a one-year term, a new company secretary and compliance officer, and the resignation of the prior compliance officer. Investors reading this dividend should read it alongside that board churn rather than in isolation.
Because the dividend was declared as an interim dividend by the board, it did not require a separate shareholder vote at an AGM to take effect — interim dividends are paid under the board's own authority and later noted by members. This is a factual distinction from a "final dividend", which is recommended by the board and then approved at the AGM.
3. Key Dates Timeline
| Event | Date | Status |
|---|---|---|
| Board meeting / dividend declaration | 12 Jan 2026 | Completed |
| Ex-date (T+1 regime = record date) | 16 Jan 2026 | Completed |
| Record date | 16 Jan 2026 | Completed |
| Payment (on or before) | 10 Feb 2026 | Completed |
| 10:1 stock split record date (separate action) | 14 Aug 2026 | Live corporate action |
Under India's T+1 settlement, the ex-date and record date coincide. The 10:1 split is a distinct corporate action from the dividend and is included only for context.
4. Dividend Yield Analysis
A "10% dividend" sounds generous until you realise the 10% is measured on the ₹10 face value, not on what you pay for the share. This is the classic face-value yield illusion, and Tembo Global is a textbook case.
Face-value coupon
10.0%
₹1 ÷ ₹10 face value
Real yield at announcement
~0.17%
₹1 ÷ ~₹585 price (approx)
Current yield
~0.16–0.17%
₹0.10 post-split ÷ ~₹60 price
Gap: coupon vs reality
~59x
The coupon overstates the real yield by roughly sixty times.
A yield near 0.17% means that on a ₹1,00,000 holding, the annual dividend is roughly ₹170 before tax. Tembo Global is not, on any reasonable definition, a dividend-income stock; the payout is a token gesture attached to a high-growth, cash-hungry engineering business.
5. Dividend History Analysis
The Tembo Global Industries dividend history (per-share amounts as historically declared on ₹10 face value, sourced from aggregators and not individually re-verified against each filing):
| Approx. declaration / ex-period | Dividend / share | Type |
|---|---|---|
| Jan 2026 (FY26) | ₹1.00 | Interim |
| Feb 2025 (FY25) | ₹1.00 | Interim |
| Sep 2024 | ₹1.00 | Interim |
| Jul 2024 | ₹1.00 | Dividend |
| Dec 2022 | ₹1.20 | Dividend |
| Nov 2021 | ₹0.93 | Dividend |
| Dec 2020 | ₹0.70 | Dividend |
| Sep 2019 | ₹0.23 | Dividend |
Consistency: the company has paid a small dividend in most recent years, so it is broadly a consistent token payer rather than a growth-dividend or high-yield payer. Screener records FY2021-22 and FY2022-23 as zero-payout years and shows dividend payout ratios that are very low and erratic (32%, 40%, 0%, 0%, 8%, 3%, ~0% across FY20–FY26).
Trend: the per-share amount has hovered around ₹0.70–₹1.20 for years even as revenue and profit multiplied. In other words, the dividend has not scaled with earnings — retained capital has been redirected into growth, capex and working capital instead.
Classification: Consistent (token) payer. There is no evidence of a special dividend or a formal dividend suspension in the recent record, though the two nil years should be noted.
6. Financial Performance Analysis
On the income statement, Tembo Global Industries has been a genuine growth story. Consolidated figures (₹ crore, Screener):
| Metric | FY24 | FY25 | FY26 | Growth FY25→FY26 |
|---|---|---|---|---|
| Revenue | 439 | 744 | 1,090 | +46.5% |
| Operating profit | 25 | 92 | 142 | +54.3% |
| OPM % | 6% | 12.4% | 13.0% | +60 bps |
| Net profit | 14 | 51 | 98 | +92.2% |
| EPS (split-adjusted, ₹) | 1.28 | 3.29 | 4.92 | — |
Positive operating leverage: revenue rose about 46.5%, operating profit about 54.3%, and net profit about 92.2%. When profit grows faster than revenue and revenue grows faster than costs, that is operating leverage working in the company's favour, helped by a modest margin expansion from roughly 12.4% to 13.0%.
Earnings-quality caveat: FY26 profit before tax included about ₹19 crore of other income — roughly 14.6% of PBT. Other income was near zero the year before, so a meaningful slice of the profit jump is non-operating. A reader should separate the durable operating engine from this one-off lift.
Note: one wire source reports FY26 net profit at ₹98.2 crore and FY25 at ₹54.7 crore (+79.7%); Screener shows ₹98 crore and ₹51 crore (+92.2%). We use Screener consolidated and flag the small difference.
7. Cash Flow Analysis
This is where the story turns. Reported profit is an accounting opinion; cash is fact — and Tembo Global's cash statement tells a very different story from its profit line.
| Cash flow (₹ Cr, consolidated) | FY24 | FY25 | FY26 |
|---|---|---|---|
| Operating cash flow (OCF) | +17 | −77 | −90 |
| Investing cash flow | −32 | −207 | −85 |
| Financing cash flow | +15 | +287 | +258 |
| Free cash flow (FCF) | +9 | −157 | −187 |
The headline: net profit was positive (₹98 crore) while operating cash flow was negative (₹−90 crore) in FY26 — and it was negative in FY25 too. Free cash flow was roughly ₹−187 crore. The gap is funded almost entirely by financing inflows of about ₹258 crore, i.e. fresh borrowings and equity/warrant issuance.
Why the divergence? Working capital has ballooned. Screener shows working capital days rising from 10 to 132, debtor days from about 54 to 78, and inventory days from about 78 to 141. Rapid revenue growth is being financed by locking cash into receivables and inventory, so profit on paper is not converting into cash in the bank.
How is the dividend funded? Because operating and free cash flow are both negative, the ₹1.5 crore paid out as dividend is, in cash terms, funded from raised capital — borrowings and equity — not from current operating cash. The amount is tiny relative to the ₹250–300 crore raised, so affordability is not in question; cash origin is the honest concern.
8. Balance Sheet Strength
Borrowings FY25 → FY26
₹258 Cr → ₹386 Cr
Up about 50% in a single year.
Net worth (FY26)
~₹453 Cr
Equity ₹19 Cr + reserves ₹434 Cr (swelled by capital raises).
Debt-to-equity (FY26)
~0.85
Computed on Screener net worth; some services quote ~1.05 on earlier data.
Net debt (Mar-26)
~₹252 Cr
Broadly flat vs ~₹254 Cr a year earlier (aggregator-sourced).
The balance sheet has grown enormously — total assets went from about ₹574 crore to ₹1,306 crore in a year — driven by capex (fixed assets up from ₹26 to ₹118 crore, with ₹68 crore of capital work-in-progress) and a large build-up in current assets. Reserves nearly doubled on the back of equity raising. The company describes itself as debt-carrying but growth-funded; the honest read is that it is a leveraged, capital-consuming expansion, not a self-financing cash machine. That is precisely why a shareholder should not be reassured by the huge earnings coverage of the dividend alone.
9. Dividend Sustainability Analysis
We run four coverage tests. The dividend is symbolic, so it passes on affordability — but fails the tests that matter for cash quality.
| Test | Reading | Verdict |
|---|---|---|
| Earnings coverage (EPS ÷ DPS) | ~49x; payout ~1.6% | Pass |
| Operating cash flow coverage | OCF negative (₹−90 Cr) | Fail |
| Free cash flow coverage | FCF negative (₹−187 Cr) | Fail |
| Cash / liquidity coverage | ₹250–300 Cr raised vs ~₹1.5 Cr outflow | Pass |
Overall classification: Moderately Sustainable — with a caveat. Two of four tests pass. The dividend is easily affordable because it is tiny relative to reserves and freshly raised capital, and earnings cover it many times over. But the operating business is consuming cash, not generating it, so the payout is not funded by operating cash flow. Sustainability here rests on continued access to capital markets and eventual conversion of profit into cash — not on the current cash engine. Negative FCF during a genuine capex build is not automatically damning, but combined with negative OCF and rising working capital, it warrants caution.
10. Peer Comparison
Screener classifies Tembo Global under Industrials → Capital Goods → Industrial Products → Iron & Steel Products, with listed comparators including Gala Precision Engineering and Millworks Technologies. We show Tembo's verified figures; peer cells we could not independently verify are left blank rather than filled with unconfirmed numbers.
| Company | Div. yield | Payout | ROE | ROCE |
|---|---|---|---|---|
| Tembo Global | ~0.16% | ~1.6% | ~27.5% | ~22.8% |
| Gala Precision Engg. | — | — | — | — |
| Millworks Technologies | — | — | — | — |
Sector context: small-cap engineering and industrial-products companies in a growth and capex phase typically pay very low or nil dividends, prioritising reinvestment. Tembo's near-0.16% yield and ~1.6% payout are consistent with that pattern — its distinguishing traits are its strong return ratios (ROE ~27.5%) alongside negative operating cash flow and heavy promoter pledging, not its dividend.
Peer-specific yield, payout and return figures are marked "—" pending desk verification against each company's latest filing.
11. Promoter Impact Analysis
Promoter dividend income
~₹0.56 Cr
At ~36.4% holding on the record date × ~₹1.5 Cr outflow.
Public shareholders' dividend
~₹0.98 Cr
The majority, since promoters now hold a minority stake.
The bigger promoter story is not the dividend — it is the stake. Promoter holding has fallen from about 72.8% (2019–2022) to 55.4% (2023), then to 43.6% (Mar 2025) and 36.4% (Dec 2025), recovering slightly to about 39.0% (Jul 2026). That is a large multi-year dilution, and Screener flags a 3-year fall of about 16 percentage points.
Pledging is a red flag. Screener shows promoters have pledged about 40.6% of their holding. A high pledge level means part of the promoter stake is encumbered against borrowings, which can amplify downside if the share price falls. For a company already running negative operating cash flow, this is a governance item to weigh heavily — far more than the ₹0.56 crore of dividend the promoters received.
Institutional footprint shifted too: FIIs rose to about 8.6% (Dec 2025) from near zero, while retail shareholders number roughly 18,000–19,000 — a retail-heavy register.
12. Taxation Analysis
Since April 2020, dividends in India are taxed in the hands of the shareholder. Key rules a retail investor should know:
- Dividend income is added to your total income and taxed at your applicable slab rate — there is no separate concessional rate.
- The company deducts TDS under Section 194 at 10% if your dividend from that company in a year crosses the threshold (raised to ₹10,000 for FY2025-26; confirm the applicable threshold for your year).
- TDS is only an advance; your final tax depends on your slab. You can claim credit for TDS when filing your return.
Worked example (illustrative, ₹10/share)
1,000 shares × ₹10 = ₹10,000 gross
TDS @10% = ₹1,000 (advance credit)
Tax @30% + 4% cess = ₹3,120
Net in hand = ₹6,880
Tembo actual (₹1/share, pre-split)
1,000 shares × ₹1 = ₹1,000 gross
Below TDS threshold → no TDS
Tax @30% + 4% cess = ₹312
Net in hand = ₹688
Effective post-tax yield on Tembo's dividend is a fraction of the already-tiny ~0.17% pre-tax yield. Tax rules change with each Budget — verify current thresholds and rates before acting. This is general information, not tax advice.
13. Key Risks
- Negative operating cash flow. Both FY25 and FY26 saw negative OCF (₹−77 Cr, ₹−90 Cr). Profit is not converting to cash; the model currently depends on external funding.
- High promoter pledging (~40.6%). A large encumbered promoter stake raises the risk of forced selling or governance stress if the price weakens.
- Sharp promoter dilution. Promoter holding fell from ~72.8% to ~36–39% over a few years, with further equity/warrant issuance planned — ongoing dilution for existing holders.
- Rising leverage and working capital. Borrowings up ~50% to ₹386 Cr; working capital days up from 10 to 132; debtor and inventory days climbing. This strains liquidity even as sales grow.
- Earnings-quality and concentration. ~14.6% of FY26 PBT came from other income; rapid growth in a small-cap engineering/EPC and emerging defence business can be lumpy and order-dependent.
Risk items are drawn from Screener flags and filings; some (e.g. exact pledge and net-debt figures) are as-reported by data services and should be re-verified against the latest exchange disclosure.
14. What To Monitor
- Operating cash flow turning positive. The single most important signal — watch whether FY27 OCF moves back above zero as receivables and inventory normalise.
- Promoter pledge trajectory. A falling pledge percentage would ease governance risk; a rising one would worsen it.
- Working-capital discipline. Track debtor days, inventory days and the cash conversion cycle in each quarterly result.
- Debt levels and interest cost. Watch whether borrowings stabilise or keep climbing, and the trend in interest as a share of operating profit.
- Capital-raising cadence and use of proceeds. Frequent equity/warrant issues (e.g. the planned warrant raise) dilute holders; monitor whether raised funds translate into cash-generative capacity.
- Order book and defence-vertical execution. Forward revenue visibility depends on winning and executing engineering/EPC and defence orders.
15. Conclusion
Tembo Global Industries' FY26 interim dividend of ₹1 per share is best understood as a token shareholder gesture, not an income proposition. The "10%" is a face-value coupon; the real yield is around 0.17%. Earnings cover the payout roughly 49 times, yet the company's operating and free cash flow were both negative, so in cash terms the dividend rides on raised capital, not on business cash generation.
The investment character here is a fast-growing, high-ROE, but cash-consuming and leverage-funded small-cap with meaningful governance flags — steep promoter dilution and ~40% promoter pledging — and a 10:1 stock split that changes the optics but not the economics. The positives (46% revenue growth, 92% profit growth, expanding margins) and the negatives (negative OCF/FCF, rising debt and working capital, pledging) sit side by side. We present both and leave the decision to you.
Frequently Asked Questions
What dividend has Tembo Global Industries announced?
What is the Tembo Global Industries dividend yield?
What was the record date for the dividend?
What was the ex-dividend date?
When was the dividend paid?
Who was eligible to receive it?
How is this dividend taxed?
Is the Tembo Global dividend sustainable?
What is Tembo Global's dividend history?
How does the 10:1 stock split affect the dividend?
Why is the promoter holding and pledging important here?
What should investors monitor going forward?
Disclaimer
ShareBazaar Online is not registered with SEBI as an investment adviser or research analyst. This article is for informational and educational purposes only and does not constitute investment, financial, legal or tax advice, nor any buy, sell or hold recommendation. Figures are drawn from Screener.in (consolidated), NSE filings and public aggregators; some data points are as-reported by third parties, may contain errors, and should be independently verified against primary exchange filings before any decision. Market prices and dividend yields change constantly. Securities markets carry risk, including loss of capital. Please consult a SEBI-registered investment adviser and a qualified tax professional before investing. The author and ShareBazaar Online accept no liability for actions taken based on this content.