
Dividend Snapshot
The one-line takeaway: The “600%” is a coupon on the ₹10 face value, not a return on your investment. On the current market price of ₹4,085, the ₹60 final dividend is worth just 1.47%. The optically attractive 3.67% trailing yield exists largely because the share price has fallen about 28% over the past year — a point we unpack in the Yield Reality Check.
Dividend Announcement Summary
At its board meeting on 26 May 2026, held alongside the audited Q4 and full-year FY2025-26 results, the Bayer CropScience board recommended a final dividend of ₹60 per equity share of ₹10 each, subject to shareholder approval at the 68th Annual General Meeting on 19 August 2026. The company’s own filing pegs the total final-dividend outflow at ₹269.7 crore (₹2,697 million) across 4,49,42,092 shares.
What was announced
- Final dividend of ₹60/share for FY2025-26.
- Adds to the ₹90 interim already paid in November 2025.
- Total FY26 distribution: ₹150/share.
- Final-dividend cash outflow: ₹269.7 crore.
Management commentary
The CFO noted profit after tax grew 21% for the full year and that the company maintained “financial stability through disciplined cost and cash-flow management,” describing the balance sheet as strong. Management flagged a softer corn season but said the diversified portfolio sustained momentum.
Key Dates Timeline
| Event | Date | Status |
|---|---|---|
| Board Meeting / Recommendation | 26 May 2026 | Completed |
| Record Date | 05 Aug 2026 | Passed |
| Ex-Dividend Date (T+1) | 05 Aug 2026 | Passed |
| Book Closure | 06–13 Aug 2026 | Passed |
| AGM (Approval) | 19 Aug 2026 | Pending |
| Payment Date | Not Disclosed by Company | Post-AGM |
Under India’s T+1 settlement, the ex-date coincides with the record date (05 Aug 2026). The company has not disclosed a specific payment date; being a final dividend, it becomes payable only after AGM approval and, under Section 123 of the Companies Act 2013, must be paid within 30 days of declaration (i.e., on or before roughly 18 September 2026). Eligibility for this dividend closed at the 05 August 2026 record date.
Dividend Yield Analysis
Retail investors often see “600% dividend” and assume a 600% return. In reality, the percentage is calculated on the ₹10 face value, not the market price. Here is the difference between the face-value coupon and the real yield you actually earn.
Face-value coupon vs real yield
- Headline coupon (final): 600% of ₹10 FV
- Real yield on ₹60 at ₹4,085 (latest): 1.47%
- Real yield on ₹60 at ₹4,512 (announcement day): 1.33%
- Full-year ₹150 yield at ₹4,085: 3.67%
- Full-year ₹150 yield at announcement price: 3.32%
How the yield is built
The 3.67% full-year yield is genuinely high for an Indian agrochemical company — the sector average sits well below 2%. But it combines two distributions (₹90 interim + ₹60 final) and is measured against a share price that has de-rated sharply. Measured on the stock’s 52-week high of ₹5,706, the same ₹150 would have yielded only 2.63%. The yield rose as the price fell.
Dividend History Analysis
| Ex/Record Date | Type | ₹/Share | Financial Year |
|---|---|---|---|
| 05 Aug 2026 | Final | 60 | FY2025-26 |
| 14 Nov 2025 | Interim | 90 | FY2025-26 |
| 07 Aug 2025 | Final | 35 | FY2024-25 |
| 28 Nov 2024 | Interim | 90 | FY2024-25 |
| 01 Aug 2024 | Final | 35 | FY2023-24 |
| 16 Nov 2023 | Interim | 105 | FY2023-24 |
| 03 Aug 2023 | Final | 30 | FY2022-23 |
| 17 Nov 2022 | Interim | 100 | FY2022-23 |
| 04 Aug 2022 | Final | 25 | FY2021-22 |
| 11 Nov 2021 | Interim | 125 | FY2021-22 |
Annual totals & trend
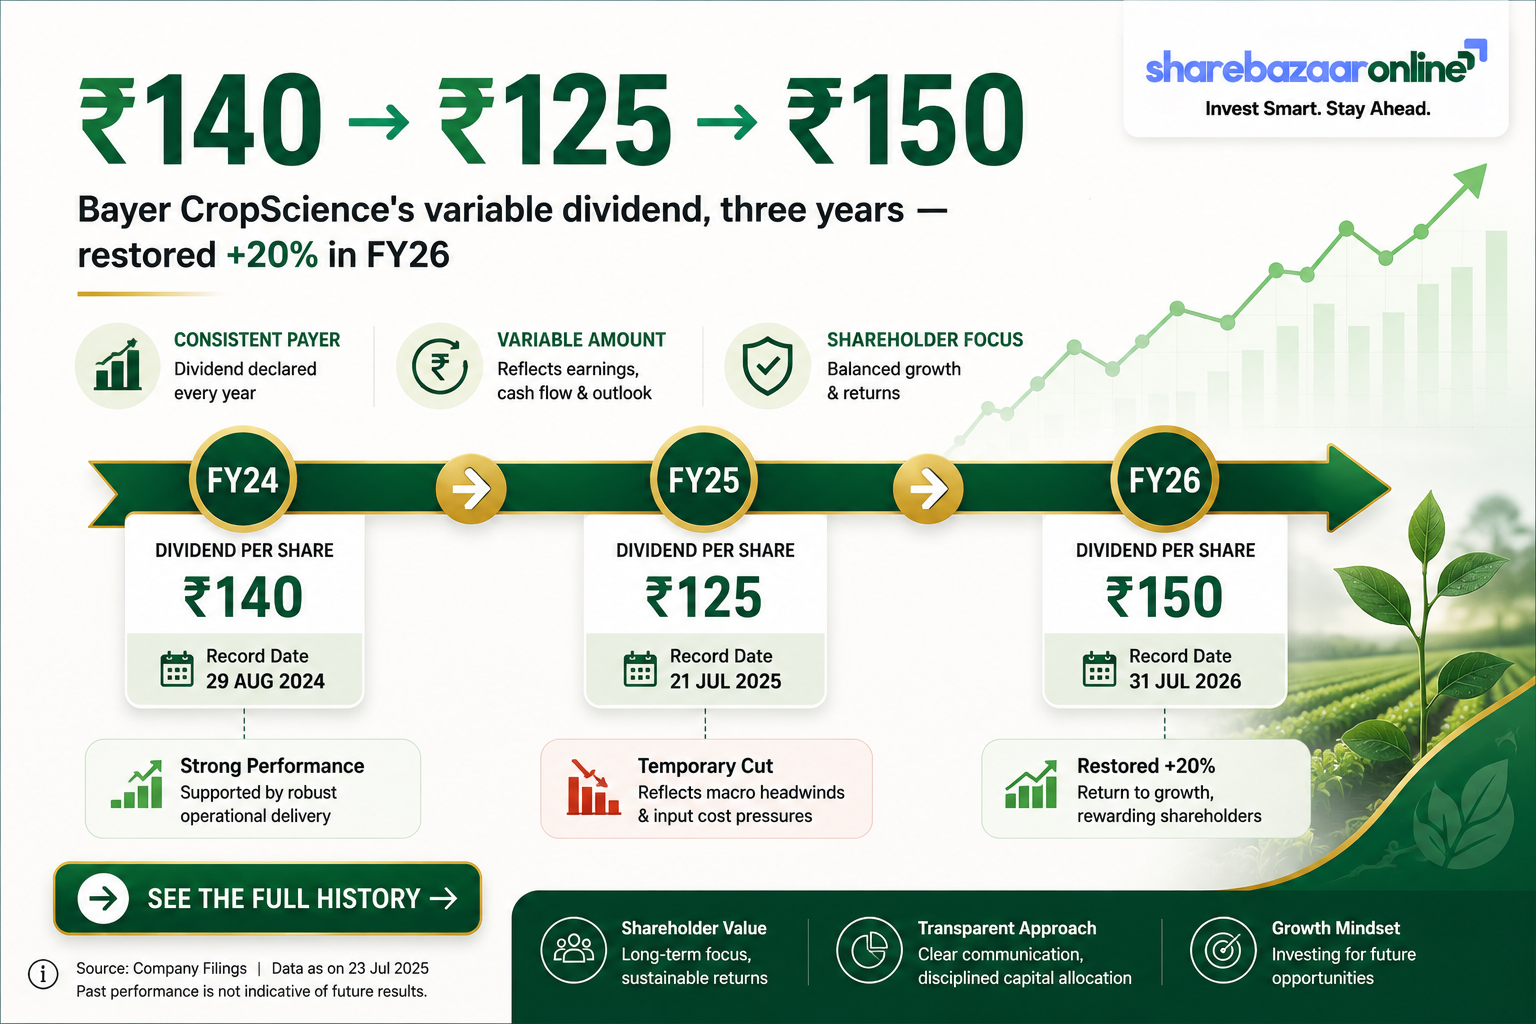
- FY2023-24: ₹140 (105 + 35)
- FY2024-25: ₹125 (90 + 35) — a cut
- FY2025-26: ₹150 (90 + 60) — restored, +20% YoY
Classification: Consistent but variable payer
Bayer CropScience has paid twice a year without interruption, but the per-share amount swings widely (final dividends have ranged from ₹25 to ₹105). The pattern reflects a policy of paying out most of each year’s profit rather than a fixed, steadily rising dividend. Treat the amount as earnings-linked, not guaranteed.
Financial Performance Analysis
| ₹ Crore (Standalone) | FY24 | FY25 | FY26 |
|---|---|---|---|
| Revenue | 5,106 | 5,473 | 5,675 |
| Operating Profit | 959 | 691 | 874 |
| Operating Margin | 19% | 13% | 15% |
| Net Profit (PAT) | 740 | 568 | 689 |
| EPS (₹) | 164.77 | 126.38 | 153.35 |
Operating leverage: the FY25 warning
FY25 is a textbook case of negative operating leverage: revenue rose 7.2% but PAT fell 23.2%. The cause was margin compression — operating margin collapsed from 19% to 13%. FY26 reversed part of that: revenue up 3.7%, but PAT rebounded 21.3% as margin recovered to 15% on tighter cost control. The business is margin-sensitive and seasonal, so top-line growth alone does not guarantee profit growth.
Earnings quality
Other income of ₹95 crore made up about 11% of pre-tax profit in FY26 — a moderate, not alarming, share. The bulk of profit is operating. Q4 FY26 EBITDA rose 19.9% to ₹203.5 crore with margin expanding 220 bps to 18.4%, showing the recovery was operations-led rather than one-off-led.
Note: Bayer CropScience reports predominantly on a standalone basis (its India operations); consolidated and standalone figures are effectively the same for this entity. Return ratios remain strong: ROE 23.7%, ROCE 29.1%.
Cash Flow Analysis
Reported profit is an accounting opinion; cash is fact. The good news for FY26: cash generation was excellent. Operating cash flow of ₹1,078 crore exceeded net profit (CFO/PAT = 1.56x), and free cash flow was ₹1,014 crore — more than enough to fund the entire ₹674 crore FY26 dividend from current-year cash.
FY26 — comfortably cash-funded
- Operating cash flow: ₹1,078 Cr
- Free cash flow: ₹1,014 Cr
- Total FY26 dividend outflow: ₹674 Cr
- FCF coverage of dividend: 1.50x
FY25 — the year cash didn’t cover it
The contrast matters. In FY25, operating cash flow was only ₹262 crore and FCF just ₹222 crore, against a ₹125/share dividend costing about ₹562 crore. That year FCF covered barely 0.40x of the payout — the dividend was effectively funded from reserves and prior cash, not that year’s cash generation. This is the cyclicality investors must watch.
Balance Sheet Strength
The balance sheet is a genuine strength. Borrowings of just ₹82 crore against reserves of ₹2,921 crore leave the company effectively debt-free, and Screener flags that working-capital days have improved from 74 to 56. A near-debt-free balance sheet means the dividend is not being funded by borrowing — an important tick on the sustainability checklist.
Dividend Sustainability Analysis
| Coverage Test | Metric (FY26) | Verdict |
|---|---|---|
| Earnings coverage (total ₹150) | EPS ₹153 / DPS ₹150 = 1.02x | Thin |
| Earnings coverage (final ₹60) | 2.56x | Comfortable |
| OCF coverage | ₹1,078 Cr / ₹674 Cr = 1.60x | Pass |
| FCF coverage | ₹1,014 Cr / ₹674 Cr = 1.50x | Pass |
| Cash / liquidity | Near debt-free, reserves ₹2,921 Cr | Pass |
Verdict: Sustainable — with one caveat
Three of the four coverage tests pass clearly, and FY26 cash generation covered the payout 1.5 times over. The single caveat is the very high payout ratio (~98%): on a total-year basis the company returns almost all its earnings, leaving earnings coverage of just 1.02x. That is fine in a strong cash year like FY26, but as FY25 showed, in a weak year the dividend has to lean on reserves. The distribution is sustainable as long as profitability and cash conversion hold; it is not a fixed floor and could move down in a poor season.
Peer Comparison
| Company | FY26 Dividend | Approx. Yield | ROE | ROCE |
|---|---|---|---|---|
| Bayer CropScience | ₹150 (FV ₹10) | 3.67% | 23.7% | 29.1% |
| PI Industries | ₹15 (FV ₹1) | ~0.4% | — | — |
| Sumitomo Chemical India | ₹1.30 final (FV ₹1) | ~0.3% | 17.7% | 23.5% |
| Rallis India | ₹3 (FV ₹1) | — | — | — |
Blank cells indicate figures not independently verified from primary sources at the time of writing and are left intentionally empty rather than estimated. Peer dividend/yield data sourced from company FY26 results filings.
The comparison surfaces the real story: Bayer CropScience is the standout dividend payer in the Indian agrochemical space. Peers like PI Industries, Sumitomo Chemical India and Rallis reinvest most of their earnings and yield well under 1%. Bayer instead returns nearly all its profit — a difference in capital-allocation philosophy, not just amount.
Promoter Impact Analysis
With a 71.44% holding, the German parent Bayer AG receives roughly ₹482 crore of the ₹674 crore full-year distribution — about 71 paise of every rupee paid out leaves for the promoter. The high payout ratio is therefore also an efficient way for the parent to repatriate India profits. Minority shareholders benefit alongside on a pro-rata basis, but they should understand the promoter is the primary beneficiary. Note also a recent intra-promoter reshuffle: Bayer AG is acquiring an 11.91% stake from Bayer CropScience AG (exempt from an open offer under SEBI rules), which does not change total promoter holding.
Taxation Analysis
Since April 2020, dividends are taxed in the hands of the shareholder at their income-tax slab rate (there is no separate dividend distribution tax). The company also deducts TDS at 10% under Section 194 if total dividend paid to a resident shareholder in the year exceeds ₹5,000 (TDS is 20% if PAN is not provided). The TDS is not an extra cost — it is adjusted against your final tax liability when you file your return.
Worked example — investor with 1,000 shares (final ₹60/share, 30% slab)
| Gross dividend (1,000 × ₹60) | ₹60,000 |
| TDS deducted at 10% (above ₹5,000) | ₹6,000 |
| Amount credited to bank | ₹54,000 |
| Total tax at 30% slab | ₹18,000 |
| Net dividend in hand after tax | ₹42,000 |
| Effective post-tax yield (on ₹4,085 price) | 1.03% |
For a 30% slab investor, the ₹6,000 TDS is a part-payment; a further ₹12,000 is payable at filing, leaving ₹42,000 net. Investors in lower slabs keep more; those below the taxable threshold can claim the TDS back or file Form 15G/15H where eligible.
Key Risks
- Monsoon & seasonality: Earnings swing sharply with the Kharif/Rabi cycle and weather (e.g. El Niño); a weak corn season already pressured FY26.
- Very high payout, thin earnings cover: At ~98% payout and 1.02x earnings coverage, a profit dip directly threatens the dividend amount.
- Margin volatility: Operating margin swung from 19% (FY24) to 13% (FY25) to 15% (FY26); raw-material and pricing pressure can compress profits even when revenue grows.
- Price de-rating: The stock has fallen about 28% over the past year; the “high yield” partly reflects share-price weakness, not dividend strength.
- Related-party dependence: The company is seeking approval for related-party transactions with parent Bayer AG of up to ₹3,500 crore for FY28; terms and continuity of parent support are a structural exposure.
- Regulatory / compliance: Multiple state e-way-bill penalty orders and product-registration/regulatory risk are inherent to the agrochemical sector.
What To Monitor
- AGM outcome (19 Aug 2026) — final confirmation of the ₹60 dividend and the ₹3,500 crore RPT resolution.
- Operating margin trajectory — whether the FY26 recovery to 15% holds or reverts; margin drives the dividend.
- Cash conversion (CFO/PAT) — FY26 was strong at 1.56x; watch for a repeat of the weak FY25 (0.6x) that left FCF short of the payout.
- Monsoon & Kharif demand — the single biggest swing factor for the next season’s volumes and pricing.
- Leadership transition — Chairman changes to Ravi Kirpalani from 12 Sep 2026; watch strategy continuity under the new chair and CFO Vinit Jindal.
- Interim-dividend cadence — whether the November interim is maintained near ₹90, which anchors the full-year yield.
Conclusion
Bayer CropScience’s ₹60 final dividend lifts the FY2025-26 payout to ₹150 per share and cements its position as the highest-yielding large agrochemical name on the Indian market at about 3.67%. The distribution is well-covered by FY26 cash flow (FCF 1.5x) and rests on a near-debt-free balance sheet. The two honest caveats: the ~98% payout leaves almost no earnings cushion, so the amount is tied to each year’s profit; and part of the headline yield reflects a 28% share-price decline rather than dividend growth. As FY25 demonstrated, in a weak season cash may not fully cover the payout. The positives (strong return ratios, clean balance sheet, consistent payment record) and the negatives (earnings-linked variability, cyclicality, promoter-skewed benefit) are laid out above so you can weigh them yourself.
Frequently Asked Questions
What dividend has Bayer CropScience announced for 2026?
What is the Bayer CropScience dividend yield?
What is the record date for the Bayer CropScience dividend?
What is the ex-dividend date?
When will the dividend be paid?
Who is eligible for this dividend?
How is the dividend taxed?
Is the Bayer CropScience dividend sustainable?
What is Bayer CropScience’s dividend history?
Why is the dividend yield so high compared with peers?
How much of the dividend goes to the promoter?
What should investors monitor going forward?
Disclaimer
ShareBazaar Online is not a SEBI-registered investment adviser. This article is for informational and educational purposes only and does not constitute investment, financial, legal or tax advice, nor a recommendation to buy, sell or hold any security. All figures are computed from company filings and publicly available data believed to be reliable as of the date of writing; the current market price, yield and exact dividend dates should be re-verified against NSE/BSE and the company’s official filings before acting. Dividends are subject to shareholder approval and can change. Investments in securities are subject to market risks; please consult a SEBI-registered adviser and read all offer documents carefully. ShareBazaar Online and its authors accept no liability for any loss arising from the use of this information.