
Dividend Snapshot
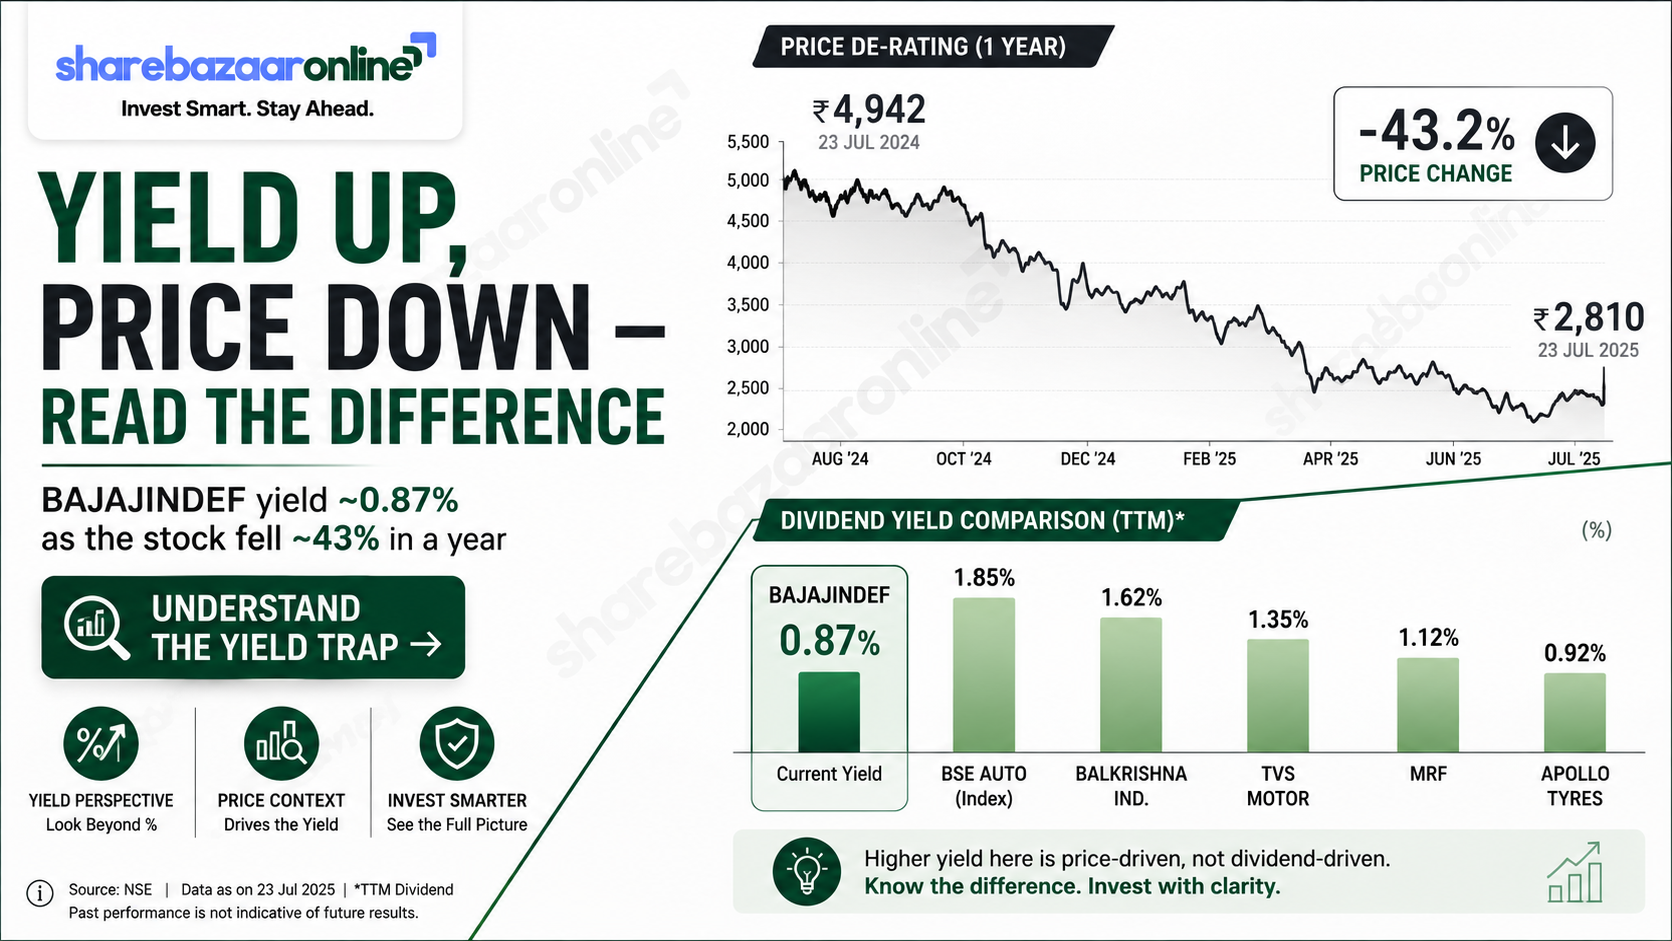
Indef Manufacturing Limited (NSE: BAJAJINDEF, BSE: 544364) — the material-handling equipment maker demerged from Hercules Hoists — has recommended a final dividend of ₹2 per equity share for FY2025-26. On a face value of ₹1, that headline reads as a 200% dividend, but on the current market price the actual Indef Manufacturing dividend yield is only about 0.87%. This is the classic face-value illusion, and it is the first thing a retail investor should understand.
Financials on a consolidated basis. Market data sourced from Screener.in / exchange feeds and are price-dependent; verify live before acting.
Dividend Announcement Summary
At its board meeting held on 25 May 2026, the Board of Directors of Indef Manufacturing recommended a final dividend of ₹2 per share for the financial year ended 31 March 2026, subject to shareholder approval at the 4th Annual General Meeting on 12 August 2026. Pursuant to Regulation 42 of SEBI (LODR), the company fixed Wednesday, 5 August 2026 as the record date for determining dividend entitlement and AGM voting eligibility.
A key point for readers: the exchange intimation only fixes the record date. The dividend is described as payable “if declared at the ensuing AGM,” so the payout becomes final only upon shareholder approval. The dividend quantum of ₹2 is confirmed via the company’s AGM notice and annual report.
The ₹2 payout is flat versus the ₹2 paid for FY2024-25 — even though consolidated net profit fell roughly 31% over the same period. Holding the dividend steady through an earnings decline is itself an analytical signal, discussed in the sustainability section below.
Key Dates Timeline
*Under India’s T+1 settlement cycle, the ex-date and record date typically coincide; the 05-Aug ex-date is inferred from the record date and should be confirmed against the NSE/BSE corporate-action circular. Statutory payment limit reflects the 30-day rule from the date of declaration (AGM), not a company-disclosed date.
Dividend Yield Analysis
The “200%” headline sounds large but is calculated on the ₹1 face value, not on what you pay for the share. The real dividend yield is the dividend divided by the market price:
Yield reality check: the yield has crept up from about 0.72% at announcement to roughly 0.87% today — but not because the company raised the dividend. It is flat at ₹2. The yield rose only because the share price has fallen sharply (the stock is down roughly 43% over the past year, from a 52-week high near ₹450). A rising yield driven by a falling price is very different from a rising yield driven by a growing dividend. At under 1%, Indef’s yield is well below the yield on a typical bank fixed deposit, so this is not a stock to be bought primarily for dividend income.
Dividend History Analysis
| Financial Year | Type | DPS (₹) | % on FV | Payout (on EPS) |
|---|---|---|---|---|
| FY2025-26 | Final | 2.00 | 200% | ~27% |
| FY2024-25 | Final (first post-demerger) | 2.00 | 200% | ~19% |
| Pre-FY25 | Indef Manufacturing was created via the demerger of Hercules Hoists’ manufacturing business (scheme effective 30-Sep-2024; listed 21-Feb-2025). No standalone listed dividend record exists before FY25. | |||
Classification: Recently listed / short-history payer. As a listed entity, Indef Manufacturing has now paid ₹2 in each of its two available years. That is only two data points, so “consistency” cannot yet be judged in the way it can for a decades-old payer. What stands out is that the dividend was held flat at ₹2 despite EPS falling from ₹10.68 to ₹7.38 — which is why the payout ratio expanded from roughly 19% to 27%. The manufacturing lineage traces back to Hercules Hoists, historically a dividend-paying group, but that legacy record is not directly transferable to this newly listed company.
Financial Performance Analysis
| Consolidated (₹ Cr) | FY2024-25 | FY2025-26 | Change |
|---|---|---|---|
| Revenue | 179 | 208 | +16.2% |
| Operating profit | 31 | 23 | -25.8% |
| OPM % | 17% | 11% | -6 pp |
| Other income | 17 | 8 | -52.9% |
| Net profit (PAT) | 34 | 23.4 | -30.5% |
| EPS (₹) | 10.68 | 7.38 | -30.9% |
Operating leverage worked in reverse this year. Revenue grew a healthy +16.2%, yet operating profit fell 25.8% and net profit fell about 31%. Two forces explain the gap: (1) margin compression — operating margin dropped from 17% to 11%, roughly 6 percentage points, meaning costs rose faster than sales; and (2) a ~53% collapse in other income (from ₹17 Cr to ₹8 Cr), which for this investment-heavy company is a meaningful profit lever. The March 2026 quarter also carried a negative other-income line and a large tax credit that flattered the reported quarterly profit — an earnings-quality point worth noting. In short, top-line growth was real, but it did not reach the bottom line.
Cash Flow Analysis
Reported profit is an opinion; cash is a fact — and here the cash story is the bright spot. Even as profit fell, operating cash flow jumped to ₹24 Cr (from just ₹5 Cr) and free cash flow swung to a positive ₹18 Cr (from −₹4 Cr). A CFO/operating-profit ratio of 132% signals genuine cash conversion, helped by lower working-capital needs (working-capital days fell from 50 to about 22). Against a dividend outflow of just ₹6.40 Cr, this year’s free cash flow alone covers the payout ~2.8 times. The dividend is being funded from current cash generation, not from borrowings or asset sales — a healthy configuration.
Balance Sheet Strength
The balance sheet is the company’s biggest strength and its biggest quirk. Indef is almost debt-free (borrowings ~₹3 Cr) and sits on an investment / treasury book of about ₹210 Cr — larger than a full year of revenue. That war-chest means the ₹6.40 Cr dividend is covered more than 30 times over by liquid assets alone, so affordability is simply not in question. The flip side is that this large investment book is why other income swings matter so much to reported profit, and why returns look modest: ROE and ROCE hover around 9%, low for a capital-goods business, partly because a big pile of low-yielding investments sits on the equity base.
Dividend Sustainability Analysis
Verdict: Sustainable on every affordability test. The dividend passes all four coverage checks — earnings cover it 3.7x, operating cash flow 3.8x, free cash flow 2.8x, and the investment book a lavish ~33x. The payout ratio of ~27% is conservative and leaves ample retained earnings. The only caution is directional rather than about affordability: earnings are declining (PAT down ~31% in FY26), and margins have compressed. The company can comfortably keep paying ₹2; whether it can grow the dividend depends on reversing the margin and profit slide.
Peer Comparison
| Company | FY26 DPS | Div Yield | Payout | ROE |
|---|---|---|---|---|
| Indef Manufacturing | ₹2.00 | ~0.87% | ~27% | ~9% |
| Action Construction Equip. | ₹2.00 | ~0.2% | ~7% | ~27% (3yr) |
| Elecon Engineering | ₹1.50 | ~0.3% | — | ~20% (3yr) |
| Ingersoll-Rand (India) | ₹75 (incl. interim) | ~1.9% | ~73% | ~42% (3yr) |
Against material-handling and capital-goods peers, Indef’s dividend yield of ~0.87% actually screens higher than ACE (~0.2%) and Elecon (~0.3%), but far below the high-payout Ingersoll-Rand India (~1.9%). The more telling gap is profitability: Indef’s ROE of ~9% is materially below ACE (~27%), Elecon (~20%) and Ingersoll-Rand (~42%). So Indef is a low-return payer whose yield edge over ACE/Elecon owes as much to its de-rated share price as to generosity. Peer figures are approximate and drawn from public aggregators; confirm from primary filings before publication.
Promoter Impact Analysis
Of the ₹6.40 Cr total outflow, the Bajaj-group promoters (holding 69.61%, led by Bajaj Sevashram and Bajaj Holdings & Investment) receive about ₹4.46 Cr, while public and minority shareholders share roughly ₹1.87 Cr. FII holding is small and slipped to about 1.1% by June 2026 (from ~1.6%), and DII holding is negligible. Because the promoter stake is high, the bulk of any dividend flows to the promoter group — a neutral fact of ownership structure, but one minority investors should register when weighing a sub-1% yield.
Taxation Analysis
Since April 2020, dividends are taxed in the hands of the shareholder at their applicable income-tax slab rate — there is no separate Dividend Distribution Tax. The company deducts TDS at 10% (Section 194) only if a resident’s total dividend from that company exceeds ₹5,000 in a financial year. That TDS is not the final tax; it is adjusted against your total liability when you file your return.
Worked example A — 1,000 shares
Worked example B — 5,000 shares
Illustrative for a 30% slab investor; cess taken at 4%. Your actual tax depends on your slab. Submit Form 15G/15H if eligible to avoid TDS. This is general information, not tax advice.
Key Risks
1. Declining profitability. Net profit fell about 31% in FY26 and EPS dropped from ₹10.68 to ₹7.38; a continued slide would pressure future dividend growth even if the current ₹2 is safe.
2. Margin compression. Operating margin fell from 17% to 11% despite 16% revenue growth — a sign that input, employee or other costs are outpacing pricing power.
3. Earnings quality / other-income dependence. A large ₹210 Cr investment book makes reported profit sensitive to treasury and other income; the March 2026 quarter leaned on a tax credit, which is not repeatable.
4. Cyclical, capex-linked demand. Hoists, cranes and material-handling equipment sell into industrial and infrastructure capex; a slowdown in customer investment directly hits order books.
5. Sharp share-price de-rating. The stock is down roughly 43% over one year from a 52-week high near ₹450; the “higher” yield partly reflects this fall, and volatility has been high for a recently listed small-cap.
6. Low structural returns. ROE/ROCE around 9% are modest for capital goods, capping long-term compounding and dividend-growth capacity.
What To Monitor
1. Operating margin trajectory. Watch whether OPM recovers from 11% back toward the mid-teens — the single clearest signal of whether the profit decline is temporary or structural.
2. Core vs. other income mix. Track how much profit comes from the manufacturing business versus treasury/other income; rising reliance on other income is a quality warning.
3. Order inflow and capacity utilisation. Commentary on new orders across cranes, hoists and storage-retrieval systems will indicate demand strength.
4. Working-capital and cash conversion. FY26 saw working-capital days fall to ~22 and FCF turn positive; sustaining this is key to funding future dividends from operations.
5. Dividend growth vs. flat payout. Two straight years at ₹2 while earnings fell — a future hike would signal management confidence; another flat year amid weak profits would not.
6. Live CMP before any yield-based decision. Every yield figure here is price-dependent; re-check the current market price, as it moves the yield materially.
Conclusion
Indef Manufacturing’s FY26 final dividend of ₹2 per share (200% on ₹1 face value) is a case study in reading beyond the headline. The “200%” label translates to a real dividend yield of under 1%, so this is a stability-and-quality story, not an income story. The positives are genuine: an almost debt-free balance sheet, a ₹210 Cr investment cushion, strong FY26 cash generation (FCF of ₹18 Cr covering the payout ~2.8x), and a conservative 27% payout — making the ₹2 comfortably sustainable. The negatives are equally real: profit down ~31%, margins compressed by 6 points, single-digit returns, and a share price down ~43% that is doing much of the work in lifting the yield optically. Weigh the strong balance sheet and cash flows against the weakening earnings and modest returns, and decide for yourself.
Frequently Asked Questions
What dividend has Indef Manufacturing announced for FY2025-26?
What is the Indef Manufacturing dividend yield?
What is the record date for the Indef Manufacturing dividend?
What is the ex-dividend date?
When will the dividend be paid?
Who is eligible to receive the dividend?
How is this dividend taxed?
Is the Indef Manufacturing dividend sustainable?
What is Indef Manufacturing’s dividend history?
What should investors monitor going forward?
Why does the “200% dividend” not mean a 200% return?
What does Indef Manufacturing do?
Disclaimer
This article is for informational and educational purposes only and does not constitute investment, financial, or tax advice, nor any buy, sell, or hold recommendation. ShareBazaar Online is not a SEBI-registered investment adviser. Dividend amounts, record/ex-dates and payment dates are subject to shareholder approval and to change; the payment date was not disclosed by the company. All market prices, yields and ratios are price-dependent and were sourced from public exchange filings and financial aggregators (including Screener.in) as of the article date — they may be stale by the time you read this, so verify live figures independently. Figures that could not be independently confirmed are marked accordingly. Please consult a SEBI-registered adviser and a qualified tax professional before making any investment decision. Investments in securities are subject to market risks.