
Dividend Snapshot
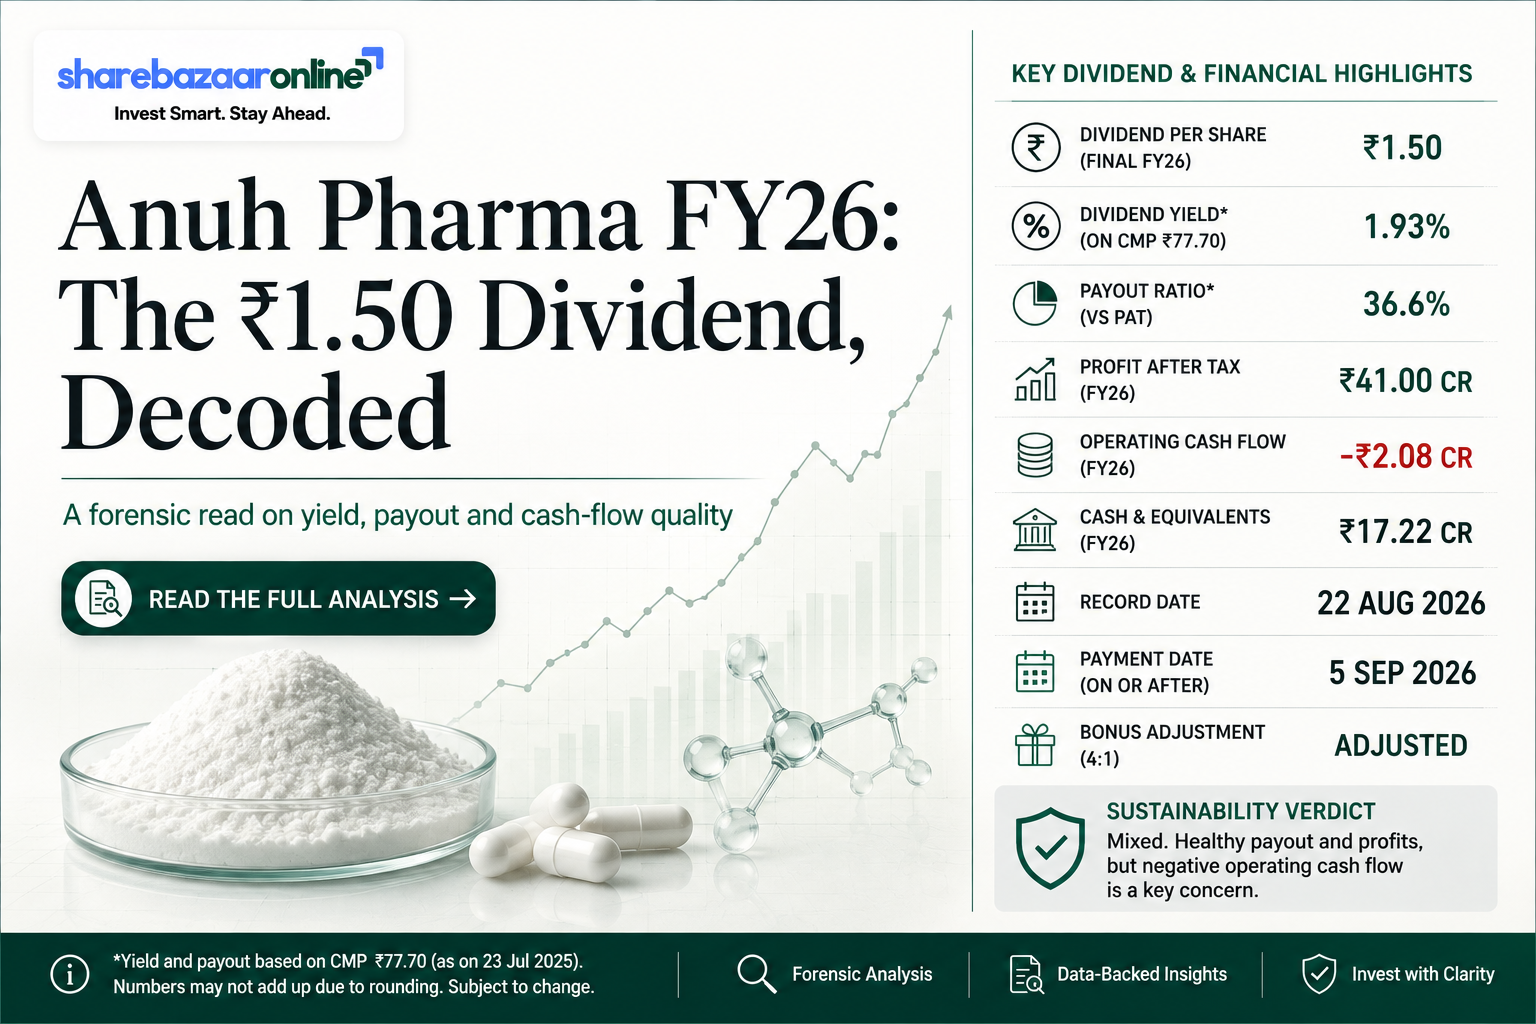
Anuh Pharma Limited (NSE: ANUHPHR | BSE: 506260) has recommended a final dividend of ₹1.50 per equity share for the financial year ended 31 March 2026 (FY2025-26). On a face value of ₹5, this is a 30% dividend. At the latest market price of ₹77.60 (NSE close, 10 August 2026), the dividend translates into a dividend yield of about 1.93% — one of the higher trailing yields in the listed Active Pharmaceutical Ingredient (API) space. The payout is subject to shareholder approval at the 66th Annual General Meeting.
Dividend At A Glance
- Dividend Type: Final Dividend
- Dividend Per Share: ₹1.50
- Dividend Rate: 30% on face value of ₹5
- Financial Year: FY2025-26 (ended 31 March 2026)
- Record Date: 05 August 2026
- Ex-Date: 05 August 2026
- AGM Date: 12 August 2026
Key Numbers
- Yield (at ₹77.60): ~1.93%
- Yield (at announcement ₹80.90): ~1.85%
- Estimated Total Outflow: ~₹15.03 crore
- Dividend Payout Ratio: ~36.6% of FY26 profit
- Earnings Coverage: 2.73x
- Net Debt: Debt-free (borrowings nil)
- FY26 EPS: ₹4.10 (bonus-adjusted)
The one thing to notice first: the ₹1.50 headline looks lower than the ₹2.50 paid two years ago — but Anuh issued a 1:1 bonus in July 2025, doubling the share count. Adjusted for that bonus, this dividend is actually higher, not lower. We unpack this in the History section below.
Dividend Announcement Summary
At its board meeting held on Wednesday, 20 May 2026, the Board of Directors of Anuh Pharma Limited approved the audited financial results for the quarter and year ended 31 March 2026 and recommended a final dividend of ₹1.50 per equity share (30%) on the face value of ₹5 each. As disclosed in the board outcome, the dividend is subject to shareholders’ approval at the ensuing 66th Annual General Meeting, which the company has convened for 12 August 2026 through video conferencing.
What The Board Approved
- Audited results for Q4 and FY2025-26 (unmodified auditor opinion)
- Final dividend of ₹1.50 per share, subject to AGM approval
- Re-appointment of two directors retiring by rotation
- Appointment of internal auditors and cost auditor for FY2026-27
- Adoption of new Memorandum & Articles of Association
Company Profile
Incorporated in 1960 and part of the SK Group, Anuh Pharma is a manufacturer of bulk drugs and chemicals (Active Pharmaceutical Ingredients), specialising in macrolides, anti-TB, anti-bacterial, anti-malarial and corticosteroid products. It operates a single reportable segment — Bulk Drug and Chemicals — and, per the FY26 results, has no subsidiary, associate or joint venture. Standalone and consolidated results are therefore identical.
Key Dates Timeline
| Event | Date | Status / Source |
|---|---|---|
| Board Meeting / Announcement | 20 May 2026 | Confirmed (board outcome) |
| Ex-Date | 05 August 2026 | Confirmed (exchange corporate action) |
| Record Date | 05 August 2026 | Confirmed (board outcome) |
| Book Closure | 06 Aug – 12 Aug 2026 | Confirmed (board outcome) |
| AGM (Approval) | 12 August 2026 | Confirmed — approval pending on this date |
| Payment Date | Not Disclosed by Company | Statutory outer limit: within 30 days of AGM (i.e. on or before ~11 September 2026) |
Reading the sequence: because this is a final dividend, it can only be paid after members approve it at the AGM. The record date of 05 August 2026 determines who is eligible; investors needed to hold shares on that date (having bought before the ex-date of 05 August 2026). Under Indian company law, once declared at the AGM, the dividend must be credited within 30 days.
Dividend Yield Analysis
The Yield Maths
- Dividend per share: ₹1.50
- Yield at ₹77.60 (10 Aug 2026): 1.93%
- Yield at ₹80.90 (announcement, 20 May 2026): 1.85%
- Formula: (₹1.50 ÷ ₹77.60) × 100 = 1.93%
Yield moves inversely with price. A lower share price mechanically lifts the yield. Verify the live price before you rely on any yield figure.
Yield Reality Check
Anuh’s ~1.93% yield is attractive versus API peers, but part of the reason it looks high is that the share price has fallen roughly 13-15% over the past year (52-week range ₹66.7–₹94.9). A falling price flatters the yield. The dividend itself was maintained, not increased in headline terms. So this is a “steady dividend on a de-rated stock” yield, not a “rapidly growing dividend” yield.
Face-value illusion: retail headlines often say “30% dividend.” That 30% is on the ₹5 face value, not on your purchase price. Thirty percent of ₹5 is just ₹1.50. Your real return is the ~1.93% yield on the market price — not 30%.
Dividend History Analysis
The most important adjustment in this whole report. Anuh Pharma issued a 1:1 bonus (one free share for every share held) in July 2025, doubling the number of shares. Any dividend paid before the bonus must be halved to compare it fairly with today’s dividend. Wire services that quote raw per-share numbers make FY26 look like a dividend cut. It is not.
| Financial Year | DPS as Declared | Bonus-Adjusted DPS | Dividend Payout* |
|---|---|---|---|
| FY2021-22 | ₹2.00 (pre-bonus) | ₹1.00 | ~29% |
| FY2023-24 | ₹2.50 (pre-bonus) | ₹1.25 | ~21% |
| FY2024-25 | ₹1.50 (post-bonus) | ₹1.50 | ~32% |
| FY2025-26 (current) | ₹1.50 | ₹1.50 | ~36.6% |
*Payout computed on that year’s reported profit; historic per-share dividends cross-referenced with the company’s cash-flow statements. Some intermediate years not shown are available in the company’s annual reports.
The Real Trend (Bonus-Adjusted)
On a like-for-like basis the dividend has risen: ₹1.00 → ₹1.25 → ₹1.50 → ₹1.50. In cash terms, FY24 returned about ₹12.53 crore to shareholders; FY26’s proposed ₹15.03 crore is roughly 20% more cash, not less. The “cut” is an optical illusion created by the bonus.
Payer Classification
Anuh has paid a dividend every year for over a decade, with payout ratios generally in the 20-48% band. We classify it as a Consistent Payer with a moderate, earnings-linked payout policy — though the per-share amount is cyclical and moves with profitability.
Financial Performance Analysis
| Metric (₹ crore) | FY2024-25 | FY2025-26 | Change |
|---|---|---|---|
| Revenue from Operations | 661.51 | 771.66 | +16.65% |
| EBITDA | 70.36 | 66.08 | −6.09% |
| EBITDA Margin | 10.64% | 8.56% | −208 bps |
| Profit After Tax (PAT) | 47.35 | 41.05 | −13.32% |
| EPS (₹, bonus-adjusted) | 4.72 | 4.10 | −13.1% |
Operating Leverage Worked In Reverse
This is the crux of Anuh’s FY26. Revenue grew 16.65%, but EBITDA fell 6.09% and PAT fell 13.32%. When sales rise yet profit shrinks, the cause is margin compression. The drivers:
- Raw material / traded-goods cost pressure: cost of goods (materials + traded purchases + inventory change) rose to 77.71% of revenue from 75.49% — a direct ~2.2 percentage-point hit to gross margin.
- Employee costs up ~14.2%, outpacing... margin absorption capacity.
- A mark-to-market loss of ₹1.90 crore on investments in Q4 dragged “other income” into negative territory for the March quarter.
Bulk-drug manufacturing is a low-margin, input-cost-sensitive business. When key starting materials or solvent prices rise faster than the company can pass through, margins compress even as volumes and revenue grow.
Cash Flow Analysis
The single most important finding in this report
Anuh Pharma reported a healthy ₹41.05 crore profit in FY26 — but its operating cash flow was NEGATIVE at about ₹(3.01) crore, and free cash flow was ₹(10.88) crore. In plain English: the company made an accounting profit but its core operations consumed cash this year rather than generating it. Reported profit is an opinion; cash is a fact.
Why Cash Went Negative
Operating profit before working-capital changes was a solid ₹65.14 crore. But a ₹54.91 crore working-capital drain wiped it out, driven by:
- Inventories ballooning from ~₹74 cr to ~₹148 cr (+98%)
- Trade & other receivables up ~₹20 cr
- Then ₹13.24 cr of taxes paid on top
So How Is The Dividend Funded?
Not from this year’s operating cash. In FY26 the company sold ₹81.83 crore of investments (net investing inflow ~₹17.84 crore) and drew down cash. The prior-year dividend of ₹14.97 crore paid in FY26 was effectively funded by liquidating the treasury / investment book and cash reserves, not by operations.
Independent cross-check: a widely used analytics service flags Anuh’s cash payout ratio at roughly 570% — i.e. the dividend is far larger than trailing free cash flow. This is consistent with our own finding of negative operating and free cash flow for FY26.
Balance Sheet Strength
The Cushion (Positives)
- Debt-free: borrowings reduced to nil (from ~₹10.5 cr a year earlier).
- Cash + investments of ~₹92.74 crore (cash ₹8.06 cr, current investments ₹44.86 cr, non-current investments ₹39.58 cr, other bank ₹0.24 cr).
- Total equity of ~₹352 crore; book value ~₹35 per share.
- This liquidity gives 6.17x cash coverage of the ₹15.03 cr dividend.
The Strain (Watch Items)
- Cash conversion cycle stretched to ~89 days from ~59 days a year earlier.
- Inventory days roughly 54 → 90; the ₹148 cr inventory pile is a working-capital risk if demand softens.
- Trade receivables of ~₹239 crore — debtor days ~113.
- Cash balance itself fell from ~₹19.6 cr to ~₹8.1 cr during the year.
Net position: the balance sheet is strong on the debt side and comfortable on liquidity — the dividend is easily affordable from reserves. The concern is not solvency; it is the quality of cash generation, where working capital is absorbing an increasing share of profit.
Dividend Sustainability Analysis
| Coverage Test | Value | Verdict |
|---|---|---|
| Earnings coverage (EPS ÷ DPS) | 2.73x | PASS |
| Cash & investments coverage | 6.17x | PASS |
| Operating cash flow coverage | −0.20x | FAIL (FY26) |
| Free cash flow coverage | −0.72x | FAIL (FY26) |
Overall Verdict: Moderately Sustainable
The dividend passes the earnings test and is very comfortably covered by the balance sheet (₹93 cr of cash and investments against a ₹15 cr payout). A debt-free company with this liquidity can clearly afford ₹1.50 per share. However, it fails the cash-flow tests for FY26 because operations consumed cash this year. The dividend is being sustained by reserves, not by current-year cash generation. That is fine as a one-off, but if negative operating cash flow persists for a second year, the dividend’s quality — not its affordability — would come into question.
Peer Comparison
| Company (API / Bulk Drug) | Div. Yield | Payout | Mkt Cap | Net Debt |
|---|---|---|---|---|
| Anuh Pharma | ~1.93% | ~36.6% | ~₹773 cr | Debt-free |
| Aarti Drugs | ~0.53% | ~9% | ~₹3,846 cr | Modest debt |
| Supriya Lifescience | ~0.13% | ~4% | ~₹7,432 cr | Almost debt-free |
Where Anuh Wins
Anuh offers a clearly higher dividend yield and a much higher payout ratio than its API peers. For an income-oriented investor, it returns a larger share of profit to shareholders. Its debt-free status also matches or beats peers.
Where Anuh Lags
Anuh is the smallest and slowest-growing of the three, with the lowest EBITDA margin (~8.6%) and modest return ratios (ROE ~10.7%, ROCE ~14.9% for FY26). Supriya, though a low yielder, compounds capital far faster. Anuh’s high yield partly reflects a de-rated, low-growth business rather than superior quality.
Peer figures are drawn from public aggregators as of August 2026 and are indicative; peer return ratios not independently verified are omitted rather than estimated.
Promoter Impact Analysis
Who Gets The Cash
- Promoter holding: 71.79% (June 2026)
- Promoter share of dividend: ~₹10.79 crore
- Public share of dividend: ~₹4.24 crore
- FII holding ~0.01%, DII ~0.00% — negligible institutional ownership
What It Means
With promoters owning nearly 72%, the bulk of every dividend rupee flows to the promoter family. This aligns their interests with the payout policy and is common in family-run SK Group companies. Minority shareholders share proportionally in the same ₹1.50 per share. Note that a small group of promoter-group members (0.95%) had sought reclassification to “public”; per exchange filings, three such requests were subsequently withdrawn in August 2026.
Taxation Analysis
How Dividends Are Taxed In India
- Since FY2020-21, dividends are taxable in the hands of shareholders at their applicable income-tax slab rate (the earlier Dividend Distribution Tax was abolished).
- The company must deduct TDS at 10% under Section 194 if total dividend paid to a resident in a financial year exceeds ₹5,000 (20% if PAN is not furnished).
- Dividend is added to “Income from Other Sources” and taxed at your slab; TDS is adjustable against your final tax liability.
Worked Example (Retail Investor)
Investor holds 1,000 shares of Anuh Pharma at the ₹1.50 dividend:
- Gross dividend = 1,000 × ₹1.50 = ₹1,500
- TDS: NIL (below the ₹5,000 threshold)
- Tax at 30% slab = ₹450
- Net in hand = ₹1,050
- Net effective yield (at ₹77.60) = ~1.35%
A larger holder crossing ₹5,000 of dividend (e.g. ~3,334+ shares) would face 10% TDS. For example, 4,000 shares = ₹6,000 gross → ₹600 TDS deducted at source; at a 30% slab the net after full tax is ₹4,200. Investors in lower slabs keep more; those in the 0% bracket can claim a refund of TDS.
Key Risks
- Negative operating cash flow: FY26 operations consumed cash. If working capital keeps expanding, dividends will continue to rely on reserves rather than earnings-backed cash.
- Margin compression: EBITDA margin fell to 8.56% from 10.64%. Bulk-drug margins are thin and highly sensitive to raw-material and solvent price swings.
- Falling profit despite rising sales: PAT dropped ~13% even as revenue rose ~17% — a sign the business is not converting growth into profit efficiently.
- Working-capital / inventory build-up: inventory nearly doubled to ~₹148 cr; a demand slowdown could force write-downs or further cash strain.
- Customer & product concentration: a single reportable segment (bulk drugs) and reliance on a limited API basket and export markets (Mexico, Brazil, Iran, etc.) expose it to regulatory, currency and geopolitical shocks.
- Treasury / mark-to-market volatility: a large investment book means “other income” and reported profit can swing with market movements, as seen in the ₹1.90 cr Q4 MTM loss.
What To Monitor
- Operating cash flow in FY27: the single most important number to watch. A return to positive OCF would confirm FY26 was a one-off working-capital year.
- EBITDA margin trajectory: can management pull margins back toward the 10%+ range, or is 8-9% the new normal?
- Inventory and receivable days: watch whether the ₹148 cr inventory unwinds into cash or keeps building.
- Revenue-to-profit conversion: track whether volume growth finally flows through to PAT growth.
- Dividend policy consistency: whether the company holds or grows the ₹1.50 per-share payout in FY27.
- Capex and capacity utilisation: new-block ramp-up and export order flow, which drive future earnings quality.
Conclusion
Anuh Pharma’s FY26 final dividend of ₹1.50 per share (30%, ~1.93% yield) tells two stories at once. On the surface it looks like a cut from the ₹2.50 of two years ago; adjusted for the 1:1 bonus, it is actually a ~20% increase in cash returned and a Consistent Payer maintaining a healthy ~37% payout.
But the deeper read is more cautious. FY26 was a year where revenue rose yet profit and margins fell, and where operating and free cash flow turned negative because working capital exploded. The dividend is comfortably affordable — the company is debt-free with ~₹93 crore of cash and investments — but it was funded from the balance sheet, not from this year’s operations. That makes the payout affordable but, in cash-quality terms, moderately sustainable rather than robustly self-funding.
The verdict for a dividend-focused reader: a genuinely high-yielding, debt-free API name with a shareholder-friendly payout — but one whose cash generation and margins deserve close watching in FY27. We present the positives, negatives, risks and monitoring points above so you can weigh them yourself.
Frequently Asked Questions
What dividend has Anuh Pharma announced for FY2025-26?
What is the dividend yield of Anuh Pharma?
What is the record date for the Anuh Pharma dividend?
What is the ex-date for the Anuh Pharma dividend?
When will the Anuh Pharma dividend be paid?
Who is eligible to receive the dividend?
How is the Anuh Pharma dividend taxed?
Is the Anuh Pharma dividend sustainable?
Did Anuh Pharma actually cut its dividend?
What is Anuh Pharma’s dividend history?
How much dividend will promoters receive?
What should investors monitor going forward?
Is Anuh Pharma a debt-free company?
Disclaimer
This article is published by ShareBazaar Online for information and educational purposes only and does not constitute investment, financial, legal or tax advice, nor a recommendation to buy, sell or hold any security. ShareBazaar Online is not a SEBI-registered investment adviser. Dividend amounts, dates and eligibility are subject to shareholder approval at the AGM and to change; the payment date was not disclosed by the company. All market prices, yields and ratios are as of the dates stated and are price-dependent — verify the live market price before acting. Financial figures are sourced from the company’s exchange filings (Regulation 30/33 board outcome dated 20 May 2026) and audited FY2025-26 results; peer and price data are drawn from public aggregators and may differ across sources. Figures that could not be independently verified are marked accordingly. Investors should read the company’s original filings and consult a SEBI-registered adviser and a qualified tax professional before making any decision. ShareBazaar Online accepts no liability for any loss arising from reliance on this content.