
Dividend Snapshot
Dividend Per Share
₹3.50
Final dividend, FY 2025-26 (175% of ₹2 face value)
Real Dividend Yield (at CMP ₹1,100)
~0.32%
Cash return on the market price — not the 175% face-value figure
Record Date
05 Aug 2026
Eligibility already determined
Total Dividend Outflow
~₹7.42 Cr
~20.4% of consolidated FY26 net profit
One-line verdict: A small but steadily growing, fully cash-funded, debt-free payout — the yield is modest because the market prices Sika as a high-growth aerospace and defence compounder (P/E ~64x), not as an income stock. All ratios below are computed from consolidated data; verify the live market price before acting, since every yield figure moves with price.
Dividend Announcement Summary
The Board of Directors of Sika Interplant Systems Ltd, at its meeting held on 8 May 2026, approved the audited standalone and consolidated results for FY 2025-26 and recommended a final dividend of ₹3.50 per equity share of face value ₹2 each. The recommendation was placed before shareholders and approved at the 40th Annual General Meeting held on 12 August 2026. The statutory auditors issued an unqualified (clean) opinion on the FY26 results.
What the numbers behind the dividend look like
- Consolidated revenue from operations: ~₹211 Cr (FY26) vs ~₹148 Cr (FY25)
- Consolidated net profit: ~₹36.4 Cr (FY26) vs ~₹26.2 Cr (FY25)
- Consolidated EPS: ₹17.19 (FY26) vs ₹11.95 (FY25)
- Company is almost debt-free with treasury investments of ~₹81 Cr
The catch the headline hides
The full-year result was strong, but the fourth quarter was the softest in seven quarters: Q4 FY26 revenue fell ~10% year-on-year and ~18% sequentially. The annual growth was front-loaded into the first half. This is a project-execution business, so quarterly numbers are lumpy — a point we return to under Financial Performance and Key Risks.
Key Dates Timeline
| Event | Date | Status / Note |
|---|---|---|
| Board Meeting & Recommendation | 8 May 2026 | Dividend recommended along with FY26 results |
| Ex-Date | 5 Aug 2026 | Under T+1, ex-date aligns with record date |
| Record Date | 5 Aug 2026 | Shareholder eligibility fixed on this date |
| AGM (Approval) | 12 Aug 2026 | 40th AGM — dividend approved by shareholders |
| Payment / Credit | Within 30 days of AGM | Exact date: Not Disclosed by Company (statutory outer limit applies) |
Note: the record date and AGM have already occurred. Eligibility was determined by holdings as of 5 August 2026; investors buying on or after the ex-date were not entitled to this particular dividend.
Dividend Yield Analysis
The “175% dividend” illusion
Indian companies quote dividends as a percentage of face value. Sika’s ₹3.50 on a ₹2 face value equals a 175% dividend — a big-sounding number that has nothing to do with what you earn on your investment. Face value is an accounting figure (₹2), not the price you pay (~₹1,100). The number that matters is the real yield on the market price.
Yield at current market price (~₹1,100)
0.32%
₹3.50 ÷ ₹1,100
Yield at announcement price (~₹1,090)
~0.32%
Announcement-date price is approximate — verify vs exchange records
Reality check: A ~0.32% yield is far below a bank fixed deposit or a typical dividend-yield stock. That is normal for Sika — the stock trades at ~64x earnings and ~15x book value because investors are paying for aerospace and defence growth, not income. The dividend here is a token cash return on top of an expected-capital-appreciation thesis, not the reason to own the stock.
Dividend History Analysis
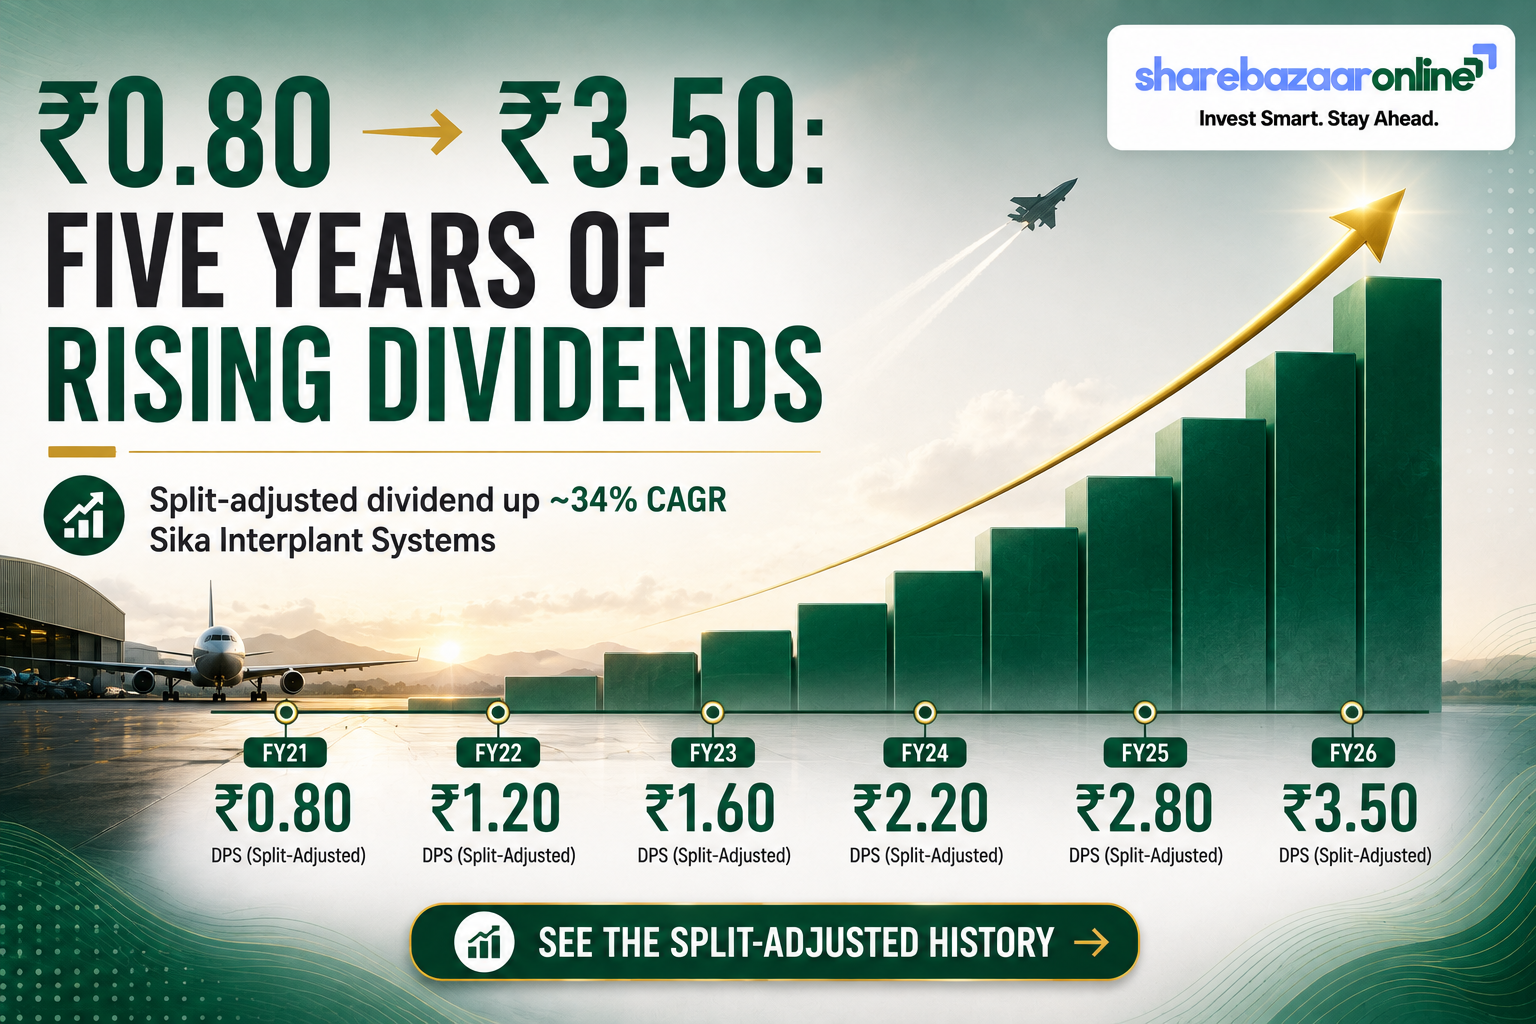
Why the raw history is misleading: the 1:5 stock split
Sika executed a 1:5 stock split (effective 17 March 2025), cutting the face value from ₹10 to ₹2. A quick glance at the raw record shows a ₹10 dividend in FY24 followed by ₹2.40 in FY25 — which looks like a savage cut. It was not. After the split, one old ₹10 share became five ₹2 shares. Restated on a like-for-like (split-adjusted) basis, the payout has actually risen every year.
| Financial Year | Headline DPS | Split-Adjusted DPS (per ₹2 share) | Payout Ratio |
|---|---|---|---|
| FY21 | ₹4.00 (on ₹10 FV) | ₹0.80 | 14% |
| FY22 | ₹4.00 (on ₹10 FV) | ₹0.80 | 10% |
| FY23 | ₹4.00 (on ₹10 FV) | ₹0.80 | 19% |
| FY24 | ₹10.00 (on ₹10 FV) | ₹2.00 | 22% |
| FY25 | ₹2.40 (on ₹2 FV) | ₹2.40 | 20% |
| FY26 | ₹3.50 (on ₹2 FV) | ₹3.50 | ~20% |
Split-adjusted DPS growth (FY21→FY26)
~34% CAGR
₹0.80 → ₹3.50 over five years
Classification
Consistent Payer
Annual dividend paid every year; no suspensions; steady payout band of ~10–22%
Takeaway: On a like-for-like basis Sika is a consistent and rising dividend payer, but it deliberately keeps the payout low (~20% of profit) and reinvests the rest. This is a growth-first, dividend-second capital policy — consistent, but never a high yield.
Financial Performance Analysis
Full-year FY26: positive operating leverage
On a consolidated basis, FY26 was a strong year and profits grew even faster than sales — a sign of operating leverage playing out:
Revenue Growth
+42.6%
Operating Profit Growth
+55.2%
Net Profit Growth
+39.0%
Operating margin expanded to ~21% (FY26) from ~20% (FY25). PAT grew a little slower than operating profit because of a higher tax rate and lower “other income” in FY26.
Earnings quality: how “clean” is the profit?
FY26 other income was ~₹5 Cr against a profit before tax of ~₹49 Cr — roughly a tenth of PBT. The bulk of profit is operating, not treasury-driven, which is healthy. Notably, other income actually fell year-on-year even as operating profit surged, so the earnings growth is core-business led.
The quarterly warning sign
Against the strong annual story sits a soft finish: Q4 FY26 revenue of ~₹41 Cr was the lowest in seven quarters, down ~10% YoY and ~18% QoQ. Q4 net profit slipped ~1% YoY and ~17% QoQ. Margins held up (Q4 OPM ~25%), so this looks like order-execution timing in a lumpy project business rather than a margin collapse — but it bears watching.
Cash Flow Analysis
Reported profit is an opinion; cash is a fact. The best news in the FY26 numbers is on the cash flow statement: operating cash flow rebounded to ~₹47 Cr from just ~₹8 Cr in FY25, and free cash flow reached ~₹46 Cr. Cash conversion (operating cash flow to operating profit) was ~131% — the company collected more cash than it booked as operating profit.
Operating Cash Flow FY26
~₹47 Cr
Free Cash Flow FY26
~₹46 Cr
Dividend Outflow
~₹7.42 Cr
Working capital was the swing factor
The FY25 cash flow was weak because working capital ballooned (debtor days had risen to ~80). In FY26 this reversed sharply — debtor days fell to ~18 and working-capital days to ~13. That collection discipline is what turned ~₹8 Cr of operating cash into ~₹47 Cr. The ₹3.50 dividend is comfortably funded from current-year free cash flow, not from reserves, asset sales or borrowings.
Balance Sheet Strength
Debt-free with a growing treasury
- Borrowings: ~₹0 Cr — effectively debt-free
- Investments (treasury): ~₹81 Cr (up from ~₹38 Cr in FY25)
- Reserves: ~₹152 Cr
- Book value per share: ~₹73
Returns on capital
ROCE (FY26)
~34.6%
ROE (FY26)
~25.1%
High returns on capital with no leverage — the returns are earned on operating assets, not financial gearing.
Balance-sheet read: This is a conservatively financed company. The treasury nearly doubled in FY26, which means the small dividend leaves plenty of retained capital for order execution, capacity or bolt-on opportunities. The financial risk attached to the dividend is very low.
Dividend Sustainability Analysis
We test the ₹3.50 payout against four independent coverage measures. The dividend passes all four with wide margins.
1. Earnings Coverage (EPS ÷ DPS)
4.9x ✔
EPS ₹17.19 covers ₹3.50 nearly five times over
2. Operating Cash Flow Coverage
6.3x ✔
~₹47 Cr OCF vs ~₹7.42 Cr outflow
3. Free Cash Flow Coverage
6.2x ✔
~₹46 Cr FCF vs ~₹7.42 Cr outflow
4. Cash / Liquidity Coverage
10.9x ✔
~₹81 Cr treasury vs ~₹7.42 Cr outflow; zero debt
Overall Verdict
Sustainable (4 of 4 tests passed)
With a ~20% payout ratio, near-5x earnings cover, 6x+ cash-flow cover and a debt-free balance sheet, the dividend is highly sustainable at current levels. The greater risk to future dividends is not affordability but capital-allocation choice — management may prefer to keep reinvesting for growth rather than raise the payout materially.
Peer Comparison
| Company (Aerospace & Defence) | Dividend Yield | Payout Ratio | ROE | ROCE |
|---|---|---|---|---|
| Sika Interplant Systems | ~0.32% | ~20% | ~25.1% | ~34.6% |
| Astra Microwave Products | ~0.23% | ~14% | Not independently verified | Not independently verified |
| Data Patterns / MTAR / Zen / DCX (cohort) | Nil–negligible | Low / reinvesting | Not independently verified | Not independently verified |
Peer cells left as “Not independently verified” are intentionally not populated to avoid presenting unverified figures. Peer dividend policies change each results season — confirm before relying on them.
How Sika stacks up: The listed aerospace and defence small-cap cohort is dominated by high-growth companies that pay little or no dividend, preferring to reinvest. Against that backdrop, Sika’s ~20% payout and consistent annual dividend actually make it relatively shareholder-friendly on distribution, while its ROCE of ~34.6% and debt-free balance sheet are among the stronger capital-efficiency profiles in the group. The yield is still low in absolute terms because the whole sector trades at premium growth multiples.
Promoter Impact Analysis
Who receives the ₹7.42 Cr?
- Promoter group (~71.72%): ~₹5.32 Cr
- FIIs (~3.25%), DIIs (~0.04%) & Public (~24.98%): ~₹2.10 Cr
Promoter holding is via Ultraweld Engineers Pvt Ltd (per public filings).
Alignment read
With over 71% of the company, promoters receive the lion’s share of any dividend. That said, the payout is deliberately small (~20%), so most profit stays inside the company — this is not a case of a promoter using dividends to extract cash from a mature business. The bigger promoter-alignment fact is that shareholding has been stable at ~71.72% for years, with no dilution.
Minority-shareholder view: Retail and institutional investors together collect roughly ₹2.1 crore. The far larger benefit for minority holders comes from reinvested profit compounding at a high ROCE, not from the dividend cheque itself. The retail shareholder base has expanded dramatically — from ~6,400 holders (Sep 2023) to ~27,000 (Jun 2026) — a sign the split and rally widened ownership.
Taxation Analysis
How dividends are taxed in India
Since April 2020, dividends are taxable in the hands of the shareholder at their applicable income-tax slab rate (there is no separate Dividend Distribution Tax anymore). The company deducts TDS at 10% under Section 194 only if total dividends paid to a resident shareholder exceed ₹10,000 in a financial year. The dividend adds to your total income and is taxed accordingly; TDS is adjusted against your final liability.
Worked example — a retail investor with 1,000 shares
| Shares held | 1,000 |
| Dividend per share | ₹3.50 |
| Gross dividend | ₹3,500 |
| TDS u/s 194 (below ₹10,000 threshold) | ₹0 |
| Tax at 30% slab | ₹1,050 |
| Net dividend in hand | ₹2,450 |
| Effective post-tax yield (at CMP ₹1,100) | ~0.22% |
For a 30%-slab investor, a ~0.32% pre-tax yield becomes ~0.22% after tax. A large holder crossing ₹10,000 of total dividends would see 10% TDS deducted at source, then reconcile the balance at their slab rate when filing. Tax treatment depends on individual circumstances; this is a general illustration, not tax advice.
Key Risks
1. Very low income yield. At ~0.32%, the dividend is negligible as income. Anyone buying Sika for yield is in the wrong stock; the return case rests entirely on earnings growth and price appreciation.
2. Rich valuation. The stock trades at ~64x earnings and ~15x book value. At these multiples, any slowdown in growth can hurt the price far more than the tiny dividend can cushion — the shares are already down meaningfully from their 52-week high.
3. Lumpy, project-based revenue. Q4 FY26 revenue was a seven-quarter low, down ~10% YoY and ~18% QoQ. Quarter-to-quarter results swing with order execution, so single-quarter softness is a recurring feature and can spook the market.
4. Customer and sector concentration. The business depends on Aerospace, Defence & Space and Automotive programmes, where order flow is tied to government budgets, defence-indigenisation policy and a limited set of large customers and OEM tie-ups (for example MRO licences with global partners). Delays or policy shifts feed straight into revenue.
5. Small-cap liquidity and disclosure exposure. Sika is a small-cap; trading can be thin and price moves sharp. Public filings note the exchange has, at times, sought clarification on price movement, and the company has previously revised results to correct discrepancies — ordinary for a company of this size, but a reminder to read filings closely.
What To Monitor
1. Order book and fresh order inflow. In a project business, the forward order book is the single best predictor of revenue. Watch exchange announcements of new orders and MRO / licence agreements.
2. Quarterly revenue recovery. Track whether the Q4 FY26 dip reverses in the coming quarters, or whether it signals a genuine demand or execution slowdown.
3. Working capital discipline. Debtor days improved from ~80 to ~18 in FY26 — the key driver of the cash-flow jump. Any relapse would weaken free cash flow and, indirectly, dividend headroom.
4. Payout-ratio policy. The payout has sat around ~20% for years. A move up would signal management sees fewer reinvestment opportunities; a move down would signal a bigger growth or capex pipeline.
5. Margin trajectory. Operating margin has climbed steadily toward ~21% (and ~25% in Q4). Sustaining or expanding margins as revenue grows is central to the earnings-growth thesis that justifies the valuation.
Conclusion
Sika Interplant Systems’ FY26 final dividend of ₹3.50 per share is best understood as a small, disciplined, fully cash-funded distribution sitting on top of a high-growth aerospace and defence engineering story. The “175% dividend” headline flatters; the real yield is ~0.32%. On a split-adjusted basis the payout has grown consistently (~34% CAGR over five years), and it clears every sustainability test comfortably — near-5x earnings cover, 6x+ free-cash-flow cover, a debt-free balance sheet and a growing ~₹81 Cr treasury.
The positives are strong operating leverage, excellent returns on capital (ROCE ~34.6%) and a rebound in cash conversion. The negatives are a rich ~64x valuation, a soft Q4 that hints at lumpy demand, and a yield too small to matter for income. Weigh the growth case against the valuation and the quarterly volatility, and decide for yourself — this analysis is informational and does not recommend buying, selling or holding the stock.
Frequently Asked Questions
What dividend has Sika Interplant Systems announced for FY 2025-26?
What is the Sika Interplant Systems dividend yield?
What was the record date for the Sika Interplant dividend?
What is the ex-date for this dividend?
When will the Sika Interplant dividend be paid?
Who was eligible to receive the dividend?
How is this dividend taxed?
Is the Sika Interplant dividend sustainable?
What is Sika Interplant Systems’ dividend history?
Why did the dividend “fall” from ₹10 to ₹2.40 after FY24?
What should investors monitor going forward?
Is Sika Interplant a good dividend stock for income investors?
How much of the dividend goes to promoters?
Disclaimer
ShareBazaar Online is not registered with SEBI as an investment adviser or research analyst. This article is for informational and educational purposes only and does not constitute investment, financial, legal or tax advice, nor a recommendation to buy, sell or hold any security. Figures are compiled from company exchange filings and third-party financial data sources (including Screener.in, BSE announcements and corporate-action aggregators) believed to be reliable but not independently guaranteed; some data points — notably the announcement-date price and the exact dividend payment date — are approximate or were Not Disclosed by Company and should be verified against primary exchange records. All yield figures depend on the live market price and change continuously. Past performance and past dividends are not indicative of future results. Investing in equities carries risk, including loss of capital. Please consult a SEBI-registered adviser and conduct your own due diligence before making any investment decision.