
Dividend Snapshot
Gandhi Special Tubes Limited (NSE: GANDHITUBE | BSE: 513108) has recommended a final dividend of ₹15 per equity share (300% on a face value of ₹5) for the financial year ended 31 March 2026, alongside a separate share buyback. The dividend is subject to shareholder approval at the 41st Annual General Meeting. On the current market price of about ₹882, the ₹15 payout works out to a dividend yield of roughly 1.70% — a useful reminder that a big-sounding "300%" headline is a percentage of face value, not of what you actually pay for the share.
Dividend At A Glance
- Dividend TypeFinal Dividend
- Dividend Per Share₹15.00
- Dividend %300% (on ₹5 FV)
- Financial YearFY 2025-26
- Record Date5 August 2026
- PaymentOn or before 11 Sep 2026
Key Metrics
- Dividend Yield (at ₹882)~1.70%
- Total Dividend Outflow₹18.23 Cr
- Dividend Payout Ratio~26.7% of PAT
- Earnings Coverage3.75x
- Cash & Investments~₹220 Cr
- Net DebtNil (debt-free)
Market price, yield, ROE/ROCE and peer figures are sourced from Screener.in / exchange data and are indicative as of early August 2026. All dividend-specific figures are from the company's 25 May 2026 board-outcome filing. CMP is price-dependent and should be re-verified before acting.
Dividend Announcement Summary
At its board meeting on Monday, 25 May 2026, the Board of Directors of Gandhi Special Tubes approved the audited results for the quarter and year ended 31 March 2026 and recommended a final dividend of ₹15 per share. Because this is a final dividend, it must be approved by members at the AGM before it can be paid. The board fixed 5 August 2026 as the record date and stated the dividend, if approved, will be paid on or before 11 September 2026.
The bigger story: a twin capital return
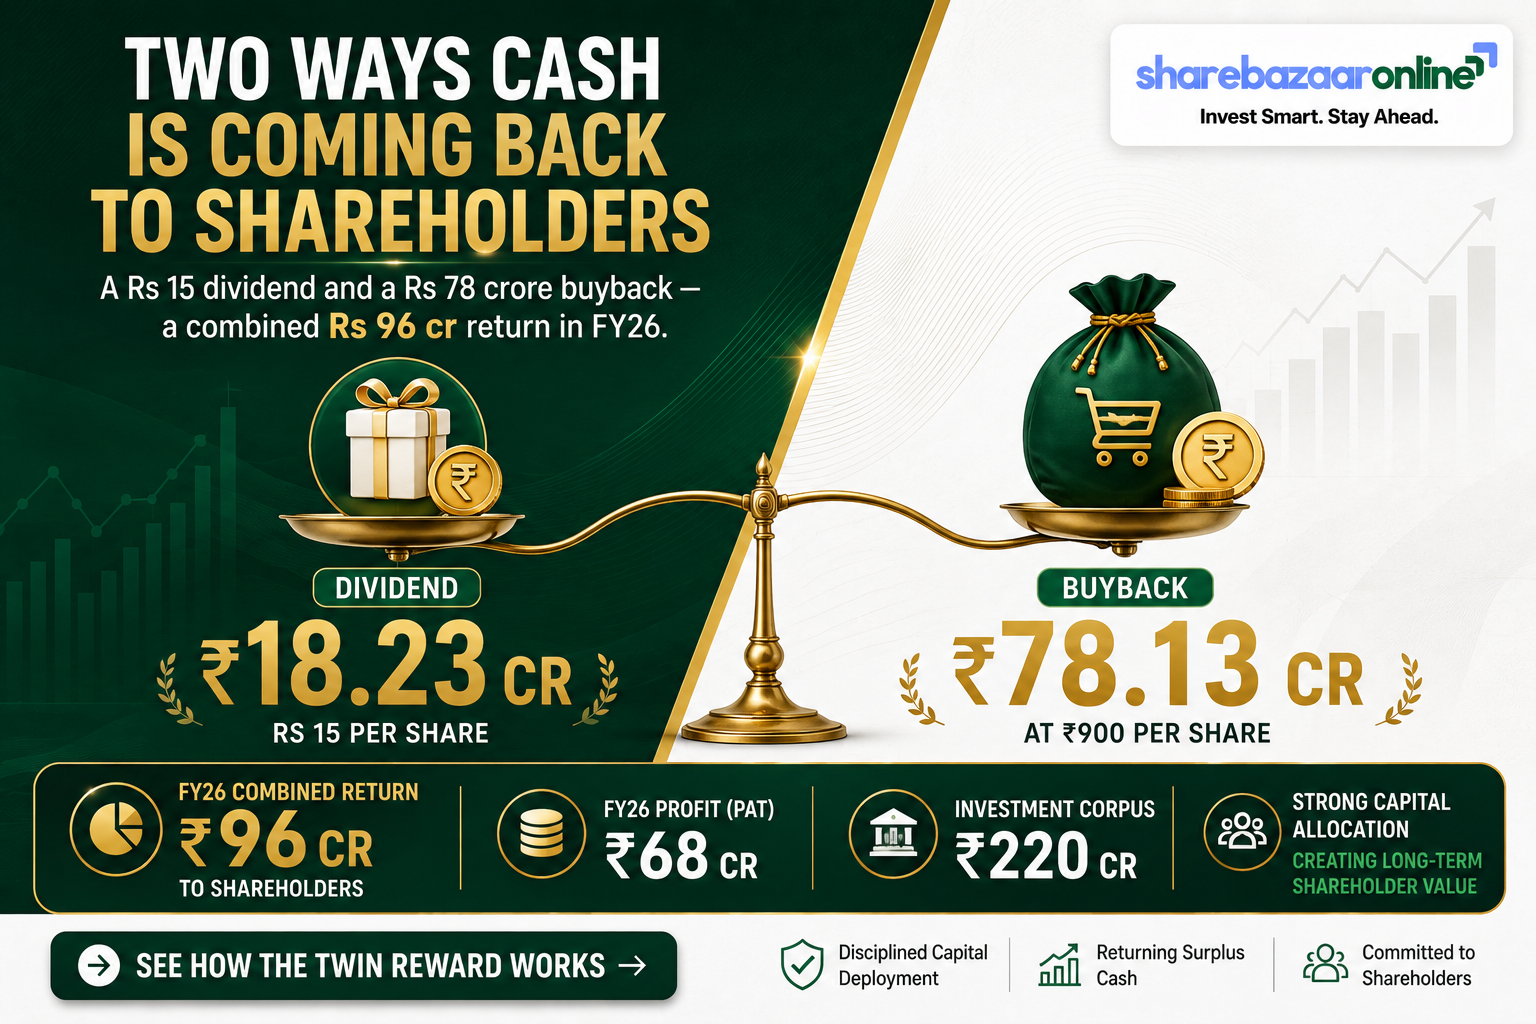
The same board meeting approved a buyback of up to 8,68,100 equity shares at a maximum price of ₹900 per share, an outlay of up to ₹78.13 crore representing 7.14% of paid-up capital, through the tender-offer route. Some promoter-group members have indicated they will participate. Taken together, the dividend (₹18.23 Cr) and buyback (up to ₹78.13 Cr) add up to a combined shareholder return of roughly ₹96 crore — about 141% of the company's FY26 net profit of ₹68.36 crore. This is only possible because the company sits on a large investment corpus built up over years of debt-free cash generation. The buyback is subject to a separate special resolution and is not covered in detail in this dividend-focused note.
What the market did — and why it matters
Counter-intuitively, the stock fell roughly 11-12% the session after this "double reward" announcement. Two things weighed on sentiment: the buyback price of ₹900 was only a modest premium (~2-5%) to the prevailing market price, and the March-quarter reported profit declined about 21.6% year-on-year because of a one-time mark-to-market loss on mutual-fund investments (more on this in the Financial Performance section). The dividend itself was held flat at ₹15, unchanged from FY25.
Key Dates Timeline
- Board Meeting / Announcement25 May 2026
- Record Date5 August 2026
- Ex-Dividend Date5 August 2026*
- 41st AGM (approval)12 August 2026
- Payment (latest)On or before 11 Sep 2026
How to read these dates
Under India's T+1 settlement, the ex-date and record date fall on the same day. To be eligible, you needed to hold the shares at the end of the record date; buying on the ex-date itself does not qualify you. Note the record date (5 Aug) falls a week before the AGM (12 Aug) that actually approves the dividend — this is normal for final dividends, where the company first freezes the eligible shareholder list and then pays after AGM sanction.
*Ex-date confirmed as 5 Aug 2026 by exchange/aggregator data. As of this article's date, the record date has passed and the AGM approval is due on 12 Aug 2026.
Dividend Yield Analysis
The "300%" headline vs. the real yield
"300% dividend" simply means ₹15 on a ₹5 face value. The number that matters to a buyer is the yield on the market price. At the current price of about ₹882, the ₹15 dividend is a yield of only ~1.70%. At the pre-announcement price of roughly ₹961, it was closer to 1.56%; even after the post-results dip toward ₹859, the yield was about 1.75%. In other words, whichever price you use, this is a modest-yield, quality-compounder stock, not a high-yield income play.
Yield At Different Prices
- At ₹961 (pre-announcement)1.56%
- At ₹882 (current)1.70%
- At ₹859 (post-results)1.75%
- 52-week high ₹1,0321.45%
- 52-week low ₹6502.31%
Yield reality check
The yield here is driven by a steady dividend on a fairly expensive share, not by a collapsing price or a one-off special payout. Because the dividend has stayed flat at ₹15 while the stock has traded between ₹650 and ₹1,032 over the past year, the yield has simply moved inversely with price. Investors chasing the "300%" figure without adjusting for the share price will badly overestimate the cash return.
Dividend History Analysis
Final Dividend Per Share — Last 5 Years
| Financial Year | Dividend / Share | EPS (₹) | Payout % |
|---|---|---|---|
| FY22 | ₹10 | 31.74 | ~32% |
| FY23 | ₹12 | 38.96 | ~31% |
| FY24 | ₹13 | 45.74 | ~28% |
| FY25 | ₹15 | 48.28 | ~31% |
| FY26 | ₹15 | 56.26 | ~27% |
Per-share dividends inferred from company payout ratios and EPS (Screener.in) and cross-checked against cash-flow "dividend paid" lines; cumulative FY22-FY26 payout of ~₹65/share is consistent with aggregator records.
Payer classification
Gandhi Special Tubes is a Consistent Payer. It has paid a dividend every year for well over a decade, with a steadily rising rupee payout (₹10 → ₹12 → ₹13 → ₹15) and a disciplined payout ratio that has hovered around 28-31% of profit in recent years. It has also periodically returned surplus cash through buybacks (including a ₹500/share tender in 2017-18).
The one nuance to note
After four years of increases, the FY26 dividend was held flat at ₹15 even though EPS rose ~16% to ₹56.26. Rather than raising the regular dividend, management chose to route additional surplus through the ₹78 crore buyback. That is a capital-allocation choice, not a sign of weakness — but income-focused holders should note the regular dividend did not grow this year.
Financial Performance Analysis
FY26 vs FY25 (Standalone, ₹ Crore)
| Particulars | FY26 | FY25 | Growth |
|---|---|---|---|
| Revenue from Operations | 191.77 | 172.54 | +11.15% |
| Operating EBITDA | 83.58 | 68.39 | +22.22% |
| EBITDA Margin | 43.6% | 39.6% | +4.0 pts |
| Other Income | 11.84 | 11.90 | flat |
| Exceptional Item | (0.93) | — | — |
| Profit Before Tax | 90.98 | 76.75 | +18.5% |
| Net Profit (PAT) | 68.36 | 58.67 | +16.52% |
| EPS (₹) | 56.26 | 48.28 | +16.5% |
Operating leverage worked in shareholders' favour
The full-year story is genuinely strong: revenue rose 11.2% but operating EBITDA rose 22.2%, with margins expanding from 39.6% to 43.6%. That is positive operating leverage — costs grew slower than sales. PAT still grew a healthy 16.5%, though slightly slower than EBITDA because of a ₹0.93 crore exceptional charge (a Labour Code gratuity/leave provision) and flat other income.
The Q4 optical illusion — read carefully
Wire headlines said "Q4 profit down 22%." Look closer: Q4 revenue actually rose ~9% and Q4 operating margins stayed above 41%. The reported profit fell only because other income turned negative — a loss of about ₹5.47 crore from marking mutual-fund investments to fair value at year-end. That is a non-cash, non-operating, investment-book swing, not a deterioration in the core tube business. It is an earnings-quality flag worth understanding, not a business red flag.
Return ratios & valuation
Gandhi Special Tubes earns high returns on capital: ROCE ~28.4% and ROE ~20% (Screener.in), with a 5-year average ROE around 22% — strong for a steel-tube maker and helped by an asset-light, cash-rich balance sheet. The stock trades at a P/E of ~18.5 and P/B of ~3.4 on a book value of about ₹260. The main fundamental caveat flagged by data providers is modest sales growth (~11% over five years) — this is a steady compounder, not a fast grower.
Cash Flow Analysis
Reported profit is an opinion; cash is a fact. On this test Gandhi Special Tubes does well. In FY26 it generated operating cash flow of ₹55.20 crore and, after a small ₹1.99 crore of capex, free cash flow of about ₹53.21 crore. Against a dividend outflow of just ₹18.23 crore, the payout is comfortably funded by the business itself.
Cash Flow Coverage of Dividend
- Operating Cash Flow (FY26)₹55.20 Cr
- Free Cash Flow (FY26)₹53.21 Cr
- Dividend Outflow₹18.23 Cr
- OCF Coverage3.03x
- FCF Coverage2.92x
Cash vs earnings — a clean picture
OCF of ₹55.2 crore against PAT of ₹68.4 crore gives a cash conversion (CFO/OP) of about 93%, in line with the company's long-run history. There is no worrying gap between profits and cash. The dividend is funded from current operating earnings — not from reserves, asset sales or borrowings. The buyback, by contrast, will draw down the investment corpus, which is exactly what a cash pile that large is for.
One thing to watch: the working-capital drag
The one soft spot is inventory. Inventory days have crept up to about 313 days and the cash conversion cycle to roughly 341 days in FY26, higher than a few years ago. Rising inventory absorbed cash during the year (an outflow of about ₹10.9 crore in working capital). It did not dent this year's dividend cover, but it is worth monitoring — a lengthening cash cycle can quietly pressure free cash flow if it continues.
Balance Sheet Strength
Key Balance Sheet Items (31 Mar 2026)
- Total Equity (Net Worth)₹315.95 Cr
- Investments (non-current)₹207.43 Cr
- Current Investments₹6.06 Cr
- Cash & Bank Balances₹6.63 Cr
- Total Cash + Investments~₹220.13 Cr
- BorrowingsNil
A fortress balance sheet
The company is effectively debt-free (only tiny lease liabilities) and carries a treasury of about ₹220 crore in investments and cash — roughly two-thirds of its entire balance sheet. Reserves have grown from ₹176 crore (FY23) to about ₹310 crore (FY26). This is the reason a company earning ₹68 crore can comfortably fund a combined ₹96 crore dividend-plus-buyback: it is returning accumulated surplus, not over-distributing current profit.
Cash coverage of the dividend is about 12x (₹220 crore of liquid assets against an ₹18.23 crore payout). Even after funding the full ₹78 crore buyback, the company would retain well over ₹140 crore of investments — so the dividend faces no affordability question from the balance sheet.
Dividend Sustainability Analysis
Four-Test Sustainability Scorecard
| Test | Metric | Verdict |
|---|---|---|
| Earnings Coverage | EPS ₹56.26 vs DPS ₹15 = 3.75x | Pass |
| OCF Coverage | ₹55.2 Cr vs ₹18.23 Cr = 3.03x | Pass |
| FCF Coverage | ₹53.2 Cr vs ₹18.23 Cr = 2.92x | Pass |
| Cash / Liquidity Coverage | ₹220 Cr vs ₹18.23 Cr = 12.08x | Pass |
Verdict: Sustainable
The ₹15 dividend passes every coverage test with a wide margin. Earnings are growing, cash generation is strong, debt is nil, and the payout ratio (~27%) leaves plenty of room. The regular dividend looks highly sustainable. The only forward-looking flags are the ones noted elsewhere — slow top-line growth and a lengthening inventory cycle — and the fact that this year's growth in shareholder return came via a one-off buyback rather than a higher recurring dividend, so a repeat ₹78 crore buyback next year should not be assumed.
Peer Comparison
Steel Tubes & Pipes Peers (latest available)
| Company | Div/Share | Div Yield | Payout | ROE | Debt |
|---|---|---|---|---|---|
| Gandhi Special Tubes | ₹15 | ~1.70% | ~27% | ~20% | Nil |
| Ratnamani Metals & Tubes | ₹10 (FV ₹2) | ~0.46% | ~13% | NIV | Almost nil |
| Maharashtra Seamless | ₹10 (FV ₹5) | ~1.8% | ~17% | NIV | Almost nil |
Peer dividend/yield/payout figures sourced from company FY26 announcements and Screener.in / Simplywall.st / Tickertape. Cells marked "NIV" (Not Independently Verified) are left unfilled rather than estimated. Peers differ in size and end-markets; comparison is directional.
Where Gandhi sits
On yield, Gandhi Special Tubes sits in the middle of its peer set — higher than the much larger Ratnamani (~0.46%), broadly similar to Maharashtra Seamless (~1.8%). Its distinguishing features are a higher payout ratio (~27% vs ~13-17%) and a consistently debt-free, cash-rich profile shared by the better names in the group. It is a small-cap (market cap ~₹1,072 crore) niche player in small-diameter seamless/welded tubes and coupling nuts, largely serving auto and engineering OEMs.
Promoter Impact Analysis
Shareholding & Dividend Split
- Promoter & Group Holding73.53%
- FII / FPI1.26%
- NRIs / Foreign~1.42%
- Public / Others~23.7%
- Promoter Dividend Income~₹13.40 Cr
- Public/Other Dividend Income~₹4.83 Cr
Who benefits, and how
With a 73.53% promoter holding, roughly ₹13.4 crore of the ₹18.23 crore dividend flows to the promoter group, and about ₹4.8 crore to public shareholders — proportionate to holdings, so the dividend treats all shareholders equally per share. The buyback is different: because some promoters have said they will participate in the tender, the ₹78 crore buyback is a route through which promoters can also monetise part of their stake at ₹900. Minority investors should read the eventual buyback letter of offer to understand the acceptance ratio and how much of it promoters take up.
Taxation Analysis
How dividends are taxed in India (FY 2025-26)
Since the abolition of Dividend Distribution Tax, dividends are taxed in the hands of the shareholder at their applicable income-tax slab rate. The company deducts TDS at 10% under Section 194 if total dividend paid to a resident exceeds ₹10,000 in a financial year (this threshold was raised from ₹5,000 in Budget 2025). Without a valid PAN, TDS is 20%. The TDS is not an extra cost — it is adjusted against your final tax liability when you file your return.
Worked Example — 1,000 Shares, 30% Slab
- Shares held1,000
- Dividend @ ₹15/share (gross)₹15,000
- TDS @10% (dividend > ₹10,000)₹1,500
- Amount credited after TDS₹13,500
- Final tax @ 30% + 4% cess (31.2%)₹4,680
- Net dividend in hand (after full tax)₹10,320
- Post-tax yield (on ₹882)~1.17%
Illustration only; ignores surcharge (which can apply at higher income levels, capped at 15% on dividend income) and assumes the old/new regime slab of 30%. Consult a tax adviser for your own situation.
Key Risks
- Slow revenue growth: Sales have compounded at only ~11% over five years and ~5% over three years. A high-payout, high-ROE profile cannot fully offset a slow-growing top line if end-markets stay soft.
- Auto/engineering cyclicality & concentration: The company supplies OEMs in autos, farm and construction equipment. A downturn in these customer industries, or loss of a key OEM, would hit tube volumes directly.
- Investment-income volatility: A large chunk of the balance sheet sits in mutual funds and investments. As Q4 FY26 showed, mark-to-market swings can add a ₹5+ crore hit (or gain) to reported profit that has nothing to do with the core business.
- Working-capital / inventory build-up: Inventory days (~313) and the cash conversion cycle (~341 days) have lengthened, tying up cash and pressuring future free cash flow if the trend continues.
- Raw-material (steel) price and margin risk: Steel is the primary input; sharp swings in steel prices can compress margins if not passed through to OEM customers.
- Flat regular dividend: The recurring dividend did not rise in FY26; additional returns came via a one-off buyback that may not recur, so income growth is not guaranteed.
What To Monitor
- AGM outcome (12 Aug 2026): Confirm shareholder approval of the ₹15 dividend and the buyback special resolution.
- Buyback letter of offer: Watch for the record date, acceptance ratio, small-shareholder reservation, and how much the promoter group actually tenders.
- Revenue growth trajectory: Look for the top line to break out of its ~11% band — new products, capacity utilisation, or OEM wins.
- Inventory & cash conversion cycle: Watch whether inventory days revert toward historical norms or keep climbing.
- Operating margin durability: FY26 margins expanded to ~43.6%; monitor whether this holds against steel-price and cost pressures.
- Payout policy signal: Whether next year's return comes as a higher recurring dividend or another buyback tells you how management thinks about capital allocation.
Conclusion
Gandhi Special Tubes' FY26 ₹15 final dividend is a small-yield payout from a high-quality, debt-free compounder. The "300%" label is a face-value artifact; the real yield is about 1.70%. What makes this announcement notable is the pairing of the dividend with a ₹78 crore buyback, so the combined shareholder return (~₹96 crore) exceeds the year's net profit — funded painlessly by a ₹220 crore investment corpus.
Positives
- Dividend covered 3.75x by earnings and ~12x by cash
- Debt-free, ~₹220 Cr treasury, ROE ~20% / ROCE ~28%
- Full-year margins expanded to ~43.6%; PAT +16.5%
- Consistent payer plus buyback-based capital return
Negatives / Watch-outs
- Low headline yield (~1.7%); flat regular dividend
- Slow ~11% revenue growth; lengthening inventory cycle
- Q4 profit optically hit by MF fair-value loss
- Buyback-led return may not repeat next year
This section presents positives, negatives, risks and monitoring factors so readers can decide for themselves. It is not a buy, sell or hold recommendation.
Frequently Asked Questions
What dividend has Gandhi Special Tubes announced for FY26?
What is the Gandhi Special Tubes dividend yield?
What is the record date for the dividend?
What is the ex-dividend date?
When will the dividend be paid?
Who is eligible to receive the dividend?
How is this dividend taxed?
Is the Gandhi Special Tubes dividend sustainable?
What is the company's dividend history?
Why did the share price fall after a dividend and buyback were announced?
What is the difference between the dividend and the buyback?
What should investors monitor going forward?
Disclaimer
This article is for informational and educational purposes only and does not constitute investment, financial or tax advice, nor a recommendation to buy, sell or hold any security. ShareBazaar Online is not a SEBI-registered investment adviser. Dividend, buyback and financial figures are drawn from the company's exchange filing dated 25 May 2026; market price, yield, ROE/ROCE, peer and taxation data are sourced from Screener.in and other public sources and are indicative as of early August 2026. Market prices and yields change continuously — verify the live price before acting. The dividend is subject to shareholder approval at the AGM. Readers should conduct their own research and consult a qualified financial adviser before making any investment decision.