
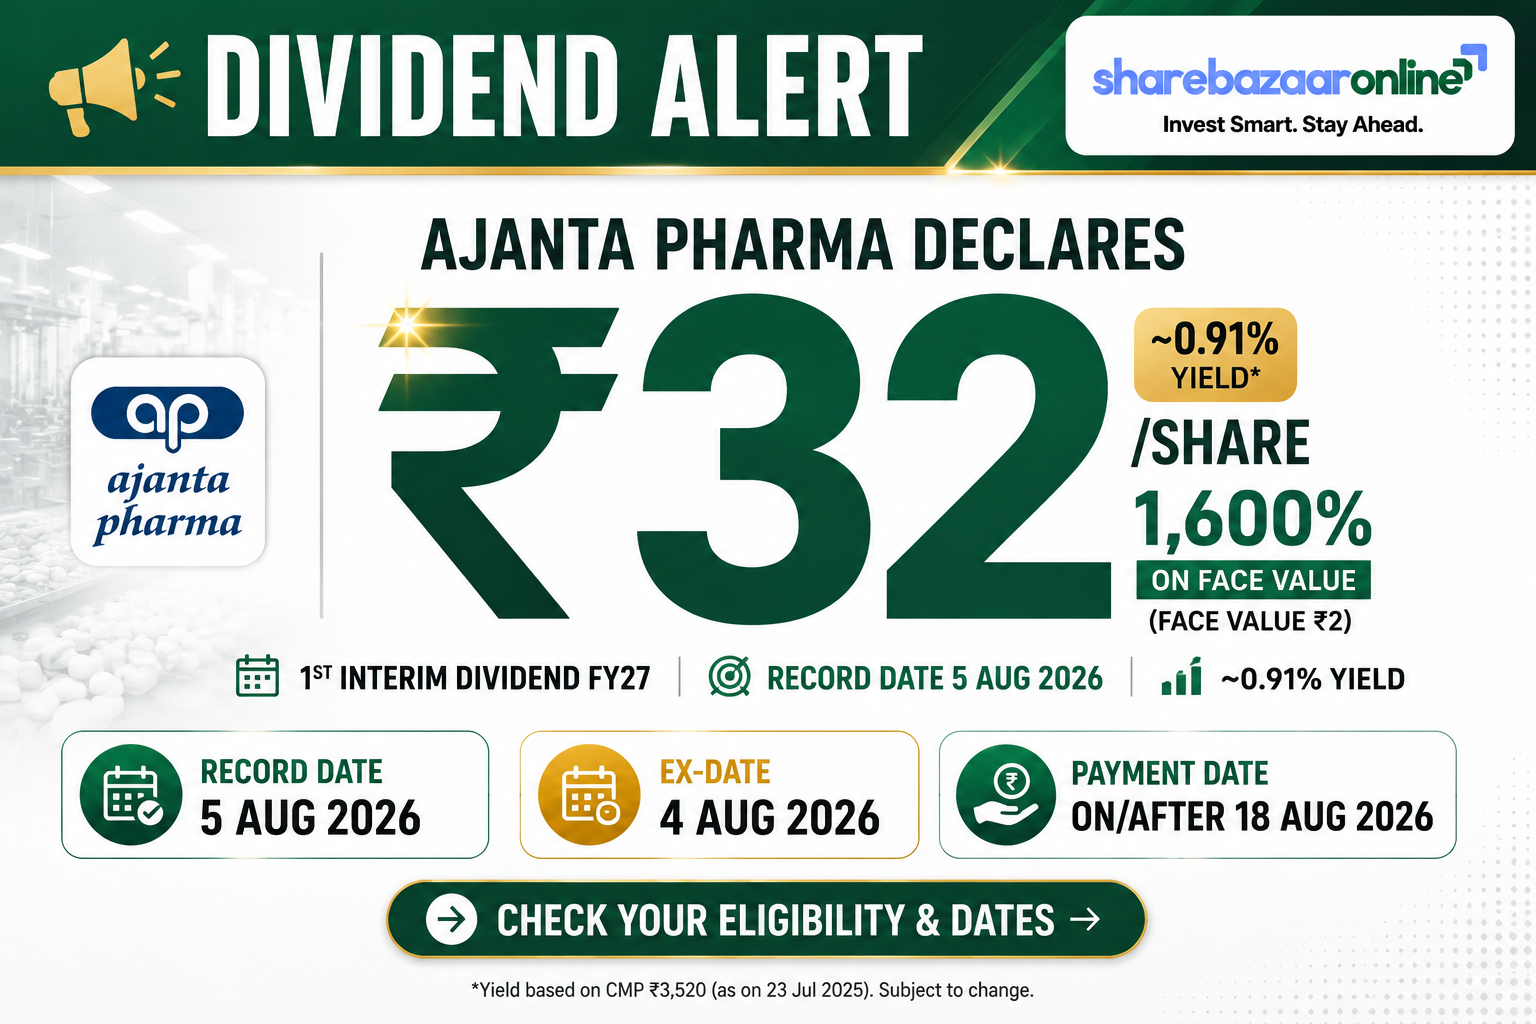
Dividend Snapshot
Ajanta Pharma Limited (NSE: AJANTPHARM | BSE: 532331 | ISIN: INE031B01049) has declared its 1st Interim Dividend for FY 2026–27 of ₹32 per share on a face value of ₹2. In headline terms this is a 1,600% dividend — but that percentage is calculated on the tiny ₹2 face value, not on the market price. On the current price the real cash return works out to about 0.91%.
Dividend Per Share
₹32.00
Face value ₹2 · equals 1,600% on face value
Dividend Yield (on CMP ₹3,533)
~0.91%
Event-only yield · price-dependent, re-verify at publish
Dividend Type
1st Interim
For FY 2026–27 · no AGM approval needed
Total Dividend Outflow
₹399.79 Cr
On ~12.49 crore eligible shares
Record Date
Wed, 5 August 2026
Payment
On or after 18 August 2026
The one line that matters: The payout is comfortably covered by profit (EPS covers the dividend 2.6 times), yet it lands in a year where the company’s free cash flow fell about 80% — a gap between reported profit and actual cash that the rest of this analysis unpacks.
Dividend Announcement Summary
At its board meeting on 30 July 2026, the Board of Directors of Ajanta Pharma approved the unaudited Q1 FY2027 results (quarter ended 30 June 2026) and declared the 1st interim dividend of ₹32 per share for FY 2026–27, amounting to ₹399.79 crore (the company rounded this to “₹400 crore” in its press note). The declaration was made under Regulations 42 & 43 of the SEBI (LODR) Regulations, 2015.
Why no AGM vote is needed
An interim dividend is declared by the Board itself. Unlike a final dividend, it does not require shareholder approval at the AGM, so the payout is effectively confirmed once the record date passes.
The quarter behind the payout
Q1 FY27 consolidated revenue rose ~25% to ₹1,626 cr and net profit rose ~31% to ₹334 cr (Q1 FY26: ₹255 cr). The strong quarter gave the Board the confidence to raise the interim payout from ₹28 last year to ₹32.
Auditor / contingency note: The results carry an emphasis-of-matter on the Income Tax search of August 2025 (block period 1 April 2019 to 17 November 2025); the company filed its return on 6 April 2026 and states the financial impact, if any, is currently not ascertainable. The auditor (B S R & Co. LLP) issued an unmodified conclusion. (Source: company filing, note 6.)
Key Dates Timeline
Announcement Date
30 July 2026 (Thursday)
Board meeting & Q1 FY27 results
Ex-Date
5 August 2026 (Wednesday)
Inferred: under T+1 settlement the ex-date typically coincides with the record date — confirm against the NSE/BSE corporate-action circular
Record Date
5 August 2026 (Wednesday)
Confirmed in the board outcome filing
Payment Date
On or after 18 August 2026
Company stated an outer/onward date, not a fixed day
To be eligible you needed to hold the shares as of the record date, 5 August 2026. Because Indian markets settle on a T+1 basis, buyers had to purchase on or before the ex-date to appear on the register in time. As this is published after the record date, eligibility is now fixed.
Dividend Yield Analysis
A “1,600% dividend” sounds enormous, but that number is simply ₹32 ÷ ₹2 face value. What actually reaches your pocket is measured against the market price, and there the yield is modest.
Yield on current price
₹32 ÷ ₹3,533 (CMP, 12 Aug 2026) = ~0.91%. (Source: Screener.in live quote.)
Yield on announcement-day price
₹32 ÷ ₹3,429.15 (BSE close, 30 Jul 2026) = ~0.93%.
Yield reality check — why the yield is low even though the dividend rose
The yield is low for a healthy reason, not a distressed one. The share price has re-rated sharply — up roughly 21% in a year and trading near its 52-week high of ₹3,599 (52-week low ₹2,330). When the price climbs faster than the dividend, the yield compresses. This is not a case of a falling price flattering the yield, nor a one-off special payout inflating it; it is a growing company whose valuation (P/E ~39×) simply outruns its cash payout. If you also count the ₹28 interim paid in November 2025, the trailing-12-month cash return is closer to ~1.7%, but on a like-for-like annual basis ₹32 is the relevant figure.
Dividend History Analysis
| Financial Year | Dividend / Share (₹)* | Payout Ratio | Note |
|---|---|---|---|
| FY19 | 6.00 | 20% | — |
| FY20 | 8.67 | 24% | — |
| FY21 | 6.33 | 13% | — |
| FY22 | 6.33 | 11% | — |
| FY23 | 7.00 | 15% | — |
| FY24 | 51.00 | 79% | 50th-anniversary special payouts (one-off) |
| FY25 | 28.00 | 38% | Policy reset to higher regular payout |
| FY26 | 28.00 | 33% | Single interim |
| FY27* | 32.00 | ~38% of FY26 PAT | 1st interim so far — highest regular interim ever |
*Per-share figures shown on the current ₹2 face value (adjusted for the earlier ₹5→₹2 stock split). Sourced from exchange filings and dividend aggregators (TipRanks, INDmoney, Screener.in); cross-referenced. FY27 shows the first interim only; a further interim in the year cannot be ruled out.
The comparability trap
FY24’s ₹51 looks like a huge cut to FY25’s ₹28. It was not a cut — FY24 included special dividends marking the company’s 50th year. Strip that out and the regular dividend has actually risen steadily: ₹7 (FY23) → ₹28 (FY25/FY26) → ₹32 (FY27).
Classification: Consistent & rising payer
Ajanta has paid a dividend every year for the last decade and has structurally lifted its payout policy from the low teens (11–15%) to the 33–38% range since FY24. The ₹32 interim continues that upward trajectory.
Financial Performance Analysis
Q1 FY27 vs Q1 FY26 (Consolidated, ₹ crore)
| Metric | Q1 FY26 | Q1 FY27 | Growth |
|---|---|---|---|
| Revenue from operations | 1,302.65 | 1,625.96 | +24.8% |
| Adjusted EBITDA (excl. forex) | 377 | 454 | +20.4% |
| Profit before tax | 331.13 | 446.80 | +34.9% |
| Net profit (PAT) | 255.34 | 334.22 | +30.9% |
| EPS (₹) | 20.44 | 26.75 | +30.9% |
Operating-leverage read
Profit grew faster than sales — a good sign. But note the moving parts: other expenses rose 32% and employee costs 26%, both faster than or in line with the 25% revenue rise, so EBITDA growth (+21%) actually lagged revenue. PBT was flattered by other income of ₹71 cr (4.2% of total income), which includes a ₹50 cr foreign-exchange gain. A higher tax rate (25% vs 23%) then trimmed PAT growth to 31%.
Segments: broad, but Asia is a drag
US Generics +57%, Africa Institution +84%, Africa +29%, India +24% — but Asia fell 16%, which the company attributes to war-related disruption. So headline strength rests partly on the US, where generic pricing is inherently volatile.
Full-year trend (Consolidated, ₹ crore)
Revenue: FY24 4,209 → FY25 4,648 → FY26 5,453 (3-year CAGR ~13%). Net profit: FY24 816 → FY25 920 → FY26 1,056 (3-year CAGR ~14%). Return ratios are strong: ROE 27.1%, ROCE 34.5% (FY26). (Source: Screener.in, consolidated.)
Cash Flow Analysis
This is where ShareBazaar’s reading differs from the wire coverage. Reported profit is an accounting opinion; cash is a fact. On paper FY26 looked excellent — profit up ~15% to ₹1,056 cr. In cash terms it was the company’s weakest year in recent memory.
Operating Cash Flow
FY25 ₹1,157 cr → FY26 ₹529 cr
Down ~54%. Cash conversion (CFO/operating profit) collapsed from 117% to 59%.
Free Cash Flow
FY25 ₹840 cr → FY26 ₹169 cr
Down ~80%.
Why the cash fell — and what it means for this dividend
The culprit is working capital. Consolidated debtor days jumped to 124 in FY26 from 93 in FY25 — receivables grew faster than sales, meaning more profit is stuck in the balance sheet rather than converting to cash. As a direct consequence, FY26 free cash flow of ₹169 cr does not cover the ₹399.79 cr interim dividend (FCF coverage just 0.42×). The gap is being bridged from the company’s cash reserves and a step-up in borrowings (gross debt rose from ₹47 cr to ₹260 cr in FY26).
How this dividend is being funded: primarily from current earnings and accumulated cash reserves, with FY26 free cash flow alone insufficient to cover it. It is not funded by asset sales, but a portion of the funding gap in FY26 coincided with higher borrowings. The comfort comes from the balance sheet, not from last year’s cash generation.
Balance Sheet Strength
Reserves (Other Equity, FY26)
₹4,502 Cr
Book value ~₹362 per share
Borrowings (FY26)
₹260 Cr
Essentially debt-free (D/E ~0.06), but up from ₹47 cr in FY25
Investments (FY26)
₹588 Cr
Covers the ₹399.79 cr outflow ~1.5×
Total Assets (FY26)
₹6,037 Cr
Asset-light, formulation-led model
The balance sheet is the real safety net here. With ₹4,502 cr of reserves and near-zero net debt, Ajanta can pay this dividend many times over from its own equity base — which is precisely why the weak FY26 free cash flow is a watch item, not an alarm. The one nuance worth tracking is the rise in borrowings, small in absolute terms but a five-fold jump year-on-year. (Source: Screener.in, consolidated.)
Dividend Sustainability Analysis
| Coverage test | Reading | Verdict |
|---|---|---|
| Earnings coverage (EPS ÷ DPS) | FY26 EPS ₹84.5 ÷ ₹32 = 2.64× | Pass |
| Operating cash flow coverage | FY26 OCF ₹529 cr ÷ ₹399.79 cr = 1.32× | Thin / Amber |
| Free cash flow coverage | FY26 FCF ₹169 cr ÷ ₹399.79 cr = 0.42× | Fail (this year) |
| Liquidity / reserves coverage | Investments ₹588 cr + reserves ₹4,502 cr | Pass (ample) |
Overall verdict: Moderately Sustainable
Earnings and the balance sheet comfortably support the ₹32 payout, and Ajanta’s payer profile is consistent and rising. The single caution is that the dividend is stepping up in a year when free cash flow shrank — so the payout currently outpaces free cash generation. If FY27 operating cash flow normalises as receivables are collected, the payout is easily affordable; if working capital stays stretched, the company will keep funding growth in the dividend from reserves rather than from fresh cash. That is the key thing to monitor.
Peer Comparison
| Company | Div. Yield | Payout | ROE | ROCE |
|---|---|---|---|---|
| Ajanta Pharma | ~0.91% | 33% (FY26) | 27.1% | 34.5% |
| Alkem Laboratories | ~0.91% | ~25% | NIV | NIV |
| Ipca Laboratories | ~0.3% | ~7–10% | NIV | NIV |
| Torrent Pharma | NIV | NIV | NIV | NIV |
“NIV” = Not Independently Verified at time of writing; left blank rather than filled with an unconfirmed figure. Sources: Screener.in, Equitymaster, SimplyWall.st. Note: J B Chemicals & Pharmaceuticals, a common comparator, was amalgamated into Torrent Pharma (effective July 2026) and is no longer separately listed, so it is excluded here.
Against peers, Ajanta screens as a high-return, mid-payout name: its ROE (27%) and ROCE (35%) are at the top end of the branded-generics pack, while its dividend yield (~0.9%) is broadly in line with Alkem and well above the thin-yielding Ipca. In short, Ajanta returns a moderate share of a very profitable business — the market pays up for the growth, which keeps the yield low.
Promoter Impact Analysis
Promoter Holding (Jun 2026)
63.49%
Down from 66.25% the previous quarter (–2.76 pp)
Estimated Promoter Dividend Income
~₹253.8 Cr
63.49% × ₹399.79 cr outflow
A flag worth surfacing
Of the ₹399.79 cr paid out, roughly ₹254 cr (about 63.5%) flows to the promoter family — the majority of the cash. Minority shareholders share the remaining ~36.5%. Separately, and importantly, the promoter stake fell by ~2.76 percentage points in the June 2026 quarter (with domestic institutions rising to 21.80%). A promoter reduction alongside a rising dividend is worth watching; it does not by itself signal anything negative, but the reason for the reduction is a legitimate governance question for the desk to probe.
Shareholding snapshot (Jun 2026)
Promoters 63.49% · DIIs 21.80% · FIIs 7.68% · Public 7.03%. (Source: Screener.in shareholding pattern.)
Minority-shareholder read
Because the promoter holds a majority, a high dividend is also a tax-efficient way for the family to draw cash. The interests are broadly aligned — every shareholder receives the same ₹32 per share — but the bulk of the rupees leaves with the promoter.
Taxation Analysis
Since the abolition of the Dividend Distribution Tax in April 2020, dividends in India are taxed in the shareholder’s own hands at their applicable income-tax slab rate. There is no separate flat rate — the ₹32 you receive is added to your total income.
TDS rule (Section 194)
The company deducts TDS at 10% if your total dividend from it exceeds ₹5,000 in a financial year (20% if PAN is not provided). You can claim this TDS back as credit when filing your return.
Worked example — 1,000 shares, 30% slab
Gross dividend = 1,000 × ₹32 = ₹32,000.
TDS @10% (exceeds ₹5,000) = ₹3,200 deducted upfront.
Final tax @30% + 4% cess = ₹9,984.
Net in hand after tax = ₹22,016.
Post-tax effective yield on CMP = ~0.62%.
Illustrative only, using headline slab + 4% health & education cess; surcharge (where applicable on higher incomes) is capped at 15% on dividend income and is not shown. Not tax advice — consult a qualified professional for your situation.
Key Risks
1. Cash conversion has weakened
FY26 operating cash flow fell 54% and free cash flow fell 80%, driven by receivables rising to 124 debtor days. If this persists, dividend growth will keep drawing on reserves.
2. Income-tax search overhang
An IT search (Aug 2025, block period to Nov 2025) is unresolved; the company says the financial impact is “not ascertainable.” An adverse outcome is an unquantified contingent liability.
3. US generics & forex dependence
US Generics (+57% in Q1) carry inherent price erosion risk, and reported profit is sensitive to forex (a ₹50 cr FX gain aided Q1). Both can reverse.
4. Geographic concentration / Asia weakness
Asia branded generics fell 16% on war-related disruption. Emerging-market and Africa exposure adds currency, regulatory and geopolitical volatility.
5. Promoter stake reduction
Promoter holding dropped ~2.76 pp in the June 2026 quarter. The rationale is not disclosed in the results and warrants monitoring alongside the rising payout.
6. Rich valuation
The stock trades at ~39× earnings and ~9.7× book, near its 52-week high. A modest ~0.9% yield offers little downside cushion if growth disappoints.
What To Monitor
1. Cash conversion recovery
Watch FY27 operating cash flow and the CFO/operating-profit ratio — a rebound toward the historical 90–117% would confirm the FY26 dip was temporary.
2. Receivable / debtor days
Track whether debtor days fall back from 124 toward the ~90–100 range as collections catch up.
3. A possible second FY27 interim
See whether the Board declares a further interim later in FY27, which would lift the effective full-year yield above 0.9%.
4. Borrowing trend
Monitor whether gross debt (₹260 cr, up from ₹47 cr) keeps rising while dividends grow.
5. US & Asia trajectory
Watch whether US momentum (ANDA approvals, launches) sustains and whether Asia stabilises after the war-related decline.
6. Income-tax matter & promoter holding
Follow any communication on the IT search outcome and the next shareholding pattern for further promoter changes.
Conclusion
Ajanta Pharma’s ₹32 first interim dividend for FY2027 is its highest-ever regular interim, backed by a genuinely strong quarter (revenue +25%, profit +31%) and an exceptionally solid balance sheet with ₹4,502 cr of reserves and near-zero net debt. On earnings the payout is comfortably covered (2.6×), and the company’s track record marks it a consistent, rising dividend payer.
The positives
Strong, broad-based growth; top-tier return ratios (ROE 27%, ROCE 35%); a decade of unbroken dividends; a rising payout policy; and a fortress balance sheet that can fund the dividend from reserves.
The negatives / caveats
A modest ~0.9% real yield despite the “1,600%” headline; a sharp FY26 fall in operating and free cash flow (FCF doesn’t cover this dividend); rising receivables and borrowings; an unresolved tax search; and a promoter stake reduction.
The honest summary: this is a high-quality, well-run business making a healthy, affordable payout — but one whose reported profit is currently converting to cash less efficiently than before. The dividend is safe today on the strength of the balance sheet; its long-term growth depends on cash conversion recovering. We present the positives, negatives and monitoring points; the decision is yours.
Frequently Asked Questions
What dividend has Ajanta Pharma announced?
What is the Ajanta Pharma dividend yield?
What is the record date for the Ajanta Pharma dividend?
What is the ex-dividend date?
When will the Ajanta Pharma dividend be paid?
Who is eligible to receive the dividend?
How is this dividend taxed?
Is the Ajanta Pharma dividend sustainable?
What is Ajanta Pharma’s dividend history?
Does the ₹32 dividend need AGM approval?
How much of the dividend goes to the promoters?
What should investors monitor going forward?
Is Ajanta Pharma consolidated or standalone data used here?
Disclaimer
This article is for informational and educational purposes only and does not constitute investment, financial, legal or tax advice, nor a recommendation to buy, sell or hold any security. ShareBazaar Online is not a SEBI-registered investment adviser. Figures are drawn from Ajanta Pharma’s exchange filings and third-party sources (Screener.in and dividend aggregators) believed reliable but not guaranteed; market price, yield and ex-date figures are time-sensitive and must be re-verified against live NSE/BSE data and the official corporate-action circular before acting. Past dividend performance is not indicative of future payouts. Investments in securities are subject to market risks; read all related documents carefully and consult a qualified, registered financial adviser before making any decision. The author and publisher accept no liability for any loss arising from use of this content.