
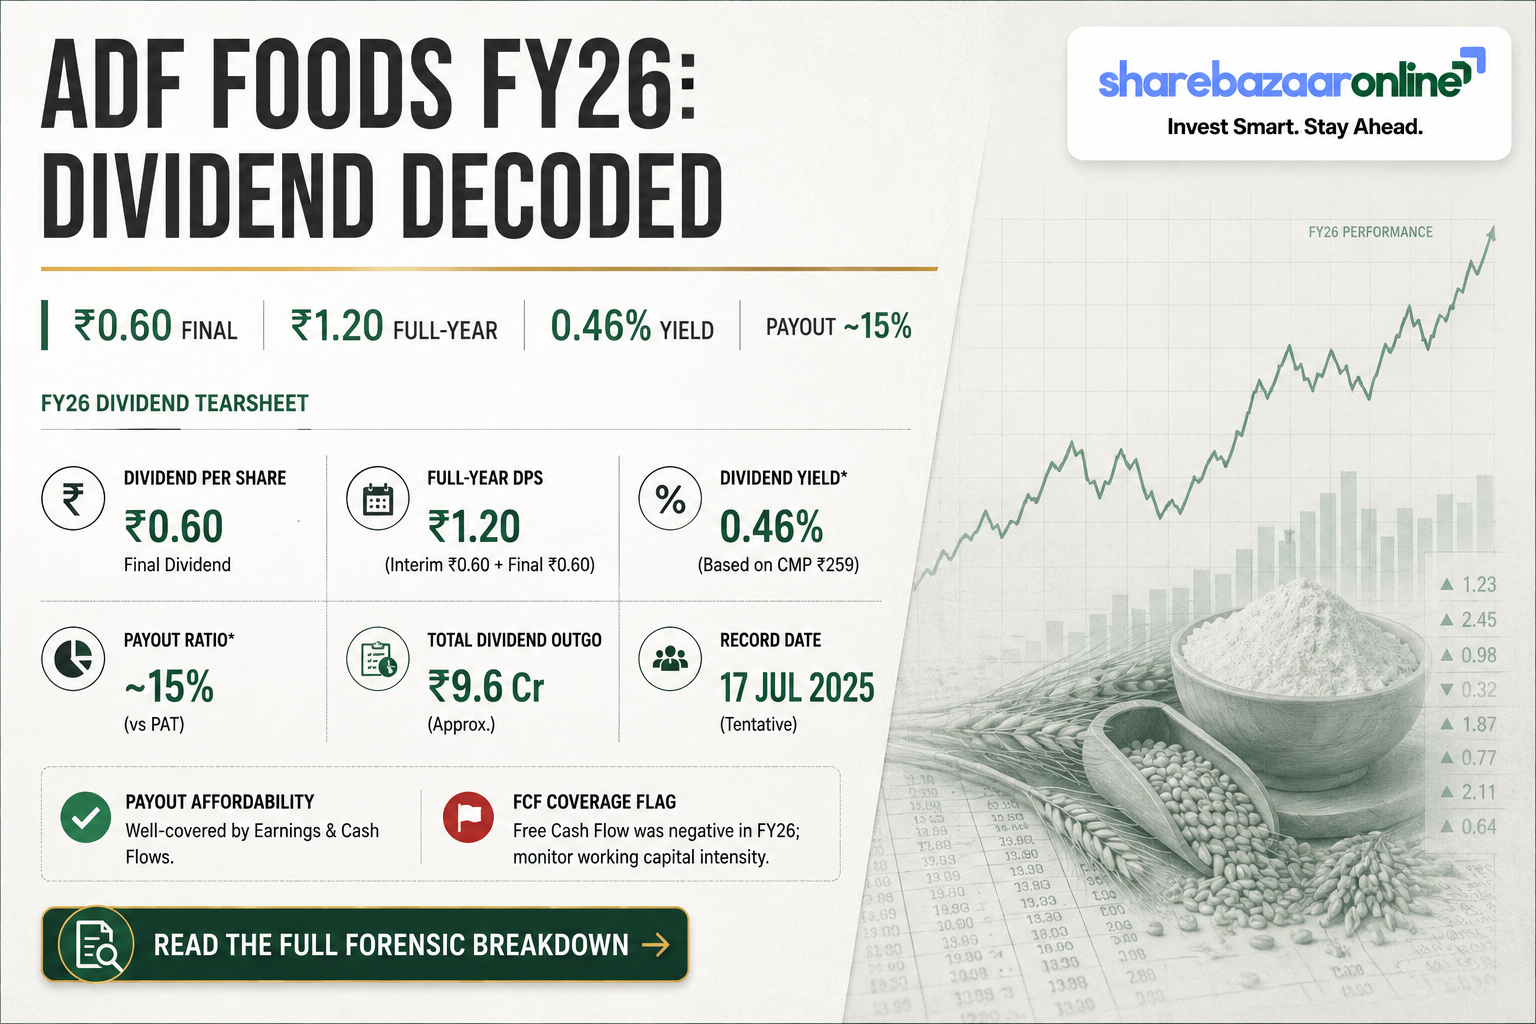
Dividend Snapshot
Final Dividend
₹0.60 / share
On Face Value
30% (FV ₹2)
Interim (paid)
₹0.60 / share
FY26 Total
₹1.20 (60%)
Dividend Type
Final
Financial Year
FY2025-26
Full-Year Yield*
~0.46%
Final-Only Yield*
~0.23%
Record Date
05 Aug 2026
AGM Date
12 Aug 2026
Payout Ratio (FY26)
~15%
Classification
Consistent Payer
*Yield is price-dependent. Based on an indicative market price of ~₹263 (NSE, 11 Aug 2026). Yields change daily and must be re-verified against the live price before you act. Source: exchange filing dated 13 May 2026; price and ratios cross-checked with Screener.in and NSE.
Dividend Announcement Summary
At its board meeting on Wednesday, 13 May 2026, the Board of Directors of ADF Foods Limited recommended a final dividend of ₹0.60 per equity share (30%) on shares of face value ₹2, alongside the audited standalone and consolidated results for the year ended 31 March 2026. The final dividend is subject to shareholder approval at the 36th Annual General Meeting scheduled for 12 August 2026, so it is a recommendation and not yet a confirmed payout.
What was disclosed
- Final dividend: ₹0.60/share, subject to 36th AGM approval
- Record date: 05 August 2026
- Register of Members closed 06–12 August 2026 (both inclusive)
- Payment: within 30 days of declaration (i.e. from the AGM date)
- Auditors (MSKA & Associates LLP) issued an unmodified opinion
Full-year context
An interim dividend of ₹0.60/share was already paid during FY26 (ex-date 13 November 2025). Adding the ₹0.60 final brings the total FY2025-26 dividend to ₹1.20 per share — identical to the ₹1.20 paid in FY2024-25, even though earnings per share rose about 30% over the year.
Key Dates Timeline
| Event | Date | Status |
|---|---|---|
| Board Meeting / Announcement | 13 May 2026 | Confirmed |
| Record Date | 05 Aug 2026 | Confirmed (filing) |
| Ex-Date | 04 Aug 2026 (inferred) | Inferred from T+1; confirm on NSE/BSE circular |
| Book Closure | 06–12 Aug 2026 | Confirmed |
| 36th AGM (approval) | 12 Aug 2026 | Confirmed |
| Payment | By ~11 Sep 2026 | Statutory outer limit (within 30 days of declaration) |
The company disclosed the record date but not an explicit ex-date or a fixed payment date. The ex-date above is inferred from the standard T+1 settlement convention and should be confirmed against the official NSE/BSE corporate-action circular. Payment is framed as the statutory outer limit of 30 days from the date of declaration (the AGM).
Dividend Yield Analysis
The “30% dividend” illusion
The filing headline of a 30% dividend refers to 30% of the ₹2 face value — it is ₹0.60 in rupee terms, not 30% of your investment. A retail investor buying at the market price earns a far smaller cash return. This face-value framing is the single most misunderstood number in Indian dividend headlines, and it is where ShareBazaar Online separates reporting from analysis.
Yield at current price (~₹263)
- Final ₹0.60 only: ~0.23%
- Full-year ₹1.20: ~0.46%
Yield at announcement price (~₹266)
- Final ₹0.60 only: ~0.23%
- Full-year ₹1.20: ~0.45%
Reality check: ADF Foods is not a high-yield stock. At roughly 0.46% full-year yield, the dividend is well below a typical bank fixed deposit and below the broad FMCG/food-sector average. The investment case here is growth and capital appreciation (the stock is up sharply from its 52-week low of ₹153), with the dividend acting as a small, symbolic top-up rather than an income source. All yield figures are price-dependent and must be re-verified at the live price before publication.
Dividend History Analysis
| Financial Year | Dividend / Share* | Type | Payout % |
|---|---|---|---|
| FY2025-26 | ₹1.20 (0.60 + 0.60) | Interim + Final | ~15% |
| FY2024-25 | ₹1.20 (0.60 + 0.60) | Interim + Final | ~19% |
| FY2023-24 | ₹5.20 (incl. ₹4.00 special) | Special + Final | ~77% |
| FY2022-23 | ~₹0.20 (split-adj.) | Final | ~20% |
| FY2021-22 | ~₹0.16 (split-adj.) | Final | ~18% |
The split & special-dividend distortion
ADF Foods split its shares 2:10 (face value ₹10 → ₹2) with ex-date 11 September 2023, so raw per-share dividends before and after that date are not directly comparable without adjustment. In FY2023-24 the company also paid a large one-time special dividend of ₹4.00/share, which is why that year’s payout ratio spiked to ~77%. Treating that year as a “normal” payout would badly overstate the recurring dividend.
Flat rupee dividend, falling payout ratio
Excluding the one-off special, the regular dividend has held steady at ₹1.20/share for two straight years (FY25 and FY26). Because EPS grew ~30% in FY26, the payout ratio actually fell from ~19% to ~15% — management is retaining more cash to fund its Surat greenfield expansion. This makes ADF a consistent but conservative payer that has periodically topped up with a special.
*Historical per-share amounts are shown on a split-adjusted basis where relevant (Source: exchange corporate-action records, Screener.in, TipRanks). Payout ratios are approximate and computed on consolidated PAT.
Financial Performance Analysis (Consolidated FY26)
| Metric (Consolidated) | FY26 | FY25 | Growth |
|---|---|---|---|
| Revenue from Operations | ₹683.2 Cr | ₹589.6 Cr | +15.9% |
| EBITDA | ₹130.7 Cr | ₹98.4 Cr | +32.8% |
| EBITDA Margin | 19.1% | 16.7% | +240 bps |
| Net Profit (PAT) | ₹89.9 Cr | ₹69.3 Cr | +29.8% |
| EPS (Basic) | ₹8.19 | ₹6.30 | +30.0% |
Positive operating leverage
Revenue grew 15.9% but EBITDA grew 32.8% and PAT 29.8% — profits rose roughly twice as fast as sales. Margin expanded ~240 bps to 19.1%, driven by scale and a better product/geography mix. This is the opposite of margin compression and is a genuine positive.
Two one-off items to read carefully
Reported PBT absorbed a ₹6.83 Cr exceptional charge for the incremental employee-benefit liability under India’s new Labour Codes — a one-time item, not an operating deterioration. Separately, standalone PAT (₹97.2 Cr) exceeds consolidated PAT (₹89.9 Cr), because the overseas subsidiaries collectively lost money in FY26 (details below).
Cash Flow Analysis
Reported profit is an accounting opinion; cash is a fact. Here the two diverge, and this is the most important section of the whole analysis.
Operating cash flow vs profit
- Consolidated PAT: ₹89.9 Cr
- Operating cash flow (OCF): ₹57.6 Cr
- OCF as % of PAT: ~64% (cash conversion below 1)
OCF trails profit because working capital soaked up cash: receivables rose ~22.6% (faster than revenue’s 15.9%) and inventory jumped ~32.9%, pushing inventory days to about 205 (from ~176). This is worth monitoring.
Free cash flow is negative
- OCF: ₹57.6 Cr
- Capex (PP&E): ₹82.8 Cr
- Free cash flow: –₹25.2 Cr
FY26 free cash flow was negative because of heavy capital spending on the new Surat greenfield plant (~₹50.5 Cr of Phase-1 capitalised in the year). FY25 FCF was also slightly negative.
So how is the dividend funded?
Because FY26 free cash flow was negative, the full-year dividend of ~₹13.2 Cr is not covered by current-year free cash flow. It is comfortably funded instead from operating cash flow (₹57.6 Cr covers the payout ~4.4×) and from the company’s large net-cash balance sheet. In other words, the dividend leans on the strength of the balance sheet and prior cash generation, not on the cash the business threw off this year — a nuance wire and aggregator sites routinely miss.
Balance Sheet Strength
Net cash position
- Cash + current investments + bank balances: ~₹86.9 Cr
- Borrowings (ex-lease): ~₹8.8 Cr
- Net cash (ex-lease): ~₹78.2 Cr
- Pledged promoter shares: 0%
Quality & returns
- ROE: ~17.7% • ROCE: ~21.8%
- Book value/share: ~₹52
- Net worth: ~₹572 Cr
- Debt-to-equity: negligible (net cash)
The balance sheet is a clear strength: essentially debt-free on a net basis, healthy double-digit returns on capital, and a comfortable cash cushion that easily absorbs both the dividend and the ongoing Surat capex. (Ratios sourced from Screener.in; balance-sheet items from the audited FY26 filing.)
Dividend Sustainability Analysis
| Coverage Test | Result (full-year ₹1.20) | Verdict |
|---|---|---|
| Earnings coverage (EPS ÷ DPS) | ~6.8× | Strong (Pass) |
| OCF coverage | ~4.4× | Strong (Pass) |
| Cash / liquidity coverage | ~6.6× | Strong (Pass) |
| Free cash flow coverage | Negative FCF | Amber (capex-driven) |
Verdict: Sustainable — but for balance-sheet reasons, not FCF reasons
On three of four tests the dividend passes comfortably. The single amber flag is the negative free cash flow, and that is a deliberate, temporary consequence of the Surat expansion rather than a sign of business weakness. With a low ~15% payout, a net-cash balance sheet, and earnings compounding, the ₹1.20 dividend looks Sustainable. The watch-point is straightforward: once Surat capex normalises, free cash flow should turn positive again — if it does not, the dividend would then rely more heavily on reserves.
Peer Comparison
| Company | Div. Yield | Payout | ROE | ROCE | Balance Sheet |
|---|---|---|---|---|---|
| ADF Foods | ~0.46% | ~15% | ~17.7% | ~21.8% | Net cash |
| Tasty Bite Eatables | ~0.1% | ~2% | ~11.2% | ~8.6% | Net cash |
| Mrs Bectors Food | ~0.2% | ~10% | Not Independently Verified | Not Independently Verified | Low debt |
Across listed ethnic/processed-food peers, low dividend yields are the norm — these are reinvestment-led growth companies, not income stocks. On profitability, ADF Foods screens well: its ROE (~17.7%) and ROCE (~21.8%) are ahead of Tasty Bite Eatables, and its payout is more generous than Tasty Bite’s token ~2%. Cells marked “Not Independently Verified” are left blank rather than filled with unconfirmed figures. (Peer data: Screener.in, MarketsMojo; verify against primary sources before publishing.)
Promoter Impact Analysis
Who receives the cash
- Promoter holding: ~36.14% (Jun 2026)
- FIIs: ~11.6% • DIIs: ~21.3% • Public: ~31.0%
- Total final-dividend outflow: ~₹6.6 Cr
- Full-year outflow: ~₹13.2 Cr
Promoter dividend income
- Promoter share of final ₹0.60: ~₹2.4 Cr
- Promoter share of full-year ₹1.20: ~₹4.8 Cr
With ~36% ownership, promoters receive a little under ₹4.8 Cr of the full-year dividend. The remaining ~64% flows to institutional and public shareholders. The modest, low-payout structure means the dividend does not disproportionately favour promoters at minority shareholders’ expense.
Dividend Taxation Analysis
How Indian dividend tax works (FY2025-26)
- Since the abolition of Dividend Distribution Tax (FY2020-21), dividends are taxable in the investor’s hands at their income-tax slab rate, under “Income from Other Sources”.
- TDS of 10% (Section 194) applies only if total dividend from one company in a financial year exceeds ₹10,000 (threshold raised from ₹5,000 in Budget 2025). No PAN → 20% TDS.
- NRIs face 20% TDS under Section 195 (or a lower DTAA rate).
Worked example — retail investor holding 1,000 ADF Foods shares
| Item | 30% slab | 20% slab | 5% slab |
|---|---|---|---|
| Gross dividend (1,000 × ₹1.20) | ₹1,200 | ₹1,200 | ₹1,200 |
| TDS deducted | ₹0 (below ₹10,000) | ₹0 | ₹0 |
| Tax payable (incl. 4% cess) | ~₹374 | ~₹250 | ~₹62 |
| Net in hand | ~₹826 | ~₹950 | ~₹1,138 |
| Effective post-tax yield* | ~0.31% | ~0.36% | ~0.43% |
*On an assumed price of ~₹263. On ₹1,200 no TDS is deducted because the annual dividend from ADF Foods stays below the ₹10,000 threshold; the investor still self-declares and pays slab-rate tax. This is a simplified illustration, not tax advice — consult a qualified professional for your situation.
Key Risks
- US tariff risk: the company is actively monitoring potential US import tariffs on processed foods; the US is a key export market, so any tariff action could pressure the overseas business.
- Loss-making overseas subsidiaries: US/UK/Australia distribution arms collectively lost ~₹5–7 Cr in FY26, dragging consolidated PAT below standalone.
- Working-capital build-up: inventory days rose to ~205 and receivables grew faster than revenue, compressing cash conversion.
- Execution risk on Surat: heavy capex has turned FCF negative; returns depend on the new plant ramping to planned utilisation.
- Forex exposure: a largely export-driven revenue base makes earnings sensitive to rupee movements.
- Regulatory history: both Nadiad units faced GPCB closure directions that were permanently revoked on 19 Nov 2025 — resolved, but a reminder of environmental-compliance sensitivity.
What To Monitor
- Free cash flow turning positive once Surat Phase-1 capex tapers — the single most important dividend-sustainability signal.
- Inventory days and cash-conversion cycle — watch whether the FY26 build-up normalises or keeps rising.
- Overseas subsidiary profitability — whether the US/UK/Australia units move from loss to breakeven.
- Surat plant utilisation and new-product ramp — the growth engine underpinning future EPS and dividends.
- US tariff developments and rupee direction — both flow straight into export margins.
- Dividend policy signals — whether management lifts the ₹1.20 run-rate or repeats a special dividend after capex peaks.
Conclusion
The positives
ADF Foods pairs a ~30% jump in FY26 profit, ~240 bps of margin expansion, healthy returns (ROE ~17.7%, ROCE ~21.8%), and a net-cash, zero-pledge balance sheet with a steady ₹1.20 dividend. Earnings, operating cash flow and cash reserves all cover the payout several times over.
The negatives & caveats
The yield is tiny (~0.46%) — this is a growth stock, not an income stock. Free cash flow is negative on Surat capex, cash conversion has weakened, and the overseas subsidiaries are loss-making. The flat dividend despite 30% EPS growth shows management prioritising reinvestment over distribution.
Net-net, the ₹0.60 final dividend is safe and sustainable, but it is a footnote to the real story: a capital-expenditure cycle aimed at scaling capacity. We present the positives, negatives, risks and monitoring points; the decision on whether the stock fits your portfolio is yours to make.
Frequently Asked Questions
What dividend has ADF Foods announced for 2026?
What is the ADF Foods dividend yield?
What is the ADF Foods dividend record date?
What is the ADF Foods ex-dividend date?
When will the ADF Foods dividend be paid?
Who is eligible for the ADF Foods dividend?
How is the ADF Foods dividend taxed?
Is the ADF Foods dividend sustainable?
What is ADF Foods’ dividend history?
Why is ADF Foods’ standalone profit higher than its consolidated profit?
Why was ADF Foods’ free cash flow negative in FY26?
What should ADF Foods investors monitor next?
Disclaimer
ShareBazaar Online is not a SEBI-registered investment adviser. This article is for informational and educational purposes only and does not constitute investment, financial, legal or tax advice, nor any buy, sell or hold recommendation. Dividend amounts, record dates, ex-dates and payment dates are subject to shareholder approval and company/exchange confirmation. All market prices, yields and ratios are price-dependent, may be stale, and must be independently re-verified against live NSE/BSE data before any decision. Figures are drawn from the company’s exchange filing dated 13 May 2026 and cross-referenced with Screener.in, NSE, BSE and other public sources; ShareBazaar Online does not guarantee their accuracy or completeness. Investing in equities involves risk, including possible loss of principal. Please consult a SEBI-registered adviser and a qualified tax professional before investing.