
Dividend Snapshot
Dividend Per Share
₹200
Final Dividend · 2000% on ₹10 face value
Real Dividend Yield (at CMP)
1.72%
₹200 ÷ ₹11,622 (CMP, 12 Aug 2026)
Record Date
05 Aug 2026
Eligibility cut-off (now passed)
Payment Date
On/before 10 Sep 2026
Post AGM approval (AGM: 12 Aug 2026)
Dividend Type
Final
Face Value
₹10
Total Outflow
₹29.05 Cr
Payout Ratio (FY26)
54.2%
EPS FY26
₹368.73
Coverage (EPS/DPS)
1.84x
FCF Coverage
Negative
Promoter Holding
74.82%
One-line takeaway: The dividend is comfortably covered by reported earnings (1.84x) but not by FY26 free cash flow, which turned negative. The gap is funded by the company’s large cash reserves — a distinction the “2000% dividend” headline hides.
Dividend Announcement Summary
The Board of Directors of Disa India Limited, at its meeting held on 19 May 2026, recommended a final dividend of ₹200 per equity share of face value ₹10 (i.e. 2000%) for the financial year 2025-26. The recommendation was placed for approval of shareholders at the company’s 41st Annual General Meeting on 12 August 2026.
Disa India is a leading manufacturer of foundry machinery — DISAMATIC moulding machines, sand plants, shot-blasting equipment and environmental control systems — and is majority-owned by its Danish and Swiss parents (part of the Norican Global group). Because it is a foreign-promoted, low-float company, dividend policy is closely watched as the main route of cash return.
Importantly, for FY2025-26 the company declared only a final dividend (no interim during the year), unlike FY24 and FY25 where it paid ₹100 interim + ₹100 final. The full-year FY26 payout is therefore ₹200 — the same annual cash return as the prior two years, restructured into a single larger cheque.
Key Dates Timeline
| Event | Date | Notes |
|---|---|---|
| Board Meeting / Announcement | 19 May 2026 | Final dividend recommended |
| Ex-Dividend Date | 05 Aug 2026 | Buy before this date to qualify |
| Record Date | 05 Aug 2026 | Shareholder eligibility cut-off |
| AGM (Approval) | 12 Aug 2026 | Via video conferencing |
| Payment Date | On/before 10 Sep 2026 | Subject to AGM approval |
Record date and payment date as disclosed by the company. Ex-date aligns with the record date per exchange corporate-action data.
Dividend Yield Analysis
The 2000% “Yield” Illusion
A “2000% dividend” sounds spectacular, but the percentage is calculated on the ₹10 face value, not on the market price. On a share trading near ₹11,622, the real yield is far smaller. Face-value percentages are a legacy convention — always convert them to a market-price yield before judging the payout.
Face-value “yield” (headline)
2000%
Marketing number — ignore for investment decisions
Real yield at CMP (₹11,622)
1.72%
₹200 ÷ ₹11,622
Yield at announcement price (~₹11,612)
1.72%
Announcement-date price inferred — verify
Trailing-12-month cash yield
2.58%
₹300 received Aug’25 + Aug’26 ÷ CMP
Yield Reality Check — why the yield looks “higher” now
Part of the recent yield uptick is not from a bigger business — it is because the share price has fallen roughly 16% over the past year. A falling price mechanically lifts the yield even if the rupee dividend is flat. Investors should read Disa India’s current yield as a combination of a steady ₹200 annual payout and a de-rated share price, not as evidence of a suddenly more generous company.
Dividend History Analysis
| Financial Year | Interim | Final | Total DPS | Payout Ratio |
|---|---|---|---|---|
| FY2025-26 | Nil | ₹200 | ₹200 | 54.2% |
| FY2024-25 | ₹100 | ₹100 | ₹200 | 58% |
| FY2023-24 | ₹100 | ₹100 | ₹200 | 68% |
| FY2022-23 | Not Independently Verified (per-event) | — | 54% | |
| FY2021-22 | Not Independently Verified (per-event) | — | 60% | |
Payout ratios per Screener. FY22/FY23 per-share split between interim/final not independently verified — flagged rather than estimated.
Classification: Consistent Payer
Disa India has paid dividends every year with a healthy payout of ~54–68% over the last five years and a 5-year average payout of roughly 60% (Screener). There are no cuts or suspensions in recent history. The annual cash return has held steady at ₹200 for three consecutive years (FY24, FY25, FY26).
Structure shift to watch
The FY26 move to a single final dividend (vs. two ₹100 payments earlier) changes the timing of cash but not the annual amount. It is worth watching whether this signals a settled “one payout a year” policy or simply a year-specific decision.
Financial Performance Analysis
| Consolidated (₹ Cr) | FY24 | FY25 | FY26 | YoY (FY26) |
|---|---|---|---|---|
| Revenue | 329 | 390 | 425 | +9% |
| Operating Profit (EBITDA) | 50 | 60 | 67 | +12% |
| OPM % | 15% | 15% | 16% | +~100bps |
| Net Profit (PAT) | 43 | 50 | 53.6 | +8% |
| EPS (₹) | 294.87 | 346.72 | 368.73 | +6% |
Operating Leverage Check
In FY26, revenue grew +9%, EBITDA grew a faster +12% (margin expansion), but PAT grew a slower +8%. The gap between EBITDA (+12%) and PAT (+8%) is largely because other income fell (from ~₹14 Cr to ~₹11 Cr) and the tax charge was broadly stable at ~26%. Core operations improved; the softer PAT growth is a below-the-line effect, not an operating deterioration.
Longer-term growth
Over five years, sales compounded at ~18% and profit at ~18% (Screener). However, the most recent trailing-twelve-month growth has cooled to low single digits, and Q1 FY27 revenue (~₹87 Cr) was lower than the ~₹102 Cr a year earlier — a reminder that order flow in capital-goods is lumpy.
Cash Flow Analysis
Key Finding: Cash generation weakened sharply in FY26
Reported profit is an opinion; cash is a fact. While FY26 PAT rose to ₹53.6 Cr, operating cash flow collapsed ~61% to just ₹13.41 Cr (from ₹34.28 Cr in FY25). The cash-conversion ratio (CFO ÷ operating profit) fell from ~57% to ~20%. And after capex, free cash flow turned negative at roughly –₹15 Cr.
| Consolidated (₹ Cr) | FY24 | FY25 | FY26 |
|---|---|---|---|
| Operating Cash Flow (CFO) | 54.10 | 34.28 | 13.41 |
| Investing Cash Flow | -36.75 | 10.96 | -0.49 |
| Financing Cash Flow | -17.59 | -30.62 | -15.51 |
| Free Cash Flow (approx.) | 51 | 11 | –15 |
| Net Cash Flow | -0.24 | 14.62 | -2.59 |
Cash-flow figures per company filings / Screener & Motilal Oswal. FY26 FCF is an approximation (CFO less capex on the Tumkur facility).
How is the ₹200 dividend being funded?
The ₹29.05 Cr dividend outflow is not covered by FY26 operations. Operating cash flow (₹13.41 Cr) funds less than half the payout, and free cash flow is negative. Two things pulled cash down: (1) capex on the new Tumkur greenfield plant (capital work-in-progress jumped from ₹0 to ~₹29 Cr), and (2) working-capital stretch — debtor days rose from 40 to 61. The shortfall is therefore being met from the company’s accumulated cash reserves, which are substantial. This is affordable for a debt-free balance sheet, but it means the FY26 dividend is a reserves-funded distribution, not one paid out of the year’s own cash generation.
Balance Sheet Strength
Reserves & Surplus (FY26)
₹304 Cr
Net worth ~₹305 Cr
Borrowings
~₹0 Cr
Almost debt-free (debt reduced)
Book Value / Share
₹2,098
P/B ~5.54x at CMP
Return Ratios (FY26)
ROE 19.7% · ROCE 26.6%
Consistently high, low-capital-intensity model
Disa India runs an asset-light, cash-rich, near-zero-debt balance sheet with strong return ratios — the classic profile that lets a company sustain a high dividend even in a weak cash-flow year. The one shift in FY26 is the appearance of ₹29 Cr of capital work-in-progress for the Tumkur greenfield plant, marking a move into a heavier-capex growth phase. The exact liquid cash & bank balance is embedded within “other assets” and is Not Independently Verified at the line-item level from the summary financials; the FY26 annual report should be checked for the precise figure.
Dividend Sustainability Analysis
| Coverage Test | Metric | Verdict |
|---|---|---|
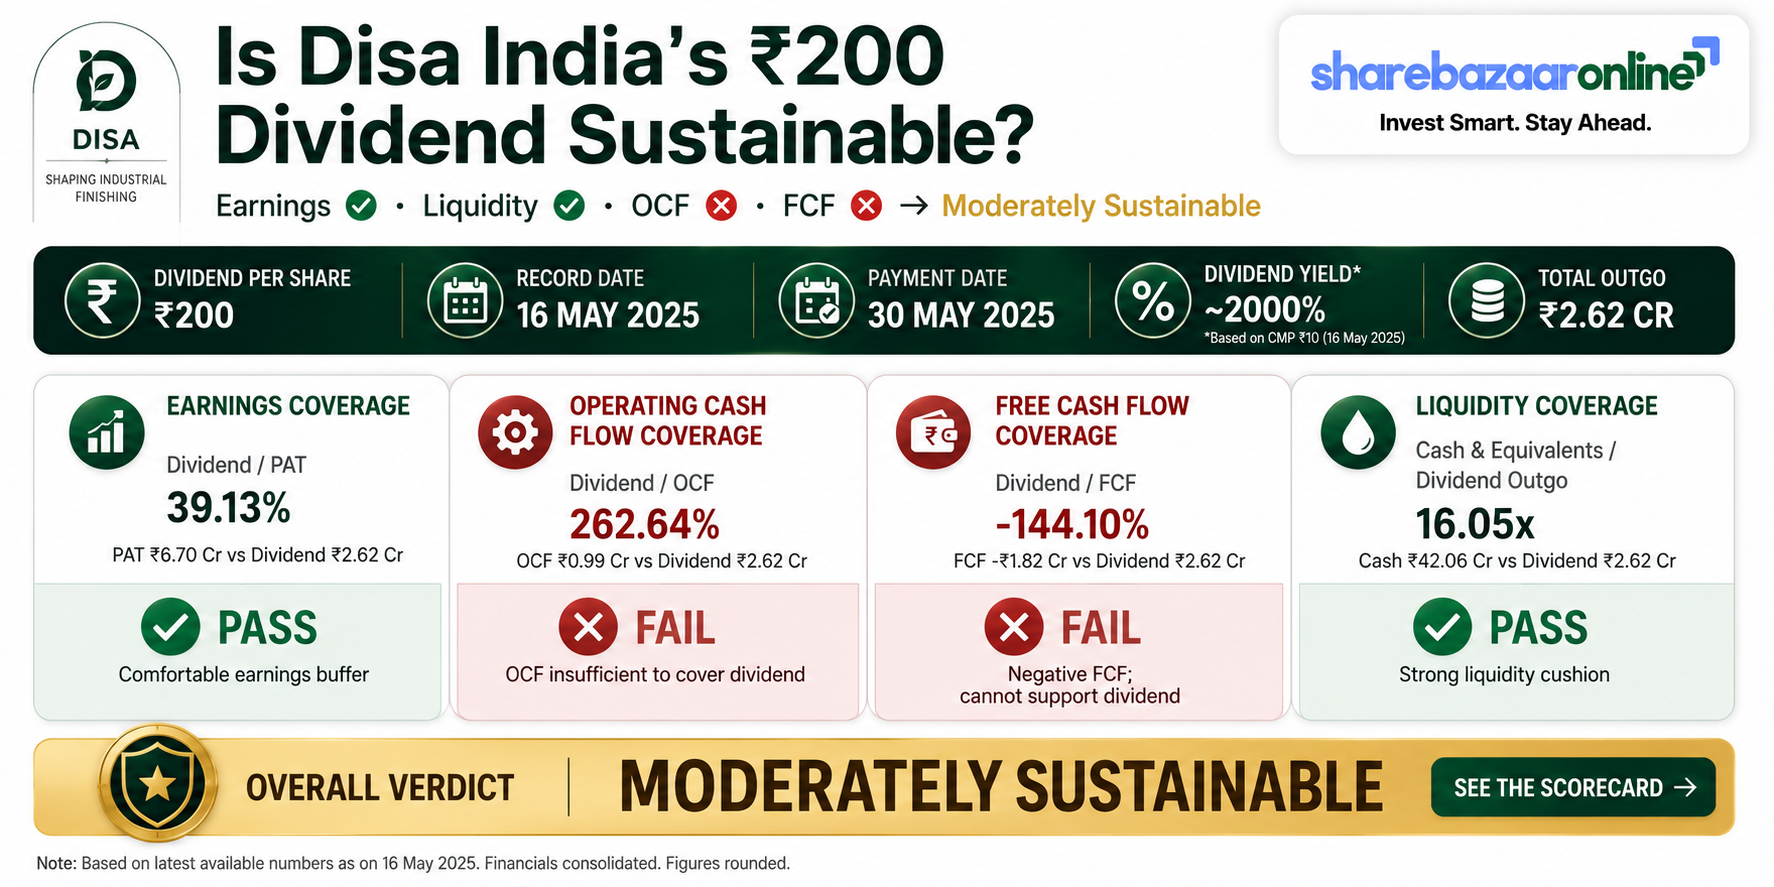
| Earnings coverage | 1.84x (payout 54.2%) | PASS |
| Operating cash flow coverage | 0.46x | FAIL |
| Free cash flow coverage | Negative FCF | FAIL |
| Cash / liquidity coverage | Reserves ₹304 Cr vs ₹29 Cr outflow | PASS |
Overall Verdict: Moderately Sustainable
The dividend is well covered by earnings and by the balance sheet, but failed the cash-flow tests in FY26 because operating cash fell sharply and free cash flow was negative. For a debt-free company with ₹300+ Cr of reserves, a single year of reserves-funded dividend is not alarming. But if the cash-conversion weakness (elevated debtor days, ongoing Tumkur capex) persists for a second year, the ₹200 annual payout would increasingly rely on drawing down reserves rather than fresh cash — a trend worth monitoring closely.
Peer Comparison
| Company | Div. Yield | Payout | ROE | ROCE | Net Debt |
|---|---|---|---|---|---|
| Disa India | 1.72% | 54.2% | 19.7% | 26.6% | Net cash |
| Kilburn Engineering | NIV | NIV | NIV | NIV | NIV |
| Honda India Power Products | NIV | NIV | NIV | NIV | NIV |
| TD Power Systems | NIV | NIV | NIV | NIV | NIV |
NIV = Not Independently Verified this session. Peer-specific dividend metrics are left blank rather than populated with unconfirmed figures. Industry P/E is reported around ~48x vs Disa India’s ~31.5x (NIV, third-party source), suggesting Disa trades at a discount to the sector median on earnings.
Where Disa India stands out among industrial-products peers is its net-cash balance sheet and high ROCE (~27%), which underpin its dividend capacity. Its ~1.72% yield is modest in absolute terms — typical of a growth-oriented capital-goods name rather than a pure high-yield stock.
Promoter Impact Analysis
Promoter Dividend Income
₹21.74 Cr
74.82% × ₹29.05 Cr outflow
Public / Institutional Share
₹7.32 Cr
25.18% (DII 8.31% + FII 0.02% + Public 16.86%)
Roughly three-quarters of every dividend rupee flows to the foreign promoter group — DISA Holding A/S (Denmark) and DISA Holding AG (Switzerland), part of Norican Global. Of the ₹29.05 Cr total, about ₹21.74 Cr is repatriated to the parent, while minority (public + domestic-institution) shareholders share ~₹7.32 Cr. This is a legitimate and consistent capital-return route, but investors should recognise that dividend policy at Disa India is heavily aligned with the parent’s cash-return preferences. Shareholders should also note the large proposed related-party transactions with DISA Industries A/S, Denmark (up to ~₹120 Cr for FY27) placed for approval.
Taxation Analysis
Since April 2020, dividends in India are taxed in the hands of the shareholder at their applicable income-tax slab rate (the company no longer pays Dividend Distribution Tax). The company must deduct TDS at 10% under Section 194 if a resident shareholder’s total dividend from that company in the year exceeds ₹5,000 (10% threshold; PAN required, else 20%). The TDS is adjustable against final tax liability.
Worked Example — investor holding 1,000 shares
| Dividend per share | ₹200 |
| Gross dividend (1,000 × ₹200) | ₹2,00,000 |
| TDS @10% (deducted at source, adjustable) | ₹20,000 |
| Total tax @30% slab | ₹60,000 |
| Net dividend in hand (after full tax) | ₹1,40,000 |
| Effective post-tax yield (30% slab, at CMP) | 1.20% |
Illustrative for a resident investor in the 30% slab (excluding surcharge/cess). Actual tax varies by individual slab. Not tax advice — consult a qualified tax professional.
Key Risks
1. Weak FY26 cash conversion. Operating cash flow fell ~61% to ₹13.41 Cr and free cash flow turned negative (~–₹15 Cr). A repeat in FY27 would put the ₹200 dividend increasingly on reserves.
2. Rising working capital. Debtor days climbed from 40 to 61, tying up cash. Sustained receivables stretch can mask collection or order-quality issues.
3. Cyclical, order-driven revenue. Foundry-equipment demand tracks industrial and auto capex. Q1 FY27 revenue (~₹87 Cr) was below the year-ago quarter, and the stock is down ~16% over one year.
4. Execution risk on Tumkur greenfield plant. The new facility (CWIP ~₹29 Cr) faced timeline extension due to administrative-approval delays; capex will pressure free cash flow until it ramps.
5. Governance / related-party exposure. A SEBI warning was issued over non-disclosure of a whistleblower complaint (no monetary penalty reported), and large related-party transactions with the Danish parent are recurring. High promoter holding (74.82%) also means a very low public float.
6. Rich valuation for a cyclical. At ~31.5x earnings and ~5.5x book, the stock prices in continued growth; earnings disappointment could de-rate it further.
What To Monitor
1. Operating cash flow recovery in FY27 — does CFO/operating-profit conversion move back toward its historical 80–140%?
2. Debtor days — whether receivables normalise from the elevated 61-day level.
3. Tumkur plant commissioning — completion, capex overruns, and the revenue/margin contribution once operational.
4. Order intake & export momentum — exports rose sharply in FY26 (to ~₹71 Cr from ~₹34 Cr); watch whether this growth holds.
5. Dividend policy & free-cash-flow coverage — whether the company reverts to interim + final and whether future payouts are covered by FCF rather than reserves.
6. Related-party transaction scale & governance follow-through after the SEBI compliance directive.
Conclusion
Disa India’s FY2025-26 ₹200 final dividend (2000%) continues an unbroken, consistent payout record from a high-quality, debt-free, cash-rich business earning ~27% ROCE. On the numbers that matter, though, the story is more nuanced than the headline percentage: the real yield is 1.72%, part of which reflects a de-rated share price rather than a bigger dividend; the payout is covered 1.84x by earnings but not by FY26 free cash flow, which was negative as operating cash halved and the company invested in its Tumkur greenfield plant.
The positives — consistency, balance-sheet strength, strong return ratios — are real. The watch-items — weak cash conversion, rising debtor days, cyclical order flow, and reliance on reserves to fund this year’s payout — are equally real. Investors should weigh both sets of facts against their own objectives.
Frequently Asked Questions
What dividend has Disa India announced for 2026?
What is the Disa India dividend yield?
What is the Disa India dividend record date?
What is the ex-dividend date?
When will the Disa India dividend be paid?
Who is eligible for the dividend?
How is the Disa India dividend taxed?
Is the Disa India dividend sustainable?
What is Disa India’s dividend history?
Why did operating cash flow fall in FY26?
How much of the dividend goes to promoters?
What should investors monitor going forward?
What is Disa India’s share price and valuation?
Disclaimer
This article is for informational and educational purposes only and does not constitute investment, financial, or tax advice, nor a recommendation to buy, sell or hold any security. ShareBazaar Online is not a SEBI-registered investment adviser. Figures are compiled from company filings and third-party sources (including Screener.in and exchange data) and, while care has been taken, may contain errors or become outdated; several data points are labelled “Not Independently Verified (NIV)” where primary-source confirmation was unavailable. Market price, yield and coverage figures are price-dependent and change continuously. Dividends are subject to shareholder approval and applicable taxes. Investors should verify all details from official NSE/BSE filings and consult a qualified financial or tax professional before making any decision.