
Dividend Snapshot
Dividend Per Share
₹21.00
210% of ₹10 face value
Dividend Type
Final Dividend
FY2025–26 · subject to AGM approval
Real Dividend Yield
~0.96%
On CMP of ~₹2,200 (re-verify before publish)
Total Dividend Outflow
~₹1,706 Cr
On 81.25 crore shares
Record Date
05 Aug 2026
Eligibility cut-off
Payout Ratio (Consol.)
~31%
Earnings coverage ~3.2x
Dividend Announcement Summary
At its board meeting on 8 May 2026, Hyundai Motor India’s directors approved the audited standalone and consolidated results for the year ended 31 March 2026 and recommended a final dividend of ₹21 per equity share of ₹10 face value, fully paid up. The recommendation is subject to shareholder approval at the 30th Annual General Meeting scheduled for 26 August 2026.
The statutory auditors, B S R & Co. LLP, issued an unmodified (clean) opinion on both the standalone and consolidated results — there are no audit qualifications flagged in this filing.
The context matters: this is only Hyundai Motor India’s second dividend as a listed company. It paid its first-ever public-market dividend of ₹21 for FY25, and has now held the payout flat at ₹21 for FY26 — despite consolidated net profit falling around 3.7% year on year.
Key Dates Timeline
Announcement Date
08 May 2026
Ex-Dividend Date
05 Aug 2026
Record Date
05 Aug 2026
AGM Date
26 Aug 2026
Expected Payment Date
~25 Sep 2026
After AGM approval · statutory outer limit 30 days from AGM
Financial Year
FY2025–26
Note: Under the T+1 settlement regime the ex-date and record date coincide. The payment date reflects the pattern of FY25 (paid ~27 Sep 2025); confirm the exact payout date from the company’s post-AGM intimation.
Dividend Yield Analysis
The “210% dividend” headline is a face-value figure, not a return. The real yield is the ₹21 payout divided by the price you actually pay:
Yield on current price (~₹2,200)
~0.96%
₹21 ÷ ₹2,200
Yield on announcement-day close (₹1,852.80)
~1.13%
₹21 ÷ ₹1,852.80
The takeaway: a 210% headline translates into a sub-1% cash yield at today’s price. Hyundai Motor India is not a high-yield income stock; the dividend is a modest supplement to a total-return thesis driven by earnings and re-rating. The stock re-rated roughly 19% higher between the 8 May announcement and mid-August, which is exactly why the yield has compressed — a rising price mechanically shrinks yield even though the rupee payout is unchanged.
Dividend History Analysis
| Financial Year | Dividend Per Share | Type | Status |
|---|---|---|---|
| FY2025–26 | ₹21.00 | Final | Recommended (AGM pending) |
| FY2024–25 | ₹21.00 | Final | Paid (first-ever listed dividend) |
| Pre-IPO (FY24 & earlier) | Not comparable | — | Paid to 100% parent, Hyundai Motor Company |
As a public company, Hyundai Motor India has a two-year track record, both at ₹21. That is too short to classify it as a “Consistent Payer” in the conventional sense. A cleaner label is “Recently listed, early-stage payer” — establishing a policy rather than proving one.
One important nuance: before listing, the company distributed very large dividends to its Korean parent (its reserves fell sharply in FY24, reflecting a substantial pre-IPO payout). Those figures are not comparable with post-listing per-share dividends and should not be read as a “cut”. The relevant baseline for public shareholders starts at FY25.
Financial Performance Analysis
| Metric (Consolidated) | FY2025–26 | FY2024–25 | Change |
|---|---|---|---|
| Revenue from operations | ₹70,763 Cr | ₹69,193 Cr | +2.3% |
| Profit before tax | ₹7,243 Cr | ₹7,591 Cr | −4.6% |
| Net profit (PAT) | ₹5,432 Cr | ₹5,640 Cr | −3.7% |
| EPS (basic & diluted) | ₹66.85 | ₹69.41 | −3.7% |
Operating leverage: revenue up, profit down
Revenue grew a modest +2.3%, yet PAT fell 3.7% — classic margin compression. The pressure is visible in two cost lines that outpaced revenue:
- Employee benefits expense rose ~18.9% (partly reflecting recognition of the new Labour Codes impact) — far ahead of the 2.3% revenue growth.
- Other expenses rose ~11.7%, again well above topline growth.
The result: standalone operating margin drifted down toward ~12%, and the March 2026 quarter was the softest of the year on margins. Investors should read the flat dividend against this backdrop — it is being held in a year of mild earnings de-growth, not growth.
Cash Flow Analysis
Reported profit is an accounting opinion; cash is the fact. Here the cash story is stronger than the profit story:
Operating cash flow (Consol.)
₹7,321 Cr
Up ~68% YoY from ₹4,345 Cr
Free cash flow (OCF − capex)
~₹3,055 Cr
After ₹4,266 Cr capex
OCF of ₹7,321 Cr comfortably exceeds PAT of ₹5,432 Cr (a cash-conversion ratio above 1.0x), which is a quality signal — earnings are backed by real cash. This is a sharp improvement on FY25, when OCF was only ₹4,345 Cr and heavy Talegaon-plant capex pushed free cash flow negative.
How is the dividend funded? The ₹1,706 Cr payout is covered ~1.8x by FY26 free cash flow and does not require dipping into reserves or borrowings. In FY26 the dividend is funded from current operations — a healthier position than FY25, when the first listed dividend was effectively paid out of the company’s large cash pile during a negative-FCF year.
Balance Sheet Strength
Total cash & bank balances
~₹10,552 Cr
Total borrowings
~₹997 Cr
Net cash position
~₹9,555 Cr
Effectively debt-free
Total equity / net worth
~₹20,015 Cr
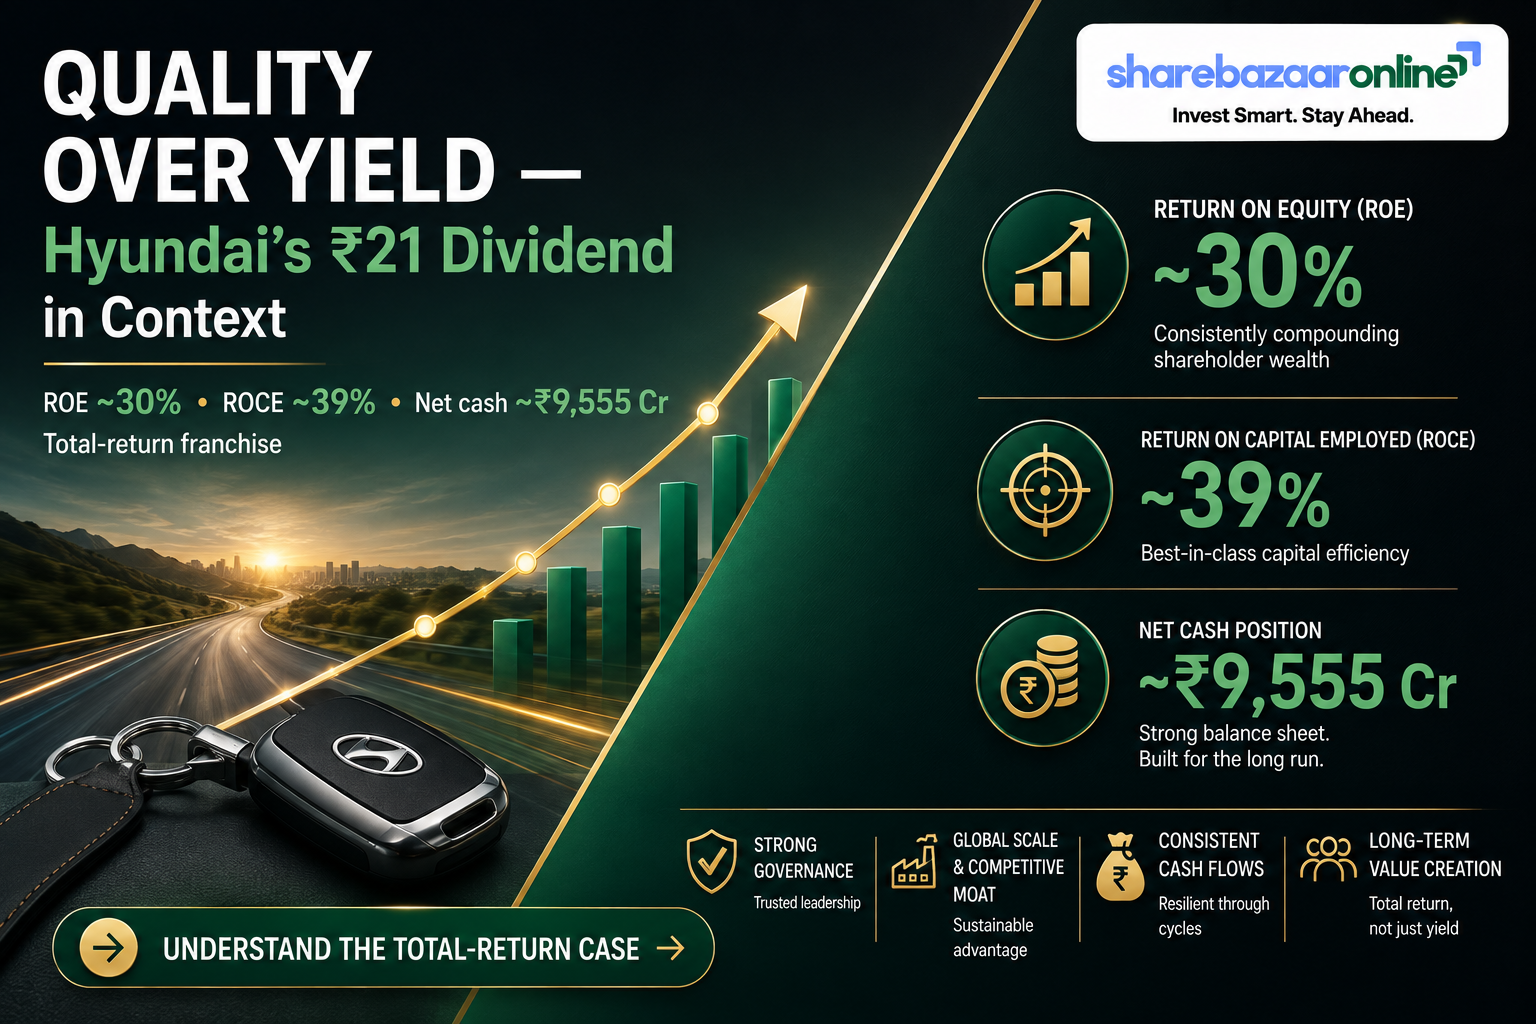
Hyundai Motor India carries roughly ₹10,552 Cr of cash and bank balances against ₹997 Cr of borrowings — a net cash cushion near ₹9,555 Cr. Screener pegs return on capital employed near 38.8% and return on equity near 30.3%. Put simply, the ₹1,706 Cr dividend is a small fraction of the liquidity on hand; affordability is not in question.
Dividend Sustainability Analysis
Earnings coverage
~3.2x PASS
EPS ₹66.85 ÷ DPS ₹21
FCF coverage
~1.8x PASS
FCF ~₹3,055 Cr ÷ outflow ₹1,706 Cr
Cash / liquidity coverage
~6.2x PASS
Cash & bank ₹10,552 Cr ÷ outflow
Earnings trend
Mild de-growth WATCH
PAT −3.7%; Q1 FY27 PAT down ~35% YoY
Verdict: Sustainable, on the strength of coverage. All three affordability tests — earnings, free cash flow and liquidity — pass comfortably. The single amber flag is the earnings direction: FY26 PAT fell modestly, and the June-2026 quarter (Q1 FY27) saw profit drop sharply year on year on weaker volumes and margins. The dividend is safe at ₹21; the open question is whether Hyundai can grow it if profits keep sliding.
Peer Comparison
| Company (Passenger Vehicle OEM) | FY26 Dividend / Share | Approx. Yield | Payout Ratio | ROE |
|---|---|---|---|---|
| Hyundai Motor India | ₹21 (FV ₹10) | ~0.96% | ~31% | ~30.3% |
| Maruti Suzuki India | ₹140 (FV ₹5) | ~1.1% | ~29% | Not Independently Verified |
| Mahindra & Mahindra | ₹33 (FV ₹5) | Not Independently Verified | Not Independently Verified | Not Independently Verified |
| Tata Motors (Passenger Veh.) | ₹4 | ~1.0% | ~4% | Not Independently Verified |
On rupee-per-share terms the numbers are not comparable because face values differ (Maruti and M&M are ₹5; Hyundai is ₹10). On the metric that matters — yield and payout — Hyundai sits in a similar band to Maruti (payout in the high-20s to low-30s%; yield near 1%), and well ahead of Tata Motors, whose payout stays very low. Hyundai’s standout is its return profile (ROE ~30%, ROCE ~39%), among the highest in the peer set.
Yields are at different reference dates and are price-dependent; ROE/payout for peers marked “Not Independently Verified” should be confirmed from primary filings before publication.
Promoter Impact Analysis
Promoter holding (Hyundai Motor Co., Korea)
82.50%
Promoter share of dividend
~₹1,408 Cr
82.5% of ₹1,706 Cr outflow
With an 82.5% promoter stake, roughly ₹1,408 Cr of the ₹1,706 Cr dividend flows to the Korean parent, Hyundai Motor Company. The remaining ~₹298 Cr is shared among public shareholders (DIIs ~9.7%, FIIs ~5.4%, retail/public ~2.4% as of March 2026). This is the normal reality of a majority-owned MNC subsidiary: the promoter is the largest single beneficiary of any dividend. On the positive side, a parent that wants regular cash returns has a structural incentive to keep the dividend flowing — which supports payout continuity for minority holders too.
Taxation Analysis
Since April 2020, dividends are taxed in the hands of the investor at their applicable income-tax slab rate. The company deducts TDS at 10% if a resident shareholder’s total dividend from it exceeds ₹5,000 in a financial year (a valid Form 15G/15H or a lower-deduction certificate can reduce this). The TDS is an advance — the final liability is settled at your slab when you file your return.
Worked example — 1,000 shares at a 30% slab
| Gross dividend (1,000 × ₹21) | ₹21,000 |
| TDS deducted at source (10%) | −₹2,100 |
| Cash credited on payment day | ₹18,900 |
| Total tax at 30% slab | ₹6,300 |
| Balance tax paid at filing (30% − TDS) | ₹4,200 |
| Net dividend after full tax | ₹14,700 |
| Post-tax effective yield (on ~₹2,200 CMP) | ~0.67% |
Surcharge and cess may apply for higher-income slabs. This is an illustration, not tax advice.
Key Risks
- Earnings de-growth: FY26 PAT fell ~3.7% and Q1 FY27 (June 2026) profit dropped ~35% YoY. Sustained weakness could freeze — or eventually pressure — the dividend’s growth trajectory.
- Margin compression: employee costs (+18.9%) and other expenses (+11.7%) grew far faster than the 2.3% revenue rise, squeezing operating margins toward ~12%.
- Cost of new capacity: the Talegaon plant ramp-up lifts depreciation and fixed costs; if volume growth lags, near-term returns can dilute.
- Regulatory overhang: new Labour Codes and the End-of-Life Vehicles (EPR) rules create cost obligations; the company has flagged that the EPR financial impact is not yet quantifiable and no provision has been made.
- Concentration & competition: heavy reliance on the SUV mix (Creta/Venue) in an intensely competitive market where Maruti, Tata and M&M are pushing hard, including in EVs.
- Low absolute yield: at ~0.96%, the payout offers little downside cushion for income-focused investors if the price falls.
What To Monitor
- Monthly volume trends — domestic dispatches and, especially, export momentum, which management has guided to grow 8–10%.
- EBITDA margin recovery — whether operating leverage from the Talegaon plant and price hikes reverses the margin slide.
- Free cash flow direction — can FCF stay positive as capex normalises after the plant build-out?
- Payout policy signals — any move above ₹21 (or a special dividend) would confirm a rising-dividend policy; a hold signals caution.
- New launches and the EV roadmap — execution on the FY27 launch pipeline is the main earnings-growth lever.
- EPR / Labour Code cost crystallisation — once the EPR pricing mechanism is notified, watch for a provision that could dent profit.
Conclusion
Hyundai Motor India’s ₹21 final dividend for FY26 is comfortably affordable but modest. Behind a 210% face-value headline sits a real yield of under 1%. The payout is backed by cash — covered ~3.2x by earnings, ~1.8x by free cash flow and ~6.2x by liquidity — and, unlike FY25, is funded from current operations rather than the balance sheet.
The honest caveat is that the dividend is being held flat in a year of mild earnings de-growth, with a weak start to FY27. For shareholders, the dividend is a small, safe cash return; the investment case rests far more on volume recovery, margin repair and new-model execution than on the payout itself.
Frequently Asked Questions
What dividend has Hyundai Motor India announced for FY26?
What is the Hyundai Motor India dividend yield?
What is the record date for the Hyundai dividend?
What is the ex-dividend date?
When will the dividend be paid?
Who is eligible to receive the dividend?
How is the Hyundai dividend taxed?
Is the Hyundai Motor India dividend sustainable?
What is Hyundai Motor India’s dividend history?
Is the ₹21 dividend an increase over last year?
How much of the dividend goes to the promoter?
What should investors monitor after this dividend?
Is Hyundai Motor India a good dividend stock?
Disclaimer
This article is for informational and educational purposes only and does not constitute investment, financial or tax advice, or any recommendation to buy, sell or hold securities. ShareBazaar Online is not a SEBI-registered investment adviser. Figures are drawn from Hyundai Motor India’s exchange filing dated 8 May 2026 and publicly available secondary sources; market prices and yields are time-sensitive and must be re-verified against live data before acting. All dividend figures remain subject to shareholder approval at the AGM. Investments in securities are subject to market risks; please read all related documents carefully and consult a qualified professional before investing.