
Dividend Snapshot
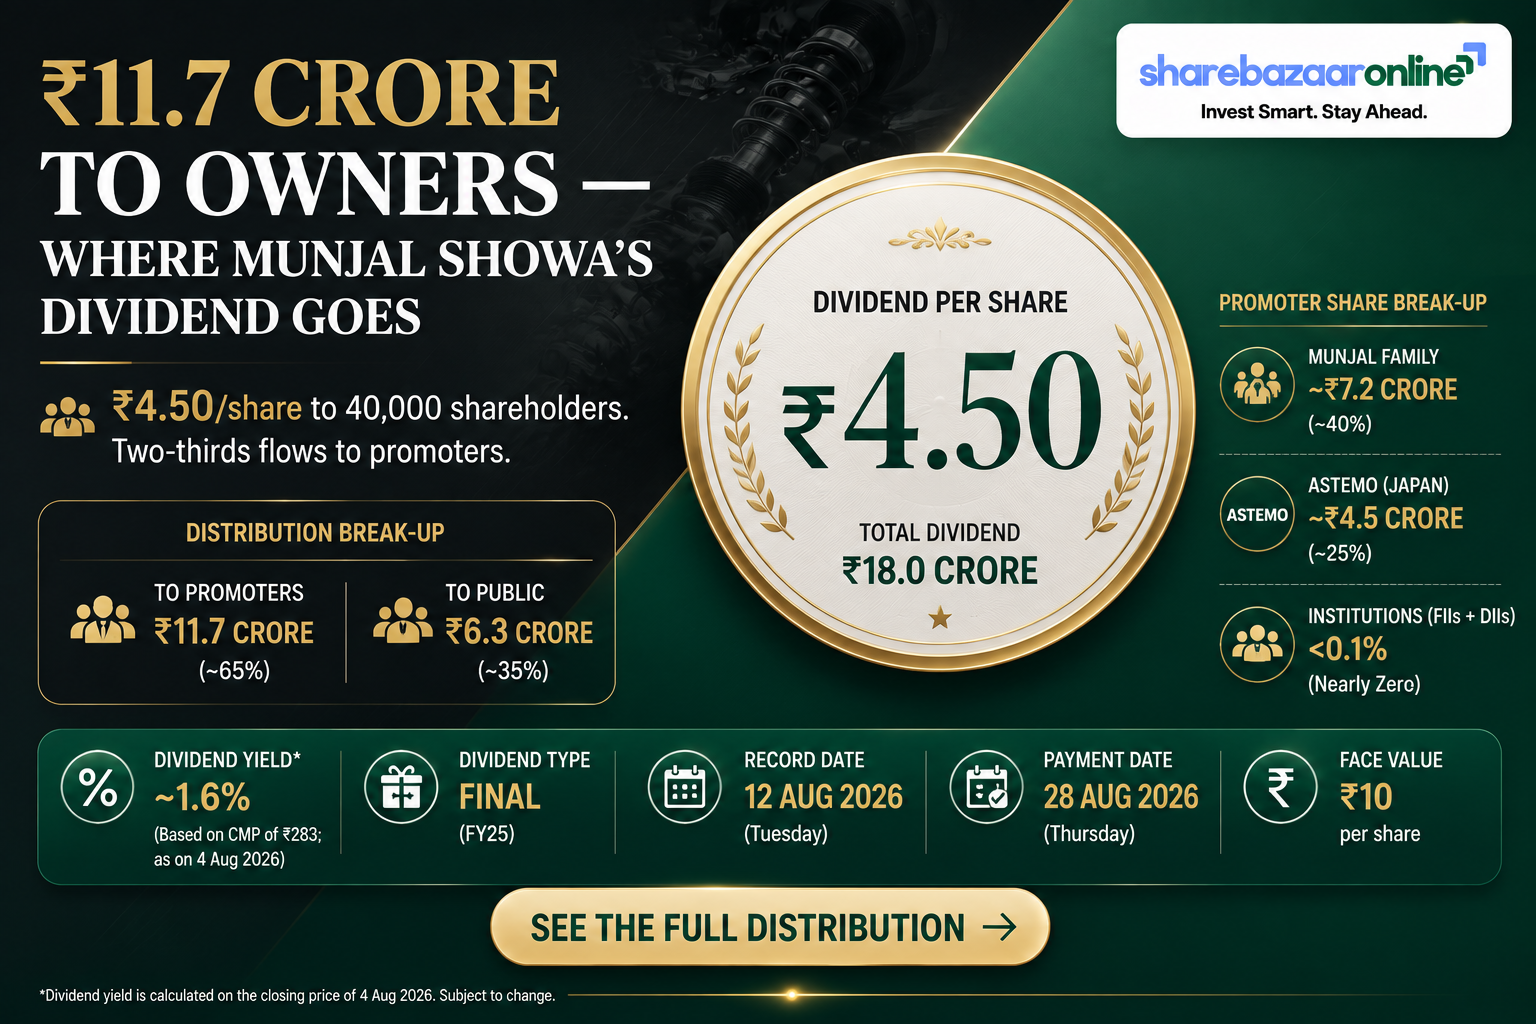
Munjal Showa Limited (NSE: MUNJALSHOW, BSE: 520043) has recommended a final dividend of ₹4.50 per equity share of face value ₹2 — a headline rate of 225% — for the financial year 2025-26. The Munjal Showa dividend was approved by the Board on 29 May 2026 and is subject to shareholder approval at the 41st Annual General Meeting scheduled for 24 August 2026. At the current Munjal Showa share price of roughly ₹137 (NSE, early-mid August 2026), the ₹4.50 payout works out to a dividend yield of about 3.28% — a reminder that a big-sounding "225%" figure is measured on a ₹2 face value, not on what you pay for the share.
The Payout at a Glance
- Dividend per share: ₹4.50
- Dividend rate: 225% on ₹2 face value
- Dividend type: Final (FY 2025-26)
- Total dividend outflow: ₹17.998 crore (₹1,799.78 lakh)
- Approx. yield (CMP ~₹137): 3.28%
- Payout ratio (FY26): 82.3% of profit
Why This One Is Worth a Closer Look
The dividend is easily affordable — Munjal Showa is debt-free and sits on roughly ₹320 crore of cash and liquid investments, about 17.8× the annual payout. But in FY26 the cash to fund it did not come from the business. Operating cash flow swung to negative ₹20.64 crore as trade receivables ballooned ~40%. The company held its long-frozen ₹4.50 dividend by drawing down cash and selling investments — a distinction wire coverage tends to miss.
Dividend Announcement Summary
What the Company Filed
In its outcome of Board Meeting dated 29 May 2026 (filed under Regulation 30 of SEBI LODR), Munjal Showa disclosed that the Board recommended a final dividend of ₹4.50 per fully paid-up equity share of ₹2 each for FY 2025-26, alongside its audited annual results. The dividend, if declared at the ensuing AGM, will be paid within 30 days from the date of the AGM.
The audited results carry an unmodified (clean) audit opinion from Deloitte Haskins & Sells LLP. Munjal Showa has no subsidiary, associate or joint venture, so its standalone accounts are effectively its consolidated position — there is no group layer to look through.
Company Identity
- Company: Munjal Showa Limited
- NSE symbol: MUNJALSHOW
- BSE code: 520043
- ISIN: INE577A01027
- Business: Auto components — shock absorbers, front forks, struts, gas springs (ride-control)
- Key relationship: Hero Group + Japan's Astemo (formerly Showa Corp / Hitachi Astemo)
- Board meeting: 29 May 2026
- Financial year: 2025-26 (April-March)
Key Dates Timeline
A distinctive feature of this payout: the filing states the record date is "Not applicable". Instead, Munjal Showa is using a book closure under Regulation 42 to determine dividend entitlement. The register of members will remain closed from 6 August 2026 to 24 August 2026 (both days inclusive) for the 41st AGM and the dividend (if declared).
| Event | Date | Status |
|---|---|---|
| Board meeting & announcement | 29 May 2026 | Confirmed (filing) |
| Book closure begins | 6 August 2026 | Confirmed (filing) |
| Ex-dividend date | ~5 August 2026 | Inferred — confirm vs NSE/BSE circular |
| Book closure ends / AGM | 24 August 2026 | Confirmed (filing) |
| Dividend payment | By ~23 September 2026 | Within 30 days of AGM (statutory outer limit) |
Record date is stated as "Not applicable"; entitlement is fixed by the book closure. The ex-date above is inferred from the book-closure start and Munjal Showa's consistent early-August pattern in prior years — it must be verified against the official NSE/BSE corporate-action circular before relying on it.
Dividend Yield Analysis
"225%" is a face-value figure, not a return. The number that matters for an investor is the dividend yield — the ₹4.50 payout divided by the price you actually pay.
Yield on Different Prices
- On current price (~₹137): 3.28%
- On announcement-day price (~₹140): 3.21%
- On 52-week low (~₹104): ~4.3%
- On 52-week high (~₹158): ~2.8%
Share price and 52-week range sourced from public market data (NSE/BSE), early-mid August 2026. Yields move with price and must be re-checked live.
Reading the Yield Honestly
At ~3.3%, Munjal Showa's yield sits well above most fast-growing auto-ancillary peers (many yield under 1%). But a high relative yield here is not purely a sign of generosity. It partly reflects a depressed share price — the stock trades at roughly 0.8× book value, below the value of its own net assets — and a mature, low-growth business that returns cash because it has limited high-return reinvestment options. High yield born of a low price is a very different thing from high yield born of a rising dividend.
Dividend History Analysis
Munjal Showa is a remarkably consistent — but frozen — payer. It has distributed exactly ₹4.50 per share every year for eight straight years (FY18 through FY26). Before that, the dividend climbed steadily from ₹2.00 (FY10) to ₹4.50 (FY18), and has not moved since.
| Financial Year | Dividend / Share | Rate (on ₹2 FV) |
|---|---|---|
| FY26 (proposed) | ₹4.50 | 225% |
| FY25 | ₹4.50 | 225% |
| FY24 | ₹4.50 | 225% |
| FY23 | ₹4.50 | 225% |
| FY22 | ₹4.50 | 225% |
| FY21 | ₹4.50 | 225% |
| FY20 | ₹4.50 | 225% |
| FY18-FY19 | ₹4.50 | 225% |
| FY17 | ₹4.00 | 200% |
Dividend history compiled from public dividend records (NSE corporate actions and dividend aggregators such as TipRanks/Trendlyne). Per-share amounts shown on the current ₹2 face value.
Classification: Consistent Payer — but static
There have been no cuts, no suspensions and no special dividends in recent years — a genuinely reliable record that supports the "consistent payer" label. The flip side: the dividend has shown 0% growth over eight years. For an income investor, the cash has been dependable; for a growth-plus-income investor, the payout has not kept pace with inflation.
Financial Performance Analysis
| Metric (₹ crore) | FY26 | FY25 | Change |
|---|---|---|---|
| Revenue from operations | 1,315.42 | 1,250.45 | +5.2% |
| Other income | 19.55 | 30.27 | -35.4% |
| Operating EBITDA* | 22.95 | 16.92 | +35.7% |
| Exceptional item (Labour Codes gratuity) | 2.20 | — | one-off charge |
| Profit before tax | 29.58 | 35.16 | -15.9% |
| Net profit (PAT) | 21.87 | 28.87 | -24.2% |
| EPS (₹) | 5.47 | 7.22 | -24.2% |
*Operating EBITDA computed as PBT (before exceptional) + depreciation + finance cost, less other income. Figures from the company's audited FY26 results (Rs in lakhs, converted to crore).
The Headline vs the Engine
At first glance FY26 looks weak — profit fell 24% and EPS dropped from ₹7.22 to ₹5.47. But the core operating business actually improved: operating EBITDA rose +35.7% on 5.2% higher revenue. The profit decline was driven by three items outside core operations: other (investment) income fell ₹10.7 crore, a one-off ₹2.20 crore Labour Codes gratuity charge hit the P&L, and the effective tax rate rose from ~17.9% to ~26.1%.
Margins Remain Wafer-Thin
Even after improving, operating EBITDA margin is only about 1.7% of revenue — typical of a commoditised, OEM-dependent auto-ancillary with limited pricing power. A meaningful share of reported profit historically comes from investment/other income rather than the manufacturing operation, which is why a soft "other income" year drags PAT down sharply. Encouragingly, Q1 FY27 (quarter to June 2026) showed a rebound, with PAT of about ₹11.2 crore.
Cash Flow Analysis
The Most Important Number in This Report
Reported profit was a positive ₹21.87 crore, but operating cash flow was negative ₹20.64 crore in FY26 — a swing of nearly ₹57 crore from the previous year's +₹36.61 crore. In other words, the business consumed cash last year rather than generating it. Cash conversion (OCF ÷ PAT) collapsed from a healthy 1.27× to -0.94×.
What Drained the Cash: Receivables
The culprit is working capital. Trade receivables jumped ~40%, from ₹167.86 crore to ₹234.66 crore — an increase of ₹66.80 crore — while revenue grew only 5.2%. Days sales outstanding stretched from about 49 to 65 days. Money that would normally have arrived as cash was instead locked up in amounts owed by customers, turning a profitable year into a cash-negative one.
So How Was the Dividend Funded?
Free cash flow (OCF minus capex) was negative ₹27.21 crore, versus +₹29.81 crore a year earlier — so FCF covered -1.51× of the dividend (i.e. it did not cover it at all). The ₹18.02 crore of dividend paid during FY26 was funded not by operations but by drawing down the cash balance and liquidating investments. This year's dividend was a balance-sheet distribution, not an earnings distribution.
This is not automatically alarming for a debt-free, cash-rich company — a one-year receivables build can reverse. But it is exactly the kind of divergence between reported profit and real cash that aggregator coverage skips, and it is the single most important thing to watch going forward.
Balance Sheet Strength
If the cash-flow section is the worry, the balance sheet is the reassurance. Munjal Showa is essentially debt-free and deeply net-cash.
Liquidity Position (FY26)
- Cash & cash equivalents: ₹0.98 cr (down from ₹26.01 cr)
- Current investments: ₹318.41 cr
- Core liquid resources: ~₹320 cr
- Borrowings: negligible (finance cost only ₹0.14 cr)
- Net position: Net cash
- Book value / share: ~₹169.5 (P/B ~0.81×)
Two Nuances Behind the Strength
1. The cash "collapse" is optical. The bank balance fell from ₹26 cr to under ₹1 cr, but that money largely shifted into current investments (₹318 cr) — and part was used to fund the dividend. Total liquidity remains very large.
2. The market values it below its assets. With a market cap of roughly ₹549 cr against ~₹320 cr of liquid investments and a debt-free book, the stock trades at ~0.8× book value — the market is assigning little value to the operating business itself.
Dividend Sustainability Analysis
Sustainability is best judged on four separate coverage tests. Munjal Showa passes decisively on two, fails on two — a genuinely mixed picture that a single verdict would flatten.
| Coverage Test | Reading | Verdict |
|---|---|---|
| Earnings coverage (EPS ÷ DPS) | 1.22× | Thin / amber |
| Operating cash flow coverage | Negative OCF | Fail (FY26) |
| Free cash flow coverage | -1.51× | Fail (FY26) |
| Cash / liquidity coverage | ~17.8× | Strong pass |
Overall: Affordable, but not self-funding this year
Can Munjal Showa afford ₹4.50? Yes, comfortably — it holds roughly 18 years of dividends in liquid investments and carries no debt. Is the dividend being funded by the business right now? No — in FY26 it was funded from the balance sheet because operating and free cash flow were negative. The honest classification is "Moderately Sustainable": rock-solid on affordability, but dependent on the receivables build reversing and cash generation normalising for the payout to become self-funding again. The FY26 payout ratio of 82% also leaves little room if profits stay soft while the dividend stays fixed at ₹4.50.
Peer Comparison
| Company | Div. Yield | Payout | ROE | ROCE | Balance sheet |
|---|---|---|---|---|---|
| Munjal Showa | ~3.3% | ~82% (FY26) | ~2-3% | low | Net cash |
| Gabriel India* | ~0.35% | ~27% | ~19.6% | ~30% | Net cash |
| Munjal Auto | ~1.1% | ~25% | ~8.2% | ~11% | Low debt |
*Gabriel India is Munjal Showa's most direct competitor in ride-control (shock absorbers, struts, front forks). Peer figures from public market data and Screener.in, mid-2026; approximate and to be re-verified before publication.
The Real Story in This Table
Munjal Showa has by far the highest yield and highest payout in this group — yet the lowest return ratios. Its closest competitor, Gabriel India, yields a fraction of a percent and pays out barely a quarter of profit, but earns ~20% on equity and ~30% on capital and is growing ~20% a year. That contrast captures the trade-off perfectly: Gabriel retains cash because it can reinvest it at high returns; Munjal Showa returns cash because it cannot. A high yield relative to peers can be a symptom of low growth, not superior shareholder generosity.
Promoter Impact Analysis
Where the ₹18 Crore Goes
- Promoters (65.02%): ~₹11.70 cr
- • Indian promoter / Munjal family (~40.12%): ~₹7.22 cr
- • Foreign promoter / Astemo (~24.90%): ~₹4.48 cr
- Public & minority (34.98%): ~₹6.30 cr
- FIIs (0.09%) / DIIs (0.01%): negligible
Shareholding as on March 2026 (company/exchange disclosures). Rupee split is our calculation on the total ₹17.998 cr outflow.
What This Tells You
Roughly two-thirds of every dividend rupee flows to the promoter group, split between the Munjal family and the Japanese technology partner, Astemo. With institutional ownership almost nil, the dividend is effectively a channel that rewards the controlling shareholders and a base of retail holders. Given the company's very low return ratios and limited reinvestment appetite, a steady payout is a rational way to move surplus cash to owners — but public shareholders should note that they receive the same fixed ₹4.50 whether the business grows or not.
Taxation Analysis
How Dividends Are Taxed in India
Since the abolition of Dividend Distribution Tax (Finance Act 2020), dividends are taxed in the hands of the shareholder at their applicable income-tax slab rate. The dividend is added to "Income from Other Sources".
TDS: under Section 194, the company deducts 10% TDS only if total dividend from that company exceeds ₹5,000 in a financial year (20% if PAN is not provided). Below that threshold, no TDS is deducted — but the income is still taxable in your return.
Worked Example — 1,000 Shares
- Shares held: 1,000
- Gross dividend (1,000 × ₹4.50): ₹4,500
- TDS under Sec 194: ₹0 (below the ₹5,000 threshold)
- Investor slab: 30% (+4% cess = 31.2%)
- Tax payable: ₹1,404
- Net dividend in hand: ₹3,096
- Post-tax yield (at ~₹137): ~2.26%
The takeaway for a top-slab investor: a ~3.3% headline yield becomes roughly 2.3% after tax. Investors in lower slabs keep more; those in the 5% or 20% brackets face proportionately lower tax. This is a worked illustration, not tax advice — individual liability depends on your total income and residency status.
Key Risks
1. Negative cash flow & receivables stretch
FY26 operating cash flow was negative ₹20.64 crore as receivables jumped ~40% and DSO rose from 49 to 65 days. If this working-capital build does not reverse, the dividend will keep drawing on reserves rather than earnings.
2. Customer concentration & OEM dependence
As an auto-ancillary, Munjal Showa depends heavily on a small set of two-wheeler and four-wheeler OEMs. Loss of share at a major customer, or a shift in OEM sourcing, would hit volumes directly — a risk the company has faced historically.
3. Structurally low returns & thin margins
Return on equity of only ~2-3% and operating EBITDA margin under 2% signal a low-pricing-power business. Much of reported profit leans on investment/other income, making earnings sensitive to non-operating swings.
4. EV transition & product-mix risk
The shift to electric two- and four-wheelers is reshaping component demand. Suspension and ride-control parts remain relevant, but the company must keep winning EV platforms and premium-segment content to protect its addressable market.
5. Frozen dividend meeting soft profits
With the payout fixed at ₹4.50 for eight years and FY26 payout at ~82%, a further dip in profit would push the payout ratio uncomfortably high — and an income tax demand notice reported earlier in 2026 is a reminder that contingent claims can arise.
What To Monitor
- 1. Receivables & DSO: Do trade receivables come back down toward FY25 levels, restoring positive operating cash flow? This is the single most important item.
- 2. Operating cash flow trend: A return to OCF/PAT above 1.0× would confirm the FY26 cash squeeze was a one-off.
- 3. Quarterly PAT recovery: Q1 FY27 already showed a rebound (~₹11.2 cr PAT). Watch whether momentum holds.
- 4. Order wins & customer mix: New OEM platforms (including EV) and any change in dependence on top customers.
- 5. Dividend policy signals: Any move off the fixed ₹4.50 — up (confidence) or a special payout from the large cash pile — would be a meaningful signal.
- 6. AGM outcome & ex-date circular: Confirm the dividend is formally declared on 24 Aug 2026 and verify the official ex-date/record particulars.
Conclusion
Munjal Showa's FY26 final dividend of ₹4.50 per share (225%) continues one of the most stable payout records in the auto-ancillary space — eight straight years at the same rate, no cuts, no suspensions, backed by a debt-free, net-cash balance sheet with roughly ₹320 crore of liquid investments. On affordability, the payout is beyond doubt.
The nuance — and the part most coverage misses — is that FY26 was a year the dividend was funded from the balance sheet, not the business. Operating cash flow turned negative (-₹20.64 cr) and free cash flow was -₹27.21 cr, driven by a ~40% surge in receivables, even as the core operating engine (EBITDA +35.7%) actually improved. Reported PAT fell 24%, but largely on lower other income, a one-off Labour Codes charge and higher tax rather than operating weakness. Meanwhile, a ~3.3% yield and a below-book valuation reflect a mature, low-return business, not a bargain-rich growth story — the mirror image of faster-growing peer Gabriel India.
The honest verdict is a "Moderately Sustainable" dividend: safe to fund from a fortress balance sheet, but not self-funding in FY26. Whether it becomes self-funding again hinges on receivables normalising and cash generation recovering — the very things Q1 FY27's rebound will be tested against. We present the positives, the negatives, the risks and the monitoring points; the investment decision is yours.
Frequently Asked Questions
What dividend has Munjal Showa announced for FY 2025-26?
What is the Munjal Showa dividend yield?
What is the record date for the Munjal Showa dividend?
What is the ex-dividend date?
When will the dividend be paid?
Who is eligible to receive the dividend?
How is the Munjal Showa dividend taxed?
Is the Munjal Showa dividend sustainable?
What is Munjal Showa's dividend history?
Why did net profit fall 24% if the dividend is unchanged?
How does Munjal Showa compare with Gabriel India on dividends?
What should investors monitor from here?
Disclaimer
This article is for informational and educational purposes only and does not constitute investment, financial, legal or tax advice, nor a recommendation to buy, sell or hold any security. ShareBazaar Online is not a SEBI-registered investment adviser or research analyst. Dividend declarations are subject to shareholder approval at the AGM and may change. Figures relating to the dividend, dates, shareholding and audited results are drawn from Munjal Showa Limited's exchange filing dated 29 May 2026; market price, dividend history, shareholding and peer data are sourced from public exchange and third-party financial data providers and were accurate to the best of our knowledge as of publication. Share prices, yields and ratios are price-dependent and change continuously — readers must verify the current market price and the official NSE/BSE corporate-action circular before acting. The inferred ex-date has not been confirmed. Investments in securities are subject to market risks; please read all related documents carefully and consult a SEBI-registered adviser and a qualified tax professional before making any decision. ShareBazaar Online and its authors accept no liability for any loss arising from the use of this information.