
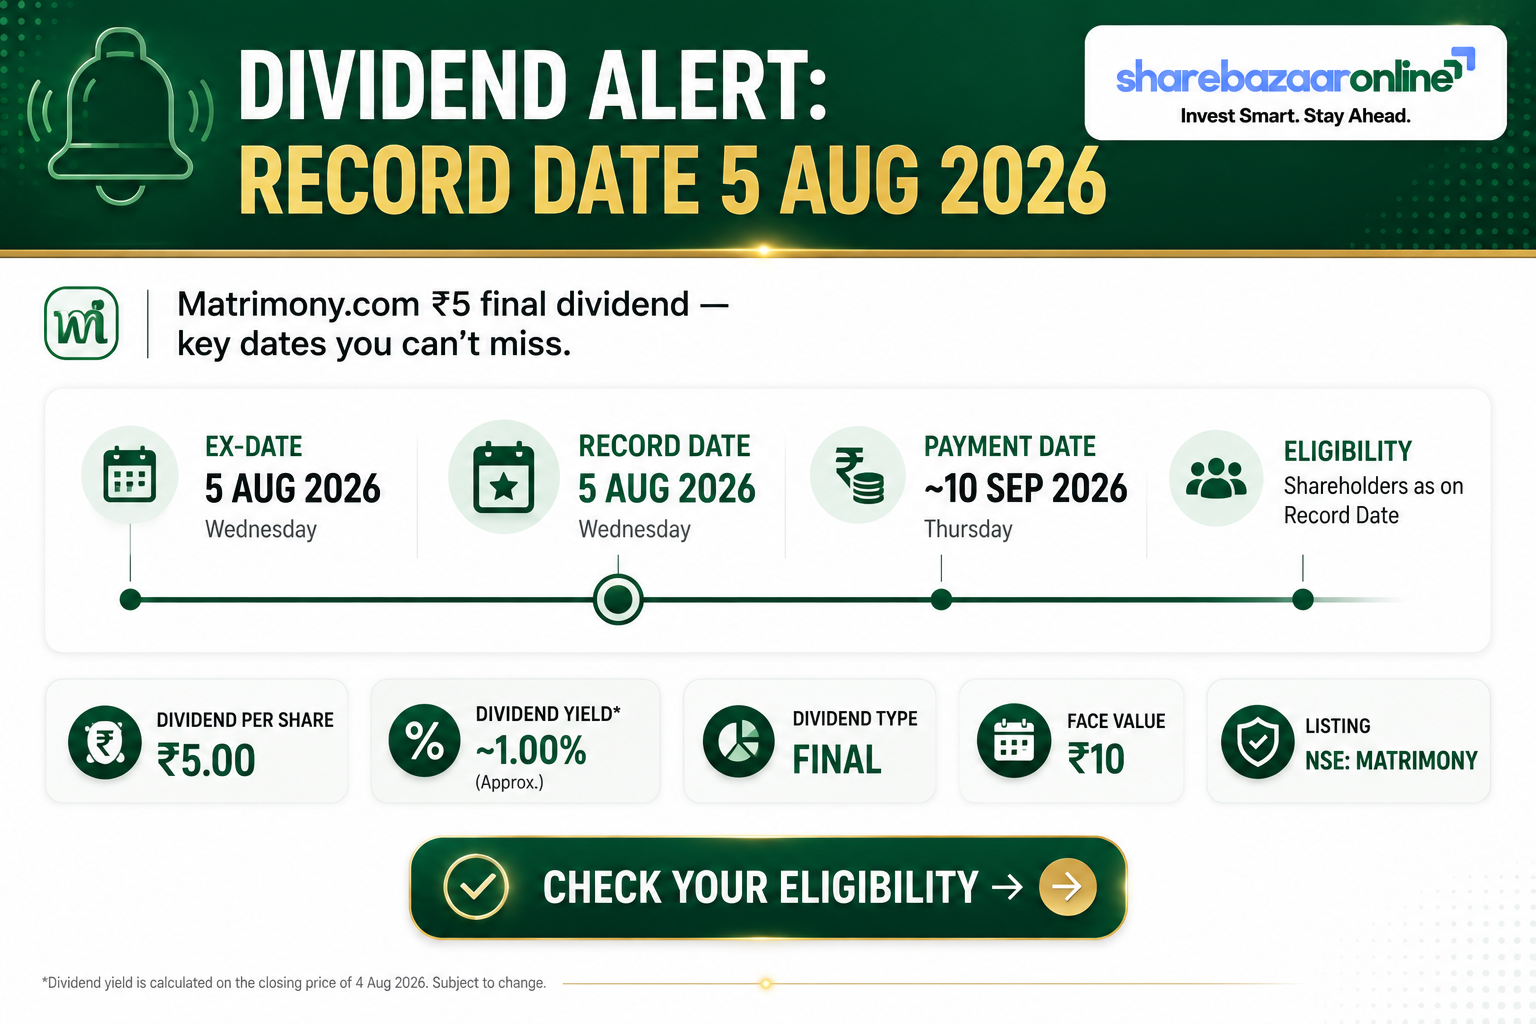
Dividend Snapshot
Matrimony.com Limited (NSE: MATRIMONY, BSE: 540704) has declared a final dividend of ₹5 per share for FY2026, amounting to 100% of the ₹5 face value. The board recommended the payout at its meeting on 14 May 2026, and shareholders approved it at the 25th Annual General Meeting held on 11 August 2026. On the latest market price of about ₹500, the dividend translates to a modest trailing yield of roughly 1.0% — a useful reminder that a headline "100% dividend" is a percentage of face value, not of what you pay for the share.
Dividend Announcement Summary
Under Regulation 30(4) of SEBI (LODR) Regulations, 2015, the board of Matrimony.com Limited, at its meeting on 14 May 2026, recommended a final dividend of ₹5 per equity share of face value ₹5 each for the financial year ended 31 March 2026. The company simultaneously fixed 5 August 2026 as the record date and, being a final dividend, made the payout subject to shareholder approval at the AGM. That approval was granted on 11 August 2026.
This is a continuation of the company's steady distribution policy rather than a special reward. Notably, the same board meeting also reviewed FY2026 results, which showed Q4 net profit up 19% year-on-year but full-year profit down about 24% versus FY2025 — a divergence explored in the financial-performance section below.
Key Dates Timeline
Ex-date and record date coincide under the T+1 settlement regime. Payment date is the company's indicated timeline; the statutory outer limit is 30 days from AGM declaration. Please re-verify against the NSE/BSE corporate-action circular.
Dividend Yield Analysis
Yield reality check: the "100%" figure refers to face value (₹5), so the actual cash return is just ₹5 per share. Against a market price near ₹500, that is about 1% — roughly in line with, or slightly above, the online-services peer average and well below what a pure income investor would seek. The yield moves inversely with the share price: it was closer to 1.16% when the stock traded near ₹430 around the announcement.
Matrimony.com is better understood as a modest-yield, cash-generative compounder than as a high-yield dividend stock. Its appeal on the income side is consistency and coverage rather than headline yield.
Dividend History Analysis
| Financial Year | Dividend / Share | % of Face Value | Notes |
|---|---|---|---|
| FY2018 | ₹1.50 | 30% | First post-IPO dividend |
| FY2019 | ₹1.50 | 30% | Flat |
| FY2020 | ₹3.50 | 70% | Step-up |
| FY2021 | ₹3.50 | 70% | Flat |
| FY2022 | ₹5.00 | 100% | Raised to ₹5 |
| FY2023 | ₹5.00 | 100% | Flat |
| FY2024 | ₹5.00 | 100% | Flat |
| FY2025 | ₹10.00 | 200% | ₹5 interim + ₹5 final (one-off elevated) |
| FY2026 | ₹5.00 | 100% | Current — final only |
Don't misread FY2025 → FY2026 as a 50% cut. FY2025's ₹10 included a one-time ₹5 interim declared in March 2025 on top of the regular ₹5 final. Strip that out and the regular final dividend has been steady at ₹5 for five straight years (FY2022–FY2026). The company's per-share payout has grown at roughly a 16% CAGR since FY2018, though the trajectory has been flat for the last five regular finals.
Classification: Consistent Payer. Matrimony.com has paid an uninterrupted, non-declining annual dividend for eight consecutive years, with no suspensions. It is one of the few Indian consumer-internet companies to distribute cash to shareholders at all.
Financial Performance Analysis
| Metric (Consolidated) | FY2024 | FY2025 | FY2026 |
|---|---|---|---|
| Revenue (₹ Cr) | 481 | 456 | 460 |
| Operating Profit (₹ Cr) | 72 | 58 | 51 |
| Operating Margin | 15% | 13% | 11% |
| Other Income (₹ Cr) | 26 | 34 | 24 |
| Net Profit (₹ Cr) | 50 | 45 | 34 |
| EPS (₹) | 22.26 | 21.00 | 16.53 |
Operating leverage in reverse
Revenue was broadly flat (₹456 Cr → ₹460 Cr), but operating profit fell from ₹58 Cr to ₹51 Cr and margin compressed from 13% to 11%. Costs rose faster than the top line — a sign of negative operating leverage, driven by continued investment in the platform (AI features, retail expansion) against a stagnant subscriber base.
Earnings quality flag
Reported profit before tax of about ₹43 Cr includes ₹24 Cr of other (largely treasury) income — over half of pre-tax profit. Core matchmaking economics are weaker than the headline PAT suggests. FY2026 net profit fell ~24% YoY, partly because FY2025 was flattered by a higher ₹34 Cr other-income line.
Growth profile: five-year revenue CAGR is just ~4%, three-year sales CAGR is effectively 0%, and profit has declined at a low-single-digit CAGR over five years. This is a mature, cash-generative but low-growth business — context that explains why management returns cash via dividends and buybacks rather than heavy reinvestment.
Cash Flow Analysis
Reported profit is an accounting opinion; cash is fact — and here the cash story is stronger than the profit story. In FY2026 the company generated ₹75 Cr of operating cash flow against just ₹34 Cr of net profit, a cash conversion (CFO/Operating Profit) of about 166%. This is typical of an asset-light subscription model that collects membership fees upfront (negative working capital).
How is the dividend funded?
Entirely from current operating cash. Free cash flow of ₹65 Cr covers the ~₹10.3 Cr dividend more than 6 times over. No borrowing or asset sales are involved. The large –₹101 Cr financing outflow reflects the dividend plus a ₹58.5 Cr share buyback completed in December 2025 — so most cash returned to shareholders went via buyback, not dividend.
Receivables note: debtor days are near zero (a subscription business is paid before service), so there is no gap between reported revenue and cash collection to worry about. The company's working-capital cycle is structurally negative — a genuine strength for dividend durability.
Balance Sheet Strength
The balance sheet is effectively net cash: liquid investments of about ₹195 Cr exceed total borrowings of ~₹49 Cr, leaving a net cash position of roughly ₹146 Cr. Much of the ₹49 Cr "borrowing" is lease liabilities (Ind AS 116) tied to office and retail space rather than funded debt. Return on equity is ~15.2% and return on capital employed ~17.4%.
Reserves declined from ~₹231 Cr (FY2025) to ~₹196 Cr (FY2026), reflecting the buyback and dividends rather than any operating weakness. Even so, the company can comfortably sustain its current payout for many years from cash on hand alone.
Dividend Sustainability Analysis
| Coverage Test | Figure | Verdict |
|---|---|---|
| Earnings coverage (EPS/DPS) | 3.31x | Pass |
| Payout ratio | ~30% | Pass (conservative) |
| Operating cash coverage | 7.3x | Pass |
| Free cash flow coverage | 6.3x | Pass |
| Cash / liquidity coverage | ~18.9x | Pass |
Verdict: Sustainable. Every affordability test passes with a wide margin. The ₹5 dividend consumes only about 30% of earnings and a fraction of free cash flow, and the company sits on net cash. The only caveat is earnings trend: profit is declining and a meaningful part of it is treasury income. Affordability is not in question; what bears watching is whether the core business can resume growth so the dividend can rise from here rather than merely hold.
Peer Comparison
| Company | Dividend Yield | Payout | ROE | ROCE |
|---|---|---|---|---|
| Matrimony.com | ~1.0% | ~30% | 15.2% | 17.4% |
| Info Edge (Naukri) | Token (<0.5%) | Low | Not Independently Verified | Not Independently Verified |
| Eternal (Zomato) | Nil | Nil | Not Independently Verified | Not Independently Verified |
| PB Fintech (Policybazaar) | Nil | Nil | Not Independently Verified | Not Independently Verified |
| One97 (Paytm) | Nil | Nil | Not Independently Verified | Not Independently Verified |
The standout point: Matrimony.com is almost the only dividend payer in India's listed consumer-internet cohort. Its high-growth peers — Eternal, PB Fintech and Paytm — return no cash, reinvesting instead. That makes Matrimony a rare "profitable, cash-returning" internet name, but also signals that its growth runway is narrower than theirs. Peer ROE/ROCE cells marked "Not Independently Verified" are left blank rather than filled with unconfirmed figures; the desk should populate them from primary sources before publishing.
Promoter Impact Analysis
Founder-led promoters (Murugavel Janakiraman and family) take home about ₹6 Cr of the ~₹10.3 Cr payout. More significant than the dividend, though, is that promoter holding has climbed from ~51.6% (FY2024) to 58.4% — partly a mechanical effect of successive buybacks in which promoters did not tender, shrinking the share count and lifting their percentage stake.
Alignment vs. distribution: because promoters own a majority, the dividend is largely a promoter cash-return channel — but every rupee is paid on the same per-share basis, so minority shareholders are treated identically. Institutional ownership has drifted lower (DIIs down to ~5.2%), which is worth watching as a sentiment signal.
Taxation Analysis
Since April 2020, dividends are taxable in the hands of the shareholder at their applicable income-tax slab rate (dividend distribution tax was abolished). The company deducts TDS at 10% under Section 194 if a resident shareholder's total dividend from that company exceeds ₹5,000 in a financial year (this threshold was raised from ₹5,000; confirm the current-year limit). TDS is a credit, not a final tax — the real liability is your slab rate.
Worked example — 1,000 shares, 30% slab
A holder of just over 1,000 shares would cross the ₹5,000 threshold and see 10% TDS applied, adjustable against final tax. Add applicable cess/surcharge for higher incomes. This is a simplified illustration, not tax advice.