
Shreyans Industries Dividend 2026: ₹1.50 Final Dividend Analysis, Yield, Record Date & Sustainability
Shreyans Industries Limited (NSE: SHREYANIND | BSE: 516016) has recommended a final dividend of ₹1.50 per share for FY 2025-26. On the surface it is a routine payout — but it is actually a 70% cut from the ₹5.00 the paper maker paid for three years running, and the reason lies deep in the profit-and-loss account. This ShareBazaar Online analysis goes past the headline to the cash, the coverage and the earnings quality.
Dividend Snapshot
Dividend Type
Final Dividend
Dividend Per Share
₹1.50
Dividend (on Face Value)
15% (FV ₹10)
Dividend Yield (on CMP)
~1.09%
Financial Year
FY 2025-26
Record Date
05 Aug 2026
Announcement Date
20 May 2026
Ex-Date
05 Aug 2026
AGM Date
12 Aug 2026
Payment
Within 30 days of AGM
Dividend Outflow
~₹2.07 Cr
Payout Ratio
32.1% of EPS
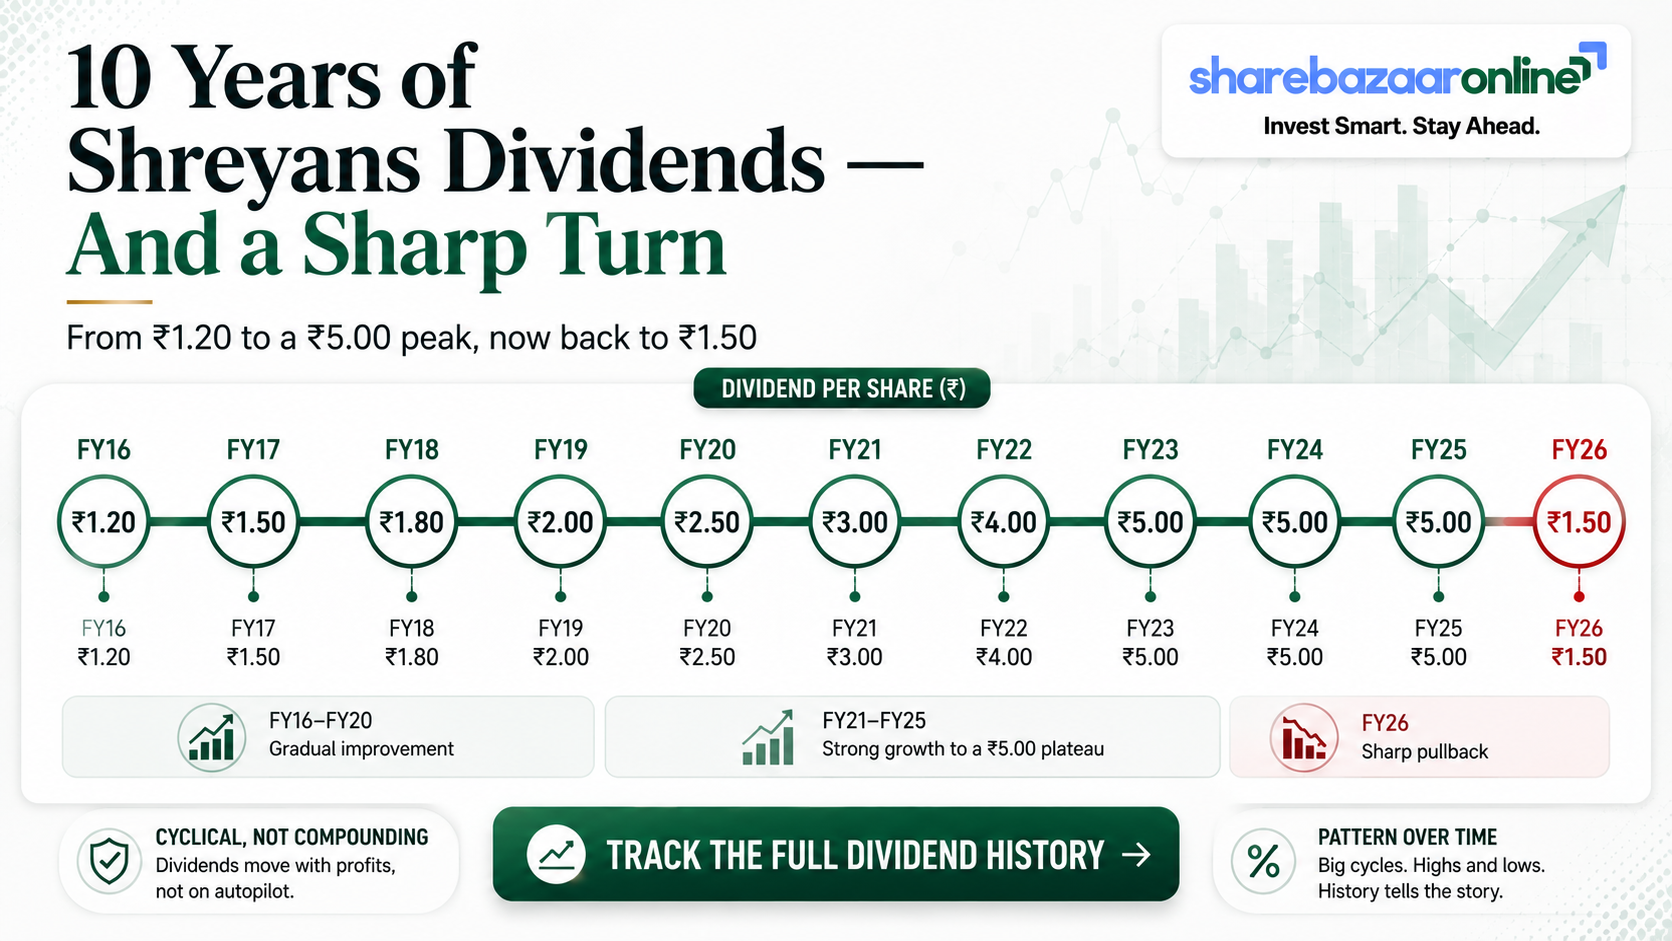
The one number that matters: this ₹1.50 payout is 70% lower than the ₹5.00 Shreyans paid in FY23, FY24 and FY25. The cut mirrors an earnings collapse — FY26 net profit fell ~87% to ₹6.47 Cr from ₹50.60 Cr. All yield figures depend on the live market price and should be re-verified before acting.
Dividend Announcement Summary
At its board meeting on 20 May 2026, the Board of Shreyans Industries Limited — a Ludhiana-based writing & printing paper maker of the Oswal group — approved audited FY26 results and recommended a final dividend of ₹1.50 per fully paid equity share (face value ₹10), subject to shareholder approval at the 46th AGM. The statutory auditors, SCV & Co. LLP, issued an unmodified (clean) opinion.
The company runs a single reportable segment — Writing & Printing Paper — and confirmed it has no subsidiary, associate or joint venture as on 31 March 2026. Consolidated and standalone numbers are therefore identical.
The same board meeting also cleared management-transition items: CFO Mr. Rakesh Kumar Mahajan retires (30 May 2026, on superannuation) and Mr. Amit Arora joins as CFO from 1 June 2026. The Board re-appointed the three Oswal brothers — Rajneesh (CMD), Vishal (Vice-CMD) and Kunal (Whole-Time Director) — for fresh three-year terms.
Company Identifiers
NSE: SHREYANIND | BSE: 516016
ISIN: INE231C01019
CIN: L17115PB1979PLC003994
Key Dates Timeline
| Event | Date | Status / Note |
|---|---|---|
| Board Meeting / Announcement | 20 May 2026 | Dividend recommended |
| Record Date | 05 Aug 2026 | Eligibility cut-off (confirmed) |
| Ex-Date | 05 Aug 2026 | Aligned to record date (T+1 convention) |
| 46th AGM | 12 Aug 2026 | Shareholder approval, 11:00 AM, Ludhiana |
| Payment / Credit | By ~11 Sep 2026 | Within 30 days of AGM (statutory outer limit; exact date not disclosed by company) |
Ex-date/record-date should be re-verified against the NSE/BSE corporate-action circular before publication.
Dividend Yield Analysis
The board announced a "15% dividend", which sounds generous. But that 15% is calculated on the ₹10 face value, not on what you pay in the market. On the latest market price of about ₹137.98 (NSE, 13 Jul 2026 — re-verify before publishing), the real cash return works out to:
₹1.50 ÷ ₹137.98 × 100 =
~1.09% yield
Yield reality check
Do not confuse the 15% face-value dividend with a 15% return — the actual yield is roughly 1.1%. Note also that yield here is rising for the wrong reason: the share has fallen from a 52-week high near ₹250, and a lower price mathematically lifts the yield even as the absolute dividend was cut. A stable-to-higher yield-on-cost this year is a symptom of price weakness, not of a stronger payout.
Dividend History Analysis
| Financial Year | Dividend / Share | Type |
|---|---|---|
| FY 2025-26 | ₹1.50 | Final (proposed) — cut |
| FY 2024-25 | ₹5.00 | Final |
| FY 2023-24 | ₹5.00 | Final |
| FY 2022-23 | ₹5.00 | Final |
| FY 2021-22 | ₹2.00 | Final |
| FY 2020-21 | ₹3.00 | Final |
| FY 2019-20 | ₹3.00 | Interim |
| FY 2018-19 | ₹5.00 | Final |
| FY 2017-18 | ₹1.80 | Final |
| FY 2016-17 | ₹1.50 | Final |
| FY 2015-16 | ₹1.20 | Final |
Dividend history compiled from aggregator/exchange records (TipRanks, Simply Wall St). FY16-FY26 declared amounts; the company has not conducted a stock split or bonus affecting comparability.
Classification: Cyclical Payer. Shreyans has paid a dividend every year for a decade, but the amount tracks profits closely — it climbed from ₹1.20 to a ₹5.00 plateau (FY23-FY25) and has now been pulled back to ₹1.50, roughly the FY17 level. This is not a broken dividend, but it is clearly not a "steadily growing" one either.
Financial Performance Analysis
| ₹ Cr (consolidated) | FY26 | FY25 | Change |
|---|---|---|---|
| Revenue from Ops | 622.83 | 616.77 | +0.98% |
| Total Expenses | 626.47 | 566.83 | +10.52% |
| PBT | 7.78 | 67.75 | -88.5% |
| Net Profit (PAT) | 6.47 | 50.60 | -87.2% |
| EPS (₹) | 4.68 | 36.60 | -87.2% |
The operating-leverage trap
Revenue barely moved (+0.98%) but costs jumped +10.52%, and profit was crushed. The squeeze came from two inputs a paper mill cannot escape:
- Power & Fuel: +22.58% (₹109.19 Cr → ₹133.85 Cr) — now 21.5% of revenue vs 17.7% a year ago.
- Cost of materials: +14.77% (₹266.33 Cr → ₹305.67 Cr).
- Employee cost was flat (−0.68%), so the damage was raw-material and energy inflation, not wages.
Earnings-quality red flag: Revenue minus total expenses was a ₹3.64 Cr operating loss. The reported ₹7.78 Cr PBT exists only because of ₹11.42 Cr of other income (interest + investment gains) — i.e. other income was 147% of PBT. The core paper business did not make money this year; the treasury book did.
The stress was concentrated in the fourth quarter: Shreyans posted a Q4 FY26 net loss of ₹10.48 Cr (EPS −₹7.58) versus a ₹18.46 Cr profit a year earlier, dragged partly by a ~₹9.31 Cr fair-value loss on investments in the quarter. Return ratios collapsed accordingly: ROE fell to 1.52% (from ~12.5%) and ROCE to ~2.44% (from ~14.8%), both matching the company's own disclosed figures.
Cash Flow Analysis
| ₹ Cr | FY26 | FY25 |
|---|---|---|
| Operating Cash Flow (net) | 14.46 | 44.95 |
| Capex (PPE + advances) | 52.68 | 46.32 |
| Free Cash Flow | -38.22 | -1.37 |
| Dividend paid (in year) | 6.87 | 6.83 |
Cash is where the picture gets nuanced. Operating cash flow fell to ₹14.46 Cr (from ₹44.95 Cr), and after a heavy ₹52.68 Cr capex programme, free cash flow was negative ₹38.22 Cr. FCF was mildly negative in FY25 too.
How is the dividend funded? Not from current-year free cash flow (which is negative). It is funded from the company's large investment/cash reserves and a modest rise in borrowings during the year. Because the payout itself is tiny (₹2.07 Cr), the balance sheet absorbs it easily — but investors should be clear that FY26's distribution is a balance-sheet decision, not an earnings-and-cash decision.
Balance Sheet Strength
Total Equity
₹426.78 Cr
Cash + Investments
₹222.67 Cr
Total Borrowings
₹59.30 Cr
Net Cash Position
~₹163 Cr
This is the counterweight to the weak P&L. Shreyans is net-cash: it holds roughly ₹222.67 Cr in cash and investments (mostly a ₹211 Cr current-investment book) against only ₹59.30 Cr of borrowings — a net cash cushion of about ₹163 Cr. Strikingly, the market value of its investments alone is close to the company's entire market capitalisation (~₹190 Cr).
The flip side: that treasury book is also the reason a bad year in equity/debt markets (as in Q4) flows straight into the reported profit line. Balance-sheet strength is real; earnings quality is the weak link.
Dividend Sustainability Analysis
| Coverage Test | Result | Verdict |
|---|---|---|
| Earnings coverage (EPS/DPS) | 3.12x | Pass |
| OCF coverage | ~7x | Pass |
| FCF coverage | Negative FCF | Fail |
| Cash / liquidity coverage | ~106x | Strong |
Verdict: Moderately Sustainable
The ₹1.50 payout passes three of four tests. It is comfortably covered by earnings (3.12x), by operating cash flow, and overwhelmingly by the cash pile (~106x). It fails only the free-cash-flow test, because capex exceeded operating cash this year.
The honest read: the dividend is affordable thanks to the balance sheet, but the company has already signalled caution by cutting it 70%. Sustainability of the amount from here depends on the core paper business recovering its margins — not on the cash cushion, which could fund a token payout for years regardless.
Peer Comparison
| Company | FY26 DPS | Approx. Yield | FY26 PAT trend | Note |
|---|---|---|---|---|
| Shreyans Industries | ₹1.50 | ~1.1% | -87% | Dividend cut; net cash |
| JK Paper | ₹4.00 | ~1.3% | -35% | Largest branded paper co. |
| Seshasayee Paper | ₹2.00 (FV ₹2) | ~0.9% | -24% | Zero-debt; ROCE 20%+ |
| West Coast Paper | Not Independently Verified | ~1.7% | Not Disclosed | Payout ~8%; weak FCF |
| Andhra Paper | Not Independently Verified | Not Independently Verified | Not Disclosed | Writing/printing peer |
Two things stand out. First, FY26 was a hard year across the sector — every major listed paper maker saw profits fall on input-cost pressure, so Shreyans is not an outlier in direction, only in degree (its −87% is the steepest here). Second, sector dividend yields cluster around 1-2%, so Shreyans' ~1.1% is broadly in line, not exceptional. Peer cells marked "Not Independently Verified" are left blank rather than filled with unconfirmed figures.
Promoter Impact Analysis
Promoter Holding
50.53%
Public / Retail
~49.06%
FII / FPI
0.24%
Mutual Funds / DII
~0.18%
Shareholding as per latest available pattern (Jun-2026 quarter, aggregator-sourced).
With the Oswal promoter family holding 50.53%, roughly ₹1.05 Cr of the ₹2.07 Cr payout flows to promoters and about ₹1.03 Cr to public shareholders. Institutional ownership is negligible (FII 0.24%, MFs ~0.01%), so this is a promoter-and-retail stock with thin trading volumes.
Because the amounts are small either way, the dividend is not a meaningful cash-extraction lever for promoters here — the decision to cut it looks like genuine conservatism in a weak year rather than a shift in distribution policy.
Taxation Analysis
Since FY 2020-21, dividends are taxed in the hands of the shareholder at their applicable income-tax slab rate. The company deducts TDS at 10% under Section 194 only if your total dividend from that company in the financial year exceeds ₹10,000 (threshold raised from ₹5,000). For most retail holders below that limit, no TDS applies, but the dividend is still fully taxable when you file your return.
Worked example — 1,000 shares, 30% slab
Gross dividend (1,000 × ₹1.50)₹1,500
TDS u/s 194 (below ₹10,000)₹0
Tax @ 30% + 4% cess₹468
Net in hand₹1,032
For a 30%-slab investor, the ~1.09% pre-tax yield becomes roughly 0.75% post-tax. This is an illustration, not tax advice — consult a qualified professional.
Key Risks
- Energy-cost exposure: Power & fuel is now ~21.5% of revenue and rose 22.6% in FY26. Coal/biomass and electricity price swings can wipe out operating margins, as they did this year.
- Earnings quality / treasury dependence: FY26 profit came entirely from other income; a ₹9.31 Cr fair-value investment loss alone tipped Q4 into a net loss. Reported earnings are hostage to market movements in the ₹211 Cr investment book.
- Commodity, cyclical business: Writing & printing paper is a mature, price-sensitive commodity with limited pricing power and structural demand pressure from digitisation.
- Negative free cash flow amid heavy capex: ₹52.68 Cr capex against ₹14.46 Cr operating cash flow drove FCF to −₹38.22 Cr; sustained capex without margin recovery would erode the cash buffer.
- Low liquidity / concentrated ownership: Negligible institutional holding and thin volumes can amplify price moves; the stock is already down heavily from its 52-week high.
- Contingent-liability / litigation judgement was flagged by the auditor as a key audit matter, requiring significant management estimation.
What To Monitor
- Power & fuel cost per tonne and its share of revenue — the single biggest swing factor for margins in the coming quarters.
- Core operating margin (ex-other-income) — watch whether the paper business returns to a genuine operating profit rather than leaning on treasury gains.
- Paper realisations vs raw-material (agro-residue/pulp) costs — the spread that ultimately drives profitability.
- Capex completion and its returns — whether the ₹52.68 Cr investment starts lifting capacity, efficiency and cash flow.
- Free cash flow turning positive — the test of whether future dividends can be funded from operations, not reserves.
- Next year's dividend decision — whether the payout recovers toward ₹5.00 or the ₹1.50 level becomes the new normal.
Conclusion
Shreyans Industries' ₹1.50 final dividend is best understood as a disciplined cut, not a reward. The payout is down 70% from ₹5.00 because FY26 profit fell ~87% — and, on closer inspection, the paper business itself ran a small operating loss, with the entire reported profit coming from investment and interest income.
The reassurance is a fortress balance sheet: ~₹222 Cr of cash and investments, ~₹163 Cr net cash, and a dividend so small it is covered by liquidity more than a hundred times over. So the payout is safe — but its size now hangs on whether energy costs ease and paper margins recover. On market price the yield is only ~1.1%, well below the 15% face-value headline. As always, the positives, negatives and risks are laid out here for you to weigh; ShareBazaar Online does not issue buy, sell or hold advice.
Frequently Asked Questions
What dividend has Shreyans Industries announced for FY26?
What is the dividend yield of Shreyans Industries?
What is the record date for the Shreyans Industries dividend?
What is the ex-date?
When will the dividend be paid?
Who is eligible for the dividend?
How is this dividend taxed?
Is the Shreyans Industries dividend sustainable?
Why did Shreyans cut its dividend from ₹5.00 to ₹1.50?
What is Shreyans Industries' dividend history?
Is the reported profit "real" this year?
What should investors monitor from here?
How does Shreyans compare with peers like JK Paper and Seshasayee?
Disclaimer
This article is published by ShareBazaar Online for informational and educational purposes only and is not investment advice. It does not constitute a buy, sell or hold recommendation. ShareBazaar Online is not a SEBI-registered investment adviser. Figures are drawn from the company's audited FY26 results, exchange filings and publicly available aggregator data; market price, yield, and ex/record dates are time-sensitive and must be independently re-verified before any decision. Dividends are subject to shareholder approval at the AGM. Tax treatment depends on individual circumstances — consult a qualified professional. Investments in securities are subject to market risks; please read all related documents carefully. Neither ShareBazaar Online nor its authors accept liability for any loss arising from the use of this information.