
Oriental Aromatics Dividend 2026 – Snapshot
Oriental Aromatics Limited (NSE: OAL, BSE: 500078) has recommended a Final Dividend of ₹0.50 per equity share (i.e. 10% on a face value of ₹5) for the financial year 2025–26. The recommendation was made at the Board meeting held on 20 May 2026 and is subject to shareholder approval at the 54th Annual General Meeting on 18 August 2026. This Oriental Aromatics dividend analysis looks beyond the headline percentage to examine the yield, payout ratio, cash flow coverage and sustainability of the FY26 payout for retail investors.
Dividend Details
Dividend Type: Final Dividend
Dividend Per Share: ₹0.50
Dividend Rate: 10% (on ₹5 face value)
Financial Year: FY 2025–26
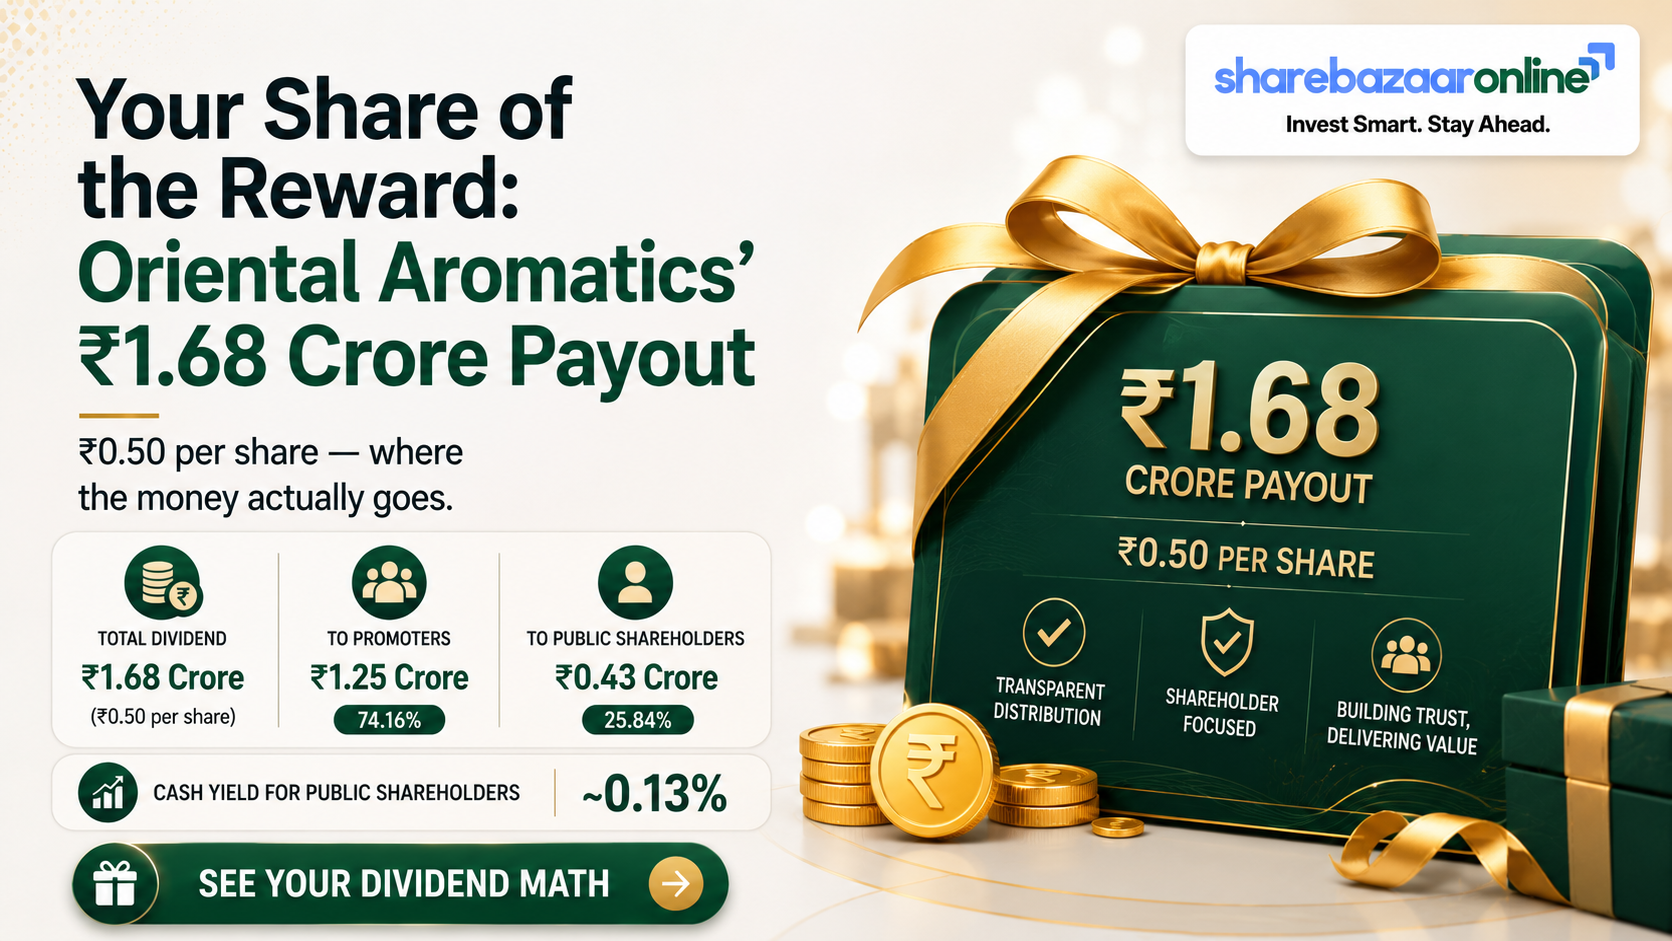
Total Dividend Outflow: ₹1.68 crore (₹168.27 lakh)
Yield & Key Ratios
Dividend Yield: ~0.13% (at ₹378.50, latest available price)
Payout Ratio (Consolidated): 50.8%
Payout Ratio (Standalone): 6.7%
Dividend Coverage (Consolidated EPS): 1.96x
Cash Coverage: 7.80x
The one number that matters: a “10% dividend” headline sounds generous, but on the market price it is a dividend yield of only about 0.13%. More importantly, the same flat ₹0.50 payout now consumes roughly half of consolidated profit, because consolidated net profit collapsed ~90% in FY26. The full analysis below explains why.
Dividend Announcement Summary
At its meeting on 20 May 2026, the Board of Directors of Oriental Aromatics Limited, pursuant to Regulation 43 of SEBI (LODR) Regulations, recommended a final dividend of ₹0.50 per equity share of face value ₹5 (a 10% dividend) on the paid-up share capital for FY 2025–26. The Board simultaneously approved the audited standalone and consolidated financial results for the quarter and year ended 31 March 2026 with an unmodified (clean) audit opinion from statutory auditors M/s Lodha & Co. LLP.
Approval & Eligibility
The dividend is subject to shareholder approval at the 54th AGM on 18 August 2026. If approved, it will be paid within 30 days of the AGM to shareholders whose names appear on the register as at the record date, 5 August 2026.
Other Board Actions
The same meeting saw the appointment of Mr. John Gloster as an Additional (Non-Executive, Independent) Director, the resignation of Independent Director Mr. Deepak Ramachandra (citing professional commitments, with no other material reason), and re-appointment of internal and cost auditors.
Key Dates Timeline
Announcement Date
20 May 2026 – Board meeting recommending the dividend and approving FY26 results.
Record Date
Wednesday, 5 August 2026 – the date the company uses to determine which shareholders are entitled to the dividend.
Ex-Dividend Date
5 August 2026 (inferred under T+1 settlement, same as the record date). This should be confirmed against the official NSE/BSE corporate-action circular.
AGM Date
Tuesday, 18 August 2026 – the 54th AGM, where shareholders vote to approve the final dividend.
Payment Date
Exact payment date not disclosed by the company. As a final dividend, it must be paid within 30 days of the AGM – i.e. by approximately 17 September 2026 (statutory outer limit).
Eligibility Rule
Investors needed to hold shares on the record date (5 August 2026). Since this date has passed, the eligibility window is closed for the FY26 dividend.
Dividend Yield Analysis
Dividend yield is the annual dividend expressed as a percentage of the share price. Because the payout is fixed at ₹0.50 but the OAL share price has been volatile (a 52-week range of roughly ₹228–₹422), the yield changes with the market price. At the latest available reference price of ₹378.50 (8 August 2026), the Oriental Aromatics dividend yield works out to about 0.13%.
Yield at Different Prices
At ₹253: 0.20%
At ₹310: 0.16%
At ₹350: 0.14%
At ₹378.50: 0.13%
At ₹400: 0.13%
The Face-Value Illusion
The company describes the payout as a “10% dividend”. That 10% is calculated on the ₹5 face value, not the market price. On the actual traded price the real cash yield is roughly 0.13%–0.20% – a useful reminder that a percentage headline is not the same as a yield.
Yield reality check: the modest yield here is driven by a small absolute dividend on a share that still trades at a high multiple (a price-to-earnings ratio of several hundred times on collapsed FY26 consolidated earnings), rather than by a distressed share price. The yield is low because the dividend is small, not because the stock has crashed. All yield figures are price-dependent and must be re-verified against the live market price before use.
Dividend History Analysis
Oriental Aromatics has paid a dividend every year for many years, which makes it a consistent payer in terms of frequency. But the size of that dividend tells a different story: it has shrunk sharply from ₹2.50 a few years ago to a flat ₹0.50 for the last four financial years.
Dividend Per Share History
| Financial Year | Dividend/Share | Rate (on ₹5 FV) |
|---|---|---|
| FY 2025–26 | ₹0.50 | 10% |
| FY 2024–25 | ₹0.50 | 10% |
| FY 2023–24 | ₹0.50 | 10% |
| FY 2022–23 | ₹0.50 | 10% |
| FY 2021–22 | ₹1.50 | 30% |
| FY 2019–20 | ₹2.50 | 50% |
Dividend history sourced from exchange records and aggregators; per-share amounts should be cross-checked for any split/bonus adjustments.
Classification: Consistent but Declining Payer
The company scores well on consistency of payment but poorly on growth. The dividend has been cut over the years and then held flat at a token ₹0.50, tracking a multi-year decline in earnings per share. There have been no special dividends in the recent flat-payout period.
Financial Performance Analysis
The FY26 results reveal a classic case of negative operating leverage: revenue rose, but every profit line below it fell – and the fall got steeper the further down the income statement you look. All figures below are on a consolidated basis unless stated.
| Metric (Consolidated) | FY 2025–26 | FY 2024–25 | Change |
|---|---|---|---|
| Revenue from Operations | ₹1,030.78 cr | ₹928.26 cr | +11.05% |
| Operating EBITDA | ₹68.00 cr | ₹93.39 cr | –27.19% |
| EBITDA Margin | 6.60% | 10.06% | –346 bps |
| Finance Costs | ₹35.75 cr | ₹25.18 cr | +42.00% |
| Net Profit (PAT) | ₹3.31 cr | ₹34.33 cr | –90.36% |
| EPS (Basic & Diluted) | ₹0.98 | ₹10.20 | –90.39% |
Why Profit Fell While Sales Rose
Revenue grew 11%, yet EBITDA fell 27% as the operating margin compressed from 10.06% to 6.60% – a sign of raw-material and cost pressure in the aroma-chemicals business. On top of that, finance costs jumped 42%, which turned a shrinking operating profit into an almost-vanishing bottom line.
Standalone vs Consolidated
On a standalone basis, PAT was ₹25.26 cr (EPS ₹7.51), down about 46% from ₹46.84 cr. The gap between standalone and consolidated profit points to losses at the subsidiary/group level that drag the consolidated number down to just ₹3.31 cr.
Cash Flow Analysis
Reported profit is an accounting opinion; cash is a fact. On the cash-flow statement, FY26 was weak. Consolidated operating cash flow (OCF) was just ₹2.42 cr – a recovery from a negative ₹34.49 cr in FY25, but still thin relative to the size of the business.
Free Cash Flow Is Negative
After capital expenditure of ₹11.78 cr, free cash flow was negative at about –₹9.36 cr. In plain terms, the business did not generate surplus cash in FY26; it spent more on operations and assets than it brought in.
How the Dividend Is Funded
Because FCF is negative, the ₹1.68 cr dividend is not funded by current-year free cash flow. It is effectively covered by cash reserves and borrowings – the company's gross debt rose during the year even as the dividend was paid.
Working Capital Signal
Trade and other receivables rose by roughly ₹55.78 cr during the year (faster than the 11% revenue growth), a build-up that ties up cash and is worth monitoring as a forward risk to cash conversion.
Balance Sheet Strength
Debt Position
Gross debt (consolidated): ₹402.06 cr (up 14.2% from ₹352.03 cr)
Net debt: ₹388.94 cr
Total equity: ₹664.53 cr
Gross Debt/Equity: 0.61x · Net D/E: 0.59x
Liquidity & Book Value
Cash & equivalents: ₹13.13 cr
Book value per share: ₹197.46
Price-to-Book (at ₹378.50): 1.92x
Cash comfortably covers the small dividend (7.8x), but is modest against the total debt load.
The Key Weakness: Interest Coverage
The single biggest balance-sheet concern is interest coverage. Operating profit (EBIT) barely exceeds the interest bill: coverage fell from 2.77x in FY25 to just 1.03x in FY26. This is why credit-rating agency ICRA reaffirmed its rating but revised the outlook to Negative in February 2026. A leveraged balance sheet with wafer-thin interest cover is a material context for any dividend decision.
Dividend Sustainability Analysis
We test the FY26 dividend against four coverage tests. The dividend is small in absolute terms (₹1.68 cr), so it is easy to pay from cash – but the quality of the earnings and cash flows behind it is weak.
| Coverage Test | Value | Verdict |
|---|---|---|
| Earnings coverage (consolidated EPS/DPS) | 1.96x | Amber – thin |
| Earnings coverage (standalone EPS/DPS) | 15.02x | Comfortable |
| OCF coverage | 1.44x | Amber – weak |
| FCF coverage | –5.56x | Fail – negative FCF |
| Cash/liquidity coverage | 7.80x | Pass |
Verdict: Affordable Today, but Low Quality
Classification: Moderately Sustainable. The token ₹0.50 dividend is small enough that the company can keep paying it from cash even in a poor year – which is likely why it was held flat. But it is not backed by free cash flow, and on consolidated earnings it now eats up half of profit. Sustaining or growing the dividend depends on an earnings and margin recovery, not on the current year's cash generation.
Peer Comparison
Against its aroma-chemicals and fragrance peers, Oriental Aromatics stands out for its low return ratios and very low yield. Peer figures are indicative and drawn from public sources; cells that could not be independently verified are marked accordingly.
| Company | Dividend Yield | Payout | ROE | ROCE |
|---|---|---|---|---|
| Oriental Aromatics | ~0.13% | 50.8% (cons.) | 5.31% | 7.89% |
| Privi Speciality Chemicals | ~0.27% | ~7.3% | 26.0% | 22.3% |
| S H Kelkar & Company | ~0.6% | ~19% | Not Independently Verified | Not Independently Verified |
Peer return ratios and yields are on a trailing basis from public financial portals and are price-sensitive; re-verify before publication.
The takeaway: the aroma-chemicals sector is generally a low-yield space, so OAL's small yield is not unusual. What sets it apart is the gap in profitability – a larger aroma peer like Privi earns an ROE of ~26% against OAL's ~5%, underlining that OAL is currently the weaker operator on returns.
Promoter Impact Analysis
Who Receives the Dividend
Promoter holding: ~74.16%
Public holding: ~25.82%
FII: ~0.1% · DII: ~0%
Of the total ₹1.68 cr payout, the promoter group receives about ₹1.25 cr and public shareholders about ₹0.43 cr.
Distribution Impact
With roughly three-quarters of equity held by promoters, the bulk of any dividend flows to the promoter family. For minority shareholders, the cash benefit is very small in yield terms – the more meaningful return driver here is the underlying business performance and share price, not the dividend.
Taxation Analysis
Since the abolition of the Dividend Distribution Tax (from FY 2020–21), dividends are taxable in the hands of the shareholder at their applicable income-tax slab rate. Companies deduct TDS at 10% under Section 194 only when the total dividend paid to a resident shareholder exceeds ₹5,000 in a financial year (20% if PAN is not furnished).
Worked Example (Retail Investor)
Assume an investor owns 1,000 shares and is in the 30% tax slab:
Gross dividend = 1,000 × ₹0.50 = ₹500
Tax @ 30% = ₹150, plus 4% cess (₹6) = ₹156
Net dividend in hand = ₹344
TDS deducted by company = Nil (dividend is below the ₹5,000 threshold)
Post-tax effective yield (at ₹378.50) = ~0.09%
This is a simplified illustration for education only and ignores surcharge (applicable at higher income levels) and individual specifics. Tax treatment depends on your total income and residential status; consult a qualified tax adviser.
Key Risks
- Collapsing profitability: consolidated PAT fell ~90% in FY26 to ₹3.31 cr and EBITDA margin compressed to 6.60%, showing acute cost/margin pressure in the aroma-chemicals business.
- Thin interest coverage: EBIT covers interest only 1.03x; gross debt rose 14% to ₹402 cr. ICRA revised the outlook to Negative in February 2026.
- Negative free cash flow: FCF of about –₹9.36 cr means the business consumed cash in FY26 and the dividend is funded from reserves/borrowings, not surplus cash.
- Tax/governance overhang: the company has reported an income-tax show-cause notice relating to FY 2020–21 with a large alleged undisclosed-income figure under verification – a contingent risk that should be tracked.
- Subsidiary drag: consolidated profit is far below standalone profit, and the foreign subsidiary (PT Oriental Aromatics, Indonesia) is in the process of liquidation.
- Input-cost and forex exposure: as an exporter of aroma chemicals, OAL is exposed to raw-material inflation, currency swings and global demand cycles.
What To Monitor
- EBITDA margin recovery: whether the operating margin can climb back toward the ~10% level of FY25 from the current 6.60%.
- Interest cost and coverage: the trajectory of finance costs and whether interest coverage improves above the current 1.03x.
- Free cash flow turnaround: a return to positive FCF, driven by better operating cash flow and disciplined capex.
- Working capital / receivables: whether the receivables build-up unwinds and the cash conversion cycle improves.
- Credit rating actions: any change to the ICRA rating or its Negative outlook.
- Resolution of the tax notice and progress on liquidating the loss-making Indonesian subsidiary.
Conclusion
Oriental Aromatics' FY26 final dividend of ₹0.50 per share (10%) is best understood as a token, held-flat payout rather than a meaningful income stream. The real dividend yield is only about 0.13%, the payout now absorbs roughly half of collapsed consolidated profit, and it is not backed by free cash flow in a year when the company burned cash and added debt.
Positives
Long, unbroken record of paying a dividend; the small payout is easily covered by cash (7.8x); revenue grew 11%; standalone profitability remains positive; audit opinion is clean/unmodified.
Negatives
~90% fall in consolidated PAT; margin compression; interest coverage down to 1.03x; rising debt; negative free cash flow; Negative credit outlook; a pending tax notice; very low yield and low return ratios versus peers.
We present the positives, negatives, risks and monitoring factors so that readers can weigh them for themselves. This article does not make any buy, sell or hold recommendation.
Frequently Asked Questions
What dividend has Oriental Aromatics announced for FY 2025–26?
What is the Oriental Aromatics dividend yield?
What is the record date for the Oriental Aromatics dividend?
What is the ex-dividend date?
When will the dividend be paid?
Who is eligible to receive the dividend?
How is the Oriental Aromatics dividend taxed?
Is the Oriental Aromatics dividend sustainable?
What is the Oriental Aromatics dividend history?
Why did net profit fall so sharply in FY26?
What is the difference between the standalone and consolidated payout ratio?
What should investors monitor after this dividend?
Disclaimer
This article is for informational and educational purposes only and does not constitute investment, financial, legal or tax advice, nor any buy, sell or hold recommendation. ShareBazaar Online is not a SEBI-registered investment adviser. Dividend figures, dates and financials are based on the company's exchange filing dated 20 May 2026 and publicly available sources; all price-dependent figures (including yield) are indicative and must be re-verified against the live market price and official NSE/BSE corporate-action circulars before any decision. Securities markets are subject to risks; please consult a qualified, registered financial adviser and read all offer/company documents carefully before investing. The author and publisher accept no liability for any loss arising from the use of this information.