
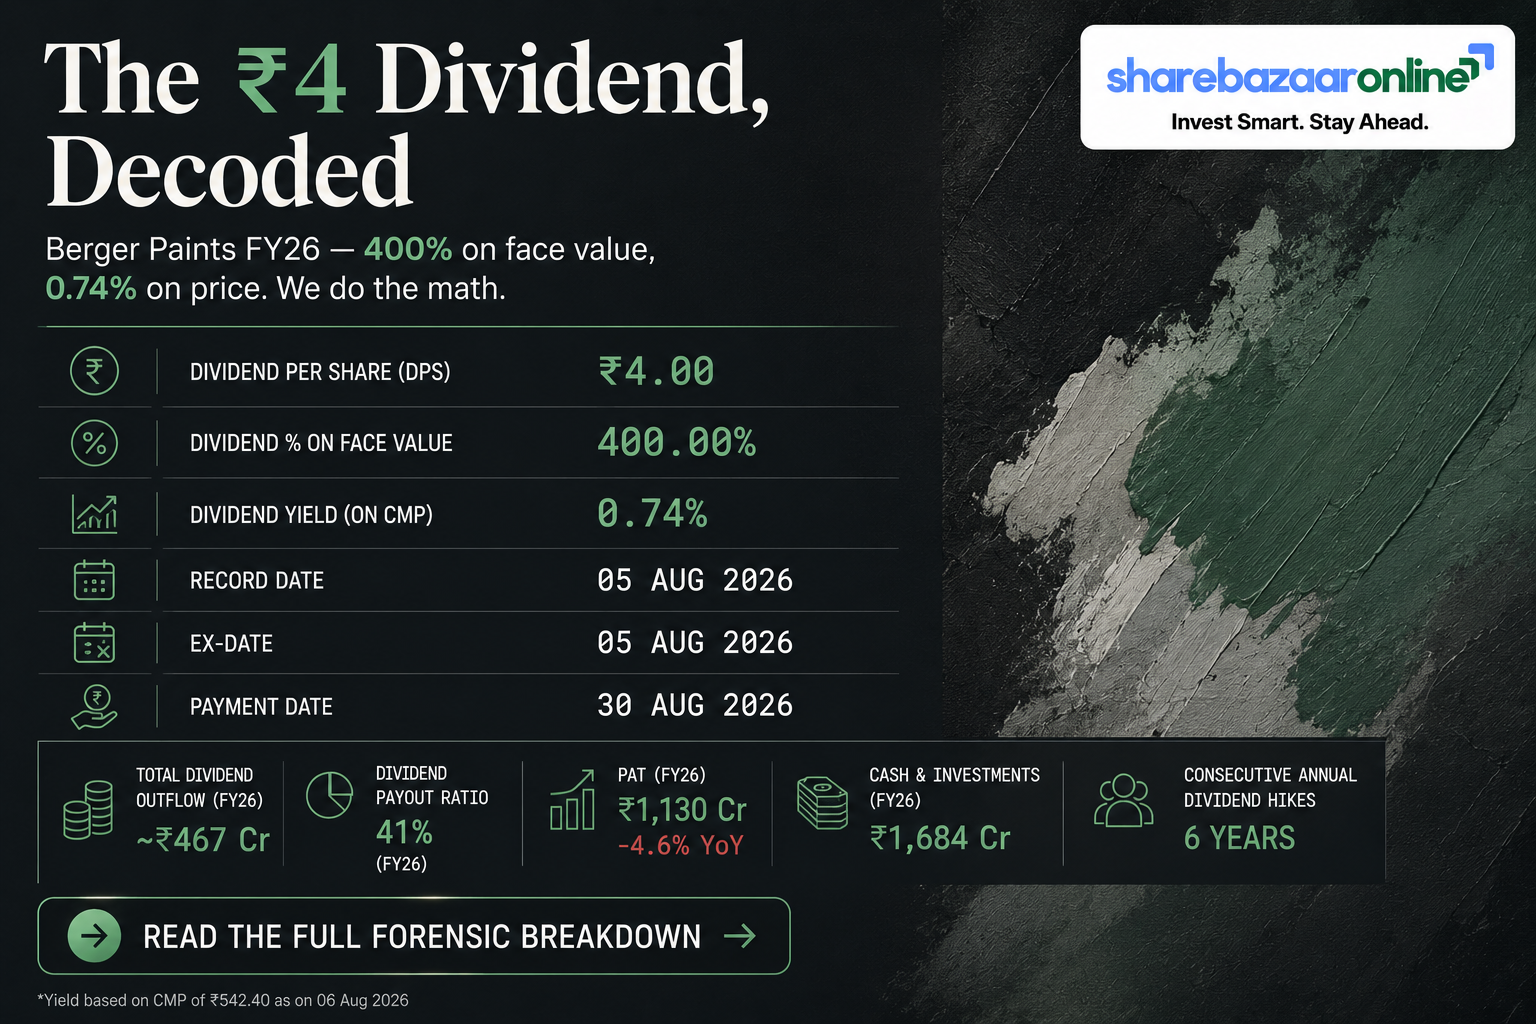
Dividend Snapshot
Company
Berger Paints India Limited
NSE: BERGEPAINT | BSE: 509480 | ISIN: INE463A01038
Consolidated basis | Sector: Decorative & Industrial Paints
Dividend Declared
₹4.00 per share (400%)
Type: Final Dividend | Face Value: ₹1.00
For Financial Year: FY2025-26
Dividend Yield (CMP ₹542)
0.74%
Yield on Announcement (₹488.50)
0.82%
Payout Ratio (FY26)
41.4%
Total Dividend Outflow
~₹467 Cr
Record Date
05-08-2026
Ex-Date
05-08-2026
AGM (Approval)
12-08-2026
Payment Date
21-08-2026
Market data as of 10 August 2026 close (Screener consolidated). Dividend payment is subject to shareholder approval at the 102nd AGM on 12 August 2026.
Dividend Announcement Summary
The Board of Directors of Berger Paints India Limited, at its meeting held on 12 May 2026, recommended a final dividend of ₹4.00 per equity share (400%) of face value ₹1.00 each, fully paid-up, for the financial year ended 31 March 2026.
This is the company's only dividend for FY26 — Berger follows an annual single-dividend cycle, so the full-year payout and this event are the same ₹4.00.
The recommendation is subject to approval by members at the 102nd Annual General Meeting scheduled for 12 August 2026 (via video conferencing). Until the AGM passes the resolution, the dividend remains a recommendation, not a declared entitlement.
Why this matters
The ₹4.00 marks the sixth consecutive annual increase in Berger's dividend per share, rising from ₹3.80 in FY25. The raise is notable because it comes in a year when reported profit actually slipped — a divergence we examine in the sections below.
Key Dates Timeline
| Event | Date | Status |
|---|---|---|
| Board Meeting (Dividend recommended) | 12 May 2026 | Confirmed |
| Record Date | 05 August 2026 | Confirmed (Reg. 42 circular) |
| Ex-Date | 05 August 2026 | Confirmed (T+1 settlement) |
| Book Closure | 06–12 August 2026 | Both days inclusive |
| 102nd AGM (Member approval) | 12 August 2026 | Approval pending |
| Payment Date | 21 August 2026 | If declared at AGM |
Eligibility is locked to shareholders on record as of 5 August 2026. Because the record date has passed, buying the share now does not carry entitlement to this dividend.
Dividend Yield Analysis
The Face-Value Illusion
The headline "400% dividend" sounds enormous, but 400% is measured on the ₹1 face value, not on the market price. In cash terms it is simply ₹4.00 per share. Against the current market price of about ₹542, the real yield is only 0.74% — far below a bank fixed deposit.
Yield at Different Prices
On the announcement-day close of ₹488.50 (12 May 2026), the yield worked out to 0.82%. As the stock has since risen to ₹542, the yield has compressed to 0.74%. Yield moves inversely to price — a higher share price means a lower yield for the same ₹4 payout.
Reality Check
Berger is not a high-yield stock. Its sub-1% yield reflects a premium-valued growth compounder (P/E around 51x), where investors are paid mainly through capital appreciation rather than dividends. For an investor in the 30% tax slab, the post-tax yield falls to roughly 0.51%. The dividend is best read as a signal of financial health and capital discipline, not as an income stream.
Dividend History Analysis
| Financial Year | Dividend / Share | On Face Value ₹1 | YoY Change |
|---|---|---|---|
| FY2021 | ₹2.33 | 233% | — |
| FY2022 | ₹2.58 | 258% | +10.7% |
| FY2023 | ₹2.67 | 267% | +3.5% |
| FY2024 | ₹3.50 | 350% | +31.1% |
| FY2025 | ₹3.80 | 380% | +8.6% |
| FY2026 | ₹4.00 | 400% | +5.3% |
Berger has raised its dividend every single year over this period, compounding at about 11.4% per annum across five years. There are no cuts, no suspensions and no missed years in the recent record.
Note: Figures from FY2021 onwards are on the current ₹1 face value and are directly comparable. Pre-2018 payouts were on a different face value and are not compared here to avoid distortion.
Classification: Consistent Payer
Berger qualifies as a Consistent (Growing) Dividend Payer. The steady annual increases, backed by an established consumer franchise, place it in the most reliable payer category despite the modest absolute yield.
Financial Performance Analysis
| Metric (Consolidated) | FY2025 | FY2026 | Growth |
|---|---|---|---|
| Revenue | ₹11,545 Cr | ₹11,880 Cr | +2.9% |
| Operating Profit (EBITDA) | ₹1,856 Cr | ₹1,833 Cr | -1.2% |
| Operating Margin (OPM) | 16.1% | 15.4% | -70 bps |
| Net Profit (PAT) | ₹1,183 Cr | ₹1,128 Cr | -4.6% |
| EPS | ₹10.12 | ₹9.66 | -4.5% |
Negative Operating Leverage
Revenue grew +2.9% but profit fell 4.6% — a classic sign of margin pressure. Operating margin slipped from 16.1% to 15.4%, driven by raw-material inflation and heavier brand-building and distribution spend as the company defends share against new competition.
The FY27 Turn
Momentum reversed sharply in the new year. In Q1 FY27 (Jun 2026), consolidated revenue rose about 12% to ₹3,584 Cr and net profit jumped roughly 29% to ₹405 Cr, aided by a record gross margin. This rebound eases concern about the flat FY26.
Zooming out, Berger has still compounded revenue at roughly 12% and profit at about 10% over five years, with return on equity around 17% and return on capital employed around 22% — solid, asset-light economics typical of a leading paint franchise.
Cash Flow Analysis
Cash Backs the Dividend — Even as Profit Dipped
Reported profit fell in FY26, but cash generation did not. Operating cash flow rose to ₹1,540 Cr, converting an impressive 102% of operating profit into cash. Free cash flow (after capex) was a healthy ₹1,037 Cr.
Operating Cash Flow
₹1,540 Cr
Free Cash Flow
₹1,037 Cr
Dividend Outflow
~₹467 Cr
FCF after Dividend
~₹570 Cr surplus
How the Dividend Is Funded
The ₹467 Cr payout is funded entirely from current-year operating cash — not from reserves, asset sales or fresh borrowing. Free cash flow alone covers the dividend more than twice over, leaving a comfortable surplus for reinvestment.
Balance Sheet Strength
Effectively Net Cash
Berger carries about ₹635 Cr of borrowings against roughly ₹1,189 Cr of investments, leaving it in a net-cash position of around ₹554 Cr. Screener flags the company as "almost debt-free."
Net Worth
~₹6,917 Cr
Borrowings
~₹635 Cr
Investments
~₹1,189 Cr
Net Cash
~₹554 Cr
A near-debt-free balance sheet means the dividend is not competing with interest obligations. Debt is not rising to fund distributions — borrowings have actually trended down over recent years. This is the cleanest possible backdrop for dividend affordability.
Dividend Sustainability Analysis
| Coverage Test | Ratio | Verdict |
|---|---|---|
| Earnings coverage (EPS ÷ DPS) | 2.42x | Pass |
| Operating cash flow coverage | 3.30x | Pass |
| Free cash flow coverage | 2.22x | Pass |
| Cash / investments coverage | 2.55x | Pass |
Verdict: Sustainable
Every coverage test passes comfortably. The dividend is backed by earnings, cash flow and a net-cash balance sheet. There is ample headroom to maintain and grow the payout.
One Nuance to Watch
The payout ratio has crept up to about 41% — the highest in a decade — because the dividend rose while FY26 profit fell. That is comfortable today, but if earnings were to stay flat while dividends keep rising, the payout would need monitoring.
Peer Comparison
| Company | FY26 Dividend | Yield | Payout | Positioning |
|---|---|---|---|---|
| Berger Paints | ₹4.00 | 0.74% | ~41% | No. 2, growth compounder |
| Asian Paints | ₹27.50 | ~1.0% | ~61% | Market leader, higher payout |
| Kansai Nerolac | NIV | ~0.9% | NIV | Industrial / auto coatings tilt |
| Akzo Nobel India | NIV | ~2.7% | ~101% | High-yield income play |
| Indigo Paints | NIV | NIV | NIV | Fast-growing small-cap, high ROE |
NIV = Not Independently Verified from a primary source at time of writing; cells left unfilled rather than estimated. Peer figures are indicative and price-dependent.
Within the pack, Berger sits at the low-yield, growth end. Akzo Nobel is the income outlier (yield near 2.7% but paying out essentially all its earnings), while Asian Paints distributes a larger share of profit. Berger's more moderate ~41% payout leaves it the most reinvestment headroom among the large peers — consistent with a company still spending on capacity and share defence.
Promoter Impact Analysis
Where the ₹467 Cr Goes
Promoters hold 74.98% of Berger. Of the roughly ₹467 Cr total payout, about ₹350 Cr flows to the promoter group, with the remaining ~₹117 Cr shared among public, FII and DII shareholders.
Promoter Holding
74.98%
Promoter Income
~₹350 Cr
FII Holding (Jun-26)
4.82%
DII Holding (Jun-26)
11.78%
Ownership Shift Worth Noting
The dividend is proportionate — every shareholder receives the same ₹4 per share — but promoters naturally capture the bulk given their high stake. Separately, foreign investors have steadily trimmed exposure (FII holding fell from ~10.7% in early 2024 to ~4.8% by June 2026), while domestic institutions have moved the other way (DII holding roughly doubled to ~11.8%). This rotation is a structural backdrop investors should be aware of.
Taxation Analysis
How Dividends Are Taxed in India
Since April 2020, dividends are taxable in the hands of the shareholder at their applicable income-tax slab rate. The company also deducts TDS at 10% under Section 194 if total dividend paid to a resident shareholder exceeds ₹5,000 in a financial year (TDS is 20% without a valid PAN). The TDS is adjustable against final tax liability.
Worked Examples (30% Slab Investor)
| Holding | Gross Dividend | TDS @10% | Final Tax @31.2% | Net in Hand |
|---|---|---|---|---|
| 1,000 shares | ₹4,000 | Nil (below ₹5,000) | ₹1,248 | ₹2,752 |
| 1,500 shares | ₹6,000 | ₹600 | ₹1,872 | ₹4,128 |
For a 1,000-share holder, the gross ₹4,000 stays below the ₹5,000 TDS threshold, so no tax is deducted at source — but the amount is still taxable at slab when filing returns. At a 30% slab (plus 4% cess), the effective tax is 31.2%, leaving ₹2,752 net and a post-tax yield of about 0.51% on the current price.
Illustrative only. Cess, surcharge and individual circumstances vary. This is not tax advice — consult a qualified tax professional.
Key Risks
- New-entrant competition: Grasim's Birla Opus has entered decorative paints with a reported ~₹10,000 Cr capex plan. Aggressive pricing and dealer incentives from a deep-pocketed rival could pressure Berger's volumes, margins and market share.
- Margin / raw-material inflation: FY26 already saw operating margin slip to 15.4%. Crude-linked inputs (many paint raw materials are derivatives of crude oil) can squeeze margins quickly if oil prices rise.
- Rich valuation: At a P/E around 51x and roughly 9x book value, the stock prices in strong growth. Any earnings disappointment can trigger sharp de-rating, unrelated to the small dividend.
- Foreign-investor outflow: FII holding has more than halved since early 2024 (to ~4.8%). Continued selling can weigh on the share price and, mechanically, keep the yield optically low.
- Demand cyclicality & weather: Decorative paint demand tracks housing, monsoon timing and consumer sentiment. An extended monsoon or a demand slowdown (as seen in parts of FY26) can dent value growth.
- AGM approval pending: Until members approve the resolution at the 12 August 2026 AGM, the ₹4 dividend remains a recommendation, not a legal entitlement.
What To Monitor
- Volume growth trajectory: Watch whether the Q1 FY27 rebound (double-digit value growth, ~29% profit jump) sustains through the year, or was a favourable base effect.
- Gross & operating margins: Track whether the record Q3 FY26 / Q1 FY27 gross margin holds as raw-material costs and competitive discounting evolve.
- Birla Opus market share: Monitor how much share the new entrant captures and whether Berger has to raise spending to defend its position.
- Capex execution: Berger has guided to roughly ₹600–800 Cr of capacity capex. Watch that this is funded from internal accruals without stressing free cash flow or the dividend.
- Payout ratio direction: With payout at a decade-high ~41%, watch whether earnings growth resumes to keep the ratio comfortable as dividends rise.
- Institutional flows: Track whether the FII exit stabilises and whether DII buying continues to offset it.
Conclusion
Positives
- Sixth straight annual dividend increase; ~11.4% five-year DPS growth.
- Dividend covered 2.2x by free cash flow and backed by a net-cash balance sheet.
- Strong Q1 FY27 rebound in revenue and profit.
- Consistent, high-quality No. 2 paint franchise with ~17% ROE.
Negatives / Watch-outs
- Yield of just 0.74% — this is not an income stock.
- FY26 profit fell 4.6% and margins compressed.
- Payout at a decade-high ~41% as dividend rose on lower profit.
- Intense new competition (Birla Opus) and a rich P/E near 51x.
In short, Berger's ₹4 dividend is safe and well-funded, but small. It is best understood as a marker of financial discipline in a premium growth compounder, rather than a source of meaningful income. The real investment debate sits with growth, margins and competition — not the yield. Readers should weigh the positives and risks against their own goals.
Frequently Asked Questions
What dividend has Berger Paints announced for FY26?
What is the dividend yield?
What is the record date for the Berger Paints dividend?
What is the ex-date?
When will the dividend be paid?
Who is eligible for the dividend?
How is this dividend taxed?
Is the dividend sustainable?
What is Berger Paints' dividend history?
Why was the dividend raised when FY26 profit fell?
How does Berger's dividend compare with Asian Paints and Akzo Nobel?
What should investors monitor going forward?
Disclaimer
This article is for informational and educational purposes only and does not constitute investment, financial or tax advice, nor a recommendation to buy, sell or hold any security. ShareBazaar Online is not a SEBI-registered investment adviser. All figures are compiled from company filings and publicly available sources (including Screener.in, exchange filings and aggregators) and may contain errors or become outdated; market prices and yields are price-dependent and change continuously. Dividend figures are subject to shareholder approval at the AGM. Readers must verify all data independently and consult a SEBI-registered financial adviser and a qualified tax professional before making any investment decision. ShareBazaar Online accepts no liability for any loss arising from the use of this content.