
Dividend Snapshot
Company
TD Power Systems Limited
NSE: TDPOWERSYS | BSE: 533553 | ISIN: INE419M01027
Dividend
Final Dividend ₹1.10 per share (FY2025–26)
Face value ₹2 | Coupon on face value: 55%
Yield at a glance (CMP ₹1,236, 10-Aug-2026)
- Final-dividend yield: 0.09%
- Full-year FY26 yield (₹2.10 incl. interim): 0.17%
Payout & coverage (consolidated)
- Consolidated EPS FY26: ₹15.28
- Full-year payout ratio: ~14% | Earnings cover: 13.9× (final only)
The headline reads “55% dividend”, but that is a percentage of the ₹2 face value — not of the ₹1,236 you pay in the market. On the traded price the final dividend works out to a near-token 0.09% cash return. TD Power is a high-growth capital-goods stock (the share is up around 166% in one year), and this dividend is a symbolic reward, not an income stream. Note also that the Board has separately approved a 1:2 stock split (₹2 face value into two ₹1 shares), which is a different corporate action from this dividend.
Dividend Announcement Summary
At its Board meeting on 14 May 2026, TD Power Systems recommended a final dividend of ₹1.10 per equity share of face value ₹2 for the year ended 31 March 2026. This is a sharp step-up from the ₹0.65 final dividend of the prior year. The company had already paid an interim dividend of ₹1.00 in November 2025, taking the full-year FY26 payout to ₹2.10 per share.
What the Board approved
- Final dividend ₹1.10/share, payable within 30 days of the AGM if approved.
- Audited standalone & consolidated results for FY26 (unmodified audit opinion).
- A separate 1:2 sub-division (split) of shares, subject to shareholder approval.
The numbers behind it (consolidated)
- Revenue ₹1,856 Cr, up ~45% year on year.
- Net profit ₹239 Cr, up ~37% year on year.
- Order book ₹1,973 Cr; FY26 order inflow up ~51%.
Approval status: This is a final dividend, so it required shareholder approval at the 27th Annual General Meeting scheduled for 12 August 2026. The record date to fix eligibility (5 August 2026) has already passed. Payment is scheduled for 11 September 2026.
Key Dates Timeline
Announcement (Board meeting)
14 May 2026
Record Date / Ex-Date
5 August 2026
Under T+1 settlement the ex-date and record date coincide.
Annual General Meeting (approval)
12 August 2026
Payment Date
11 September 2026
To have been eligible, an investor needed to hold the shares as of the 5 August 2026 record date. Buying on or after the ex-date means the seller, not the buyer, keeps this dividend.
Dividend Yield Analysis
Yield reality check. Yield is simply dividend divided by the price you pay. The “55%” figure some headlines use is the dividend as a percentage of the ₹2 face value — an accounting reference, not a return. What matters to a real buyer is the yield on the market price.
Final dividend only
- ₹1.10 ÷ ₹1,236 (10-Aug close) = 0.09%
- ₹1.10 ÷ ~₹1,187 (announcement day) = 0.09%
Full-year FY26 (interim + final)
- ₹2.10 ÷ ₹1,236 = 0.17%
- This 0.17% is the figure most data services quote as the trailing yield.
Why the yield is so low: not because the dividend is weak — per-share dividends have actually grown fast — but because the share price has run far ahead. The stock trades at roughly 81 times earnings and about 18 times book value. When the price multiplies faster than the payout, the yield mechanically shrinks. Anyone buying TDPOWERSYS is paying for growth, not for dividend income.
Dividend History Analysis
| Financial Year | Total DPS (₹, FV ₹2) | Change YoY |
|---|---|---|
| FY2020 | 0.15 | — |
| FY2021 | 0.50 | +233% |
| FY2022 | 0.70 | +40% |
| FY2023 | 1.00 | +43% |
| FY2024 | 1.10 | +10% |
| FY2025 | 1.25 | +14% |
| FY2026 | 2.10 | +68% |
Figures aggregate interim + final within each year; all on ₹2 face value. Per-share history sourced from dividend aggregators (TipRanks / Trendlyne) and cross-checked against the FY26 filing.
Classification: Consistent & Growing Payer
The dividend has risen every single year since FY2020, compounding at roughly 55% a year over six years. There have been no cuts and no suspensions in this window.
Comparability flag (split ahead)
All figures above are on the current ₹2 face value. Once the approved 1:2 split takes effect, future per-share dividends will look smaller by half on a ₹1 face value — a lower headline number that will not represent a cut. Adjust for the split before comparing.
Financial Performance Analysis
| Consolidated (₹ Cr) | FY2025 | FY2026 | Growth |
|---|---|---|---|
| Revenue from operations | 1,279 | 1,856 | +45% |
| Operating profit (EBITDA) | 235 | 335 | +43% |
| Net profit (PAT) | 175 | 239 | +37% |
| Diluted EPS (₹) | 11.18 | 15.28 | +37% |
Operating leverage check
Revenue grew 45%, operating profit 43% and PAT 37%. Profit grew a touch slower than sales — the operating margin held near 18% but net profit growth was diluted by a higher effective tax charge and a heavier depreciation base from recent capex. Growth was broadly profitable, not bought with collapsing margins.
Earnings-quality notes
- Other income was only ~₹21 Cr against ₹326 Cr pre-tax profit — earnings are operations-driven, not propped up by treasury income.
- The overseas Japan branch ran a net loss of about ₹9.7 Cr for the year, a small drag on the consolidated number.
- A ₹3 Cr exceptional impairment was taken (standalone) against the loss-making Indian subsidiary.
Standalone (parent-only) revenue was ₹1,717 Cr and PAT ₹216 Cr. The gap between standalone and consolidated PAT (₹239 Cr) comes mainly from the profitable overseas subsidiaries. Both sets of accounts carried an unmodified (clean) audit opinion.
Cash Flow Analysis
Reported profit is an opinion; cash is a fact. Here the two tell an important two-part story.
FY26: a strong cash year
- Operating cash flow (consolidated): ₹129 Cr, up from just ₹40 Cr in FY25.
- Fixed-asset capex: about ₹58 Cr.
- Simple free cash flow: roughly ₹71 Cr (Screener’s stricter FCF metric is ~₹19 Cr).
The working-capital catch
- Trade receivables jumped ₹288 Cr and inventory ₹126 Cr as the order book scaled.
- That converted ₹347 Cr of operating profit (before working capital) into only ₹129 Cr of post-tax operating cash.
- Cash conversion (CFO/operating profit) was about 39% — a lot of profit is still tied up in the balance sheet.
The nuance aggregators miss: in FY25, standalone operating cash flow was almost nothing (about ₹6 Cr) while the company paid out roughly ₹26 Cr in dividends — that year the dividend leaned on the cash pile, not on operations. FY26 fixed that with a strong ₹129 Cr operating inflow, but the pattern shows cash generation is lumpy for a fast-growing, working-capital-hungry manufacturer. The final dividend of ~₹17 Cr is small against FY26 cash flow, but investors should watch whether operating cash keeps pace with reported profit.
Balance Sheet Strength
Net cash, effectively debt-free
- Net worth: ₹1,072 Cr; book value ~₹68.6/share.
- Borrowings only ₹18 Cr against cash & bank balances of roughly ₹198 Cr.
- Net cash position: about ₹180 Cr.
Return ratios
- Return on equity (ROE): ~24.7%.
- Return on capital employed (ROCE): ~34.0% — up steadily from ~25% two years ago.
- These are strong, improving numbers for a capital-goods maker.
A near-debt-free balance sheet with ₹180 Cr of net cash easily covers a ₹17 Cr final dividend more than ten times over. The constraint on cash is not the balance sheet — it is the working capital needed to fund growth, as the cash-flow section showed. Audit note: the auditor flagged a going-concern “emphasis of matter” on the small loss-making Indian subsidiary (DF Power Systems) but judged it immaterial to the group; the group opinion is unmodified.
Dividend Sustainability Analysis
| Coverage test (final dividend ~₹17 Cr) | Result | Verdict |
|---|---|---|
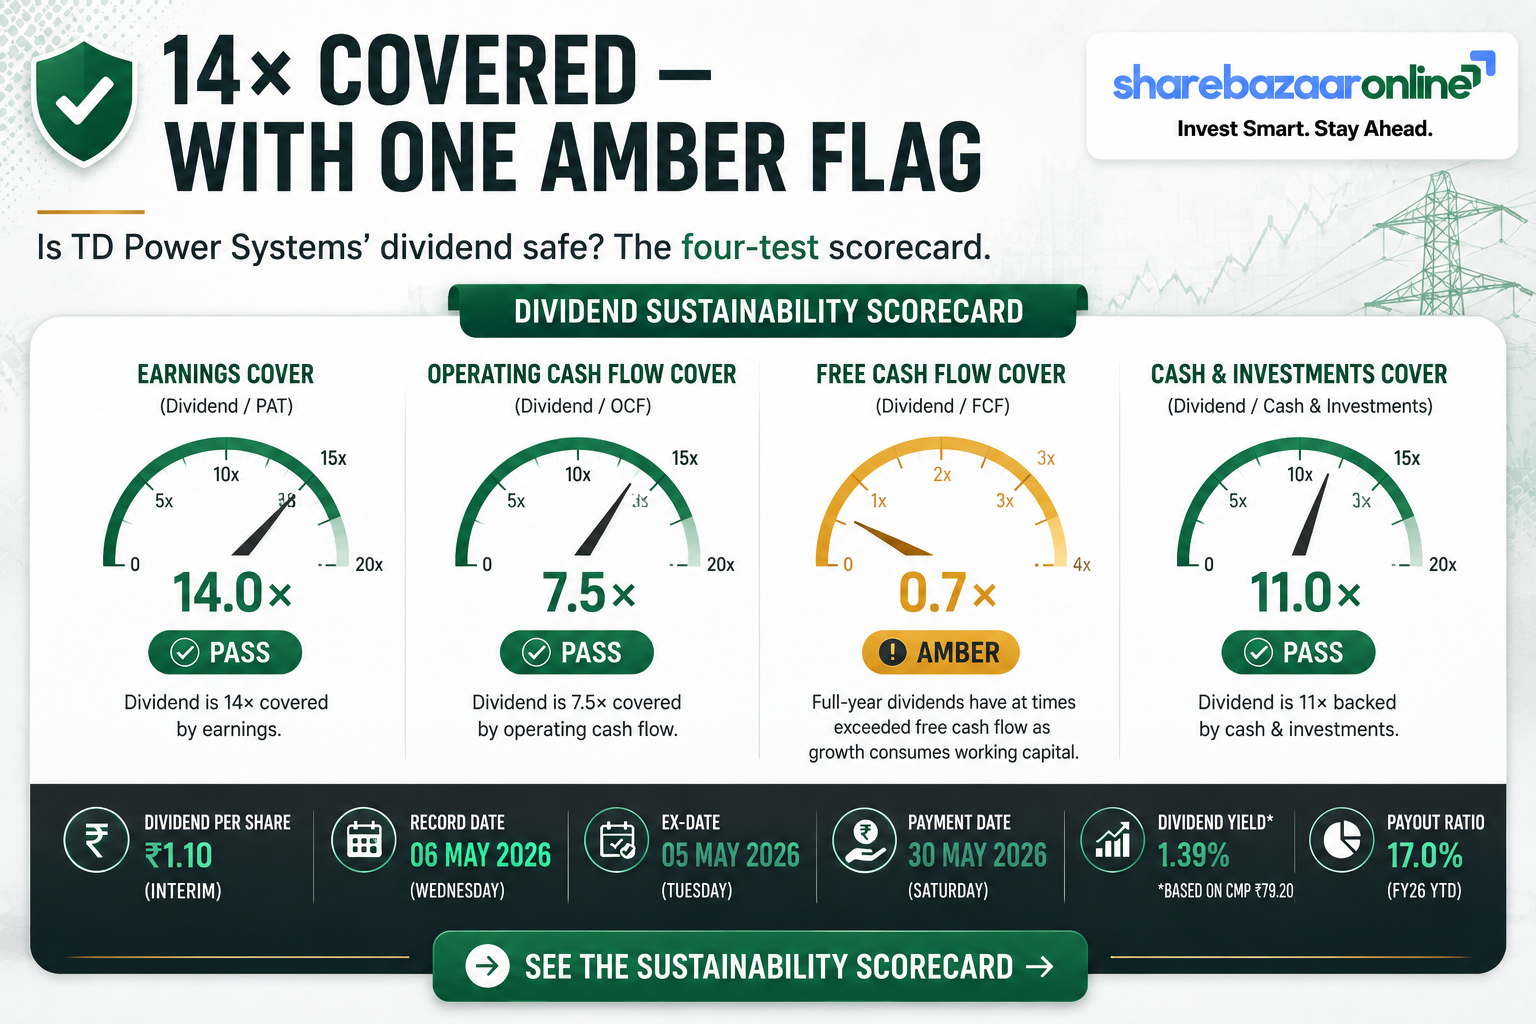
| Earnings coverage (PAT ₹239 Cr) | 13.9× | Pass |
| Operating cash coverage (CFO ₹129 Cr) | 7.5× | Pass |
| Free cash flow coverage (~₹71 Cr) | 4.1× | Pass |
| Cash & bank coverage (~₹198 Cr) | 11.5× | Pass |
Overall: Sustainable
With a payout ratio of only ~14% of profit, the dividend leaves enormous headroom. Even on the whole-year payout, earnings cover the dividend more than seven times.
The one amber flag
On a whole-year basis, dividends actually paid in FY26 (₹26 Cr) exceeded Screener’s strict free cash flow measure (₹19 Cr). The dividend is comfortably affordable, but in a heavy-capex, working-capital-intensive phase it is being funded by earnings and cash reserves rather than fully by free cash flow.
Peer Comparison
| Metric | TD Power Systems | Triveni Turbine | Bharat Bijlee |
|---|---|---|---|
| Dividend yield | ~0.17% | ~0.7% | ~1.3% |
| Payout ratio | ~14% | ~40% | ~30% |
| ROE | ~24.7% | ~28–36% | ~7% |
| ROCE | ~34.0% | high (30%+) | low single digits |
| P/E (approx) | ~81 | ~54 | ~20 |
| Balance sheet | Net cash | Net cash | Net cash |
Peer figures are approximate, drawn from Screener.in and dividend aggregators around mid-2026, for context only. Not independently audited by us; treat as indicative.
The pattern is clear. Triveni Turbine, the closest operating peer (turbine generators, strong exports, high ROE), pays out a larger slice of profit and yields more, yet still yields under 1% because it too is a re-rated growth stock. Bharat Bijlee yields the most (~1.3%) precisely because its returns and growth are far lower — a value/dividend profile rather than a growth one. TD Power sits at the growth extreme: best-in-class ROCE, the lowest payout and the lowest yield. Across this group, a low yield is a symptom of high valuation, not of a weak dividend.
Promoter Impact Analysis
Who receives the ₹17 Cr
- Promoters (26.87%): about ₹4.6 Cr.
- FIIs (26.18%) and DIIs (23.88%): the largest combined share.
- Public shareholders (23.07%): the remainder.
The big ownership shift
Promoter holding has fallen from about 58.7% (FY22) to 26.87% today — a drop of roughly 32 percentage points. Over the same period FII holding surged from ~2% to ~26%. Institutions, not the founding family, are now the dominant owners.
Because promoters now own a little over a quarter of the company, the dividend is broadly shared rather than concentrated with insiders — unlike many Indian companies where a large dividend mainly enriches a majority promoter. The dividend itself is too small to be a meaningful cash-extraction tool. The more significant story is the multi-year promoter stake reduction, which shareholders should understand independently of this payout.
Taxation Analysis
Since April 2020, dividends in India are taxed in the hands of the investor at their applicable income-tax slab rate. The company also deducts TDS at 10% under Section 194 if a shareholder’s total dividend from that company in the year exceeds ₹10,000 (for a valid PAN; higher without one). TDS is a prepayment, adjustable against final tax.
Worked example — 1,000 shares, 30% tax slab
- Gross dividend: 1,000 × ₹1.10 = ₹1,100.
- TDS: none deducted here, as ₹1,100 is below the ₹10,000 threshold.
- Tax at 30% slab: ₹330 (paid via the investor’s return).
- Net dividend in hand: ₹770.
- Effective post-tax yield at ₹1,236: about 0.06%.
Illustrative only; not tax advice. Actual liability depends on your total income, surcharge, cess and the aggregate dividend received. Investors in lower slabs pay proportionately less. Consult a qualified tax adviser.
Key Risks
- Valuation risk. At ~81× earnings and ~18× book, the price already discounts years of strong growth. Any execution stumble could de-rate the stock sharply — and with a ~0.09% yield, dividends offer no cushion.
- Working-capital and cash-conversion risk. Receivables and inventory absorbed over ₹400 Cr of cash in FY26; debtor days rose to ~146. If growth keeps outrunning collections, operating cash flow can lag profit, as it did in FY25.
- Export & currency concentration. Exports make up roughly two-thirds of order inflow, so demand from a few overseas markets and rupee moves materially affect results; the Japan branch was loss-making this year.
- Order-execution & capacity risk. A large order book (~₹1,973 Cr) and an aggressive capacity build for larger generators must convert to delivered, paid revenue on schedule to justify the valuation.
- Ownership & overhang risk. Promoter holding has fallen ~32 points since FY22; further insider selling or heavy FII churn (FIIs now ~26%) could pressure the share price.
- Subsidiary risk. The auditor flagged a going-concern uncertainty at the Indian subsidiary; while immaterial to the group today, it required a ₹3 Cr impairment this year.
What To Monitor
- Operating cash flow vs profit. Watch whether CFO keeps converting profit at a healthy rate (FY26 was ~39% of operating profit) or slips back toward the weak FY25 pattern.
- Debtor and inventory days. A reversal of the rising trend would signal that growth is becoming self-funding; further deterioration is a warning.
- Order inflow and book-to-bill. Track whether the ~₹1,973 Cr order book and FY27 revenue guidance of ~₹2,400 Cr+ are backed by fresh inflows.
- Margin trajectory. Management’s ~17.75–18.75% margin band, and whether large-generator expansion dilutes or lifts it.
- Split execution & future payout policy. When the 1:2 split takes effect and whether the payout ratio is lifted from today’s low ~14% as the growth phase matures.
- Promoter shareholding. Any further reduction, and the destination of FII/DII flows each quarter.
Conclusion
Positives
- Dividend raised sharply; a consistent, growing payer for six years.
- Very strong coverage — 14× earnings, ~14% payout.
- Best-in-peer-group ROCE (~34%), ROE ~25%, effectively debt-free with ~₹180 Cr net cash.
- Revenue +45%, PAT +37%, order book at record levels.
Negatives / watch-items
- Cash yield is a token ~0.09% — no income appeal at this price.
- Rich valuation (~81× earnings) leaves no margin for error.
- Working capital is consuming cash; FY25 operating cash flow was weak.
- Promoter stake down ~32 points since FY22.
TD Power Systems’ FY26 final dividend of ₹1.10 is a healthy, well-covered and rising payout — but as a cash return it is almost irrelevant at a market price above ₹1,200. This is a growth and capital-appreciation story with a symbolic dividend attached, sitting on excellent returns and a fortress balance sheet, but priced for years of continued execution. We present the positives, negatives, risks and monitoring points; the investment decision is yours.
Frequently Asked Questions
What dividend has TD Power Systems announced for FY26?
What is the dividend yield on TDPOWERSYS?
What is the record date for the dividend?
What is the ex-dividend date?
When will the dividend be paid?
Who is eligible to receive the dividend?
How is this dividend taxed?
Is the dividend sustainable?
What is TD Power Systems’ dividend history?
What should investors monitor from here?
Is the stock split the same as the dividend?
Why is the dividend yield so low if the dividend keeps rising?
Disclaimer
This article is for informational and educational purposes only and does not constitute investment, financial, legal or tax advice, nor a recommendation to buy, sell or hold any security. ShareBazaar Online is not a SEBI-registered investment adviser. Figures are drawn from the company’s exchange filings and publicly available sources (including Screener.in and dividend aggregators) believed reliable but not independently verified for every data point; market price, yield and date figures are time-sensitive and must be re-confirmed against live NSE/BSE data and the company’s corporate-action circulars before any decision. All dividend, split, AGM and payment details are subject to statutory and shareholder approvals. Past performance is not indicative of future results. Readers should conduct their own due diligence and consult a qualified, SEBI-registered adviser and a tax professional before investing.