
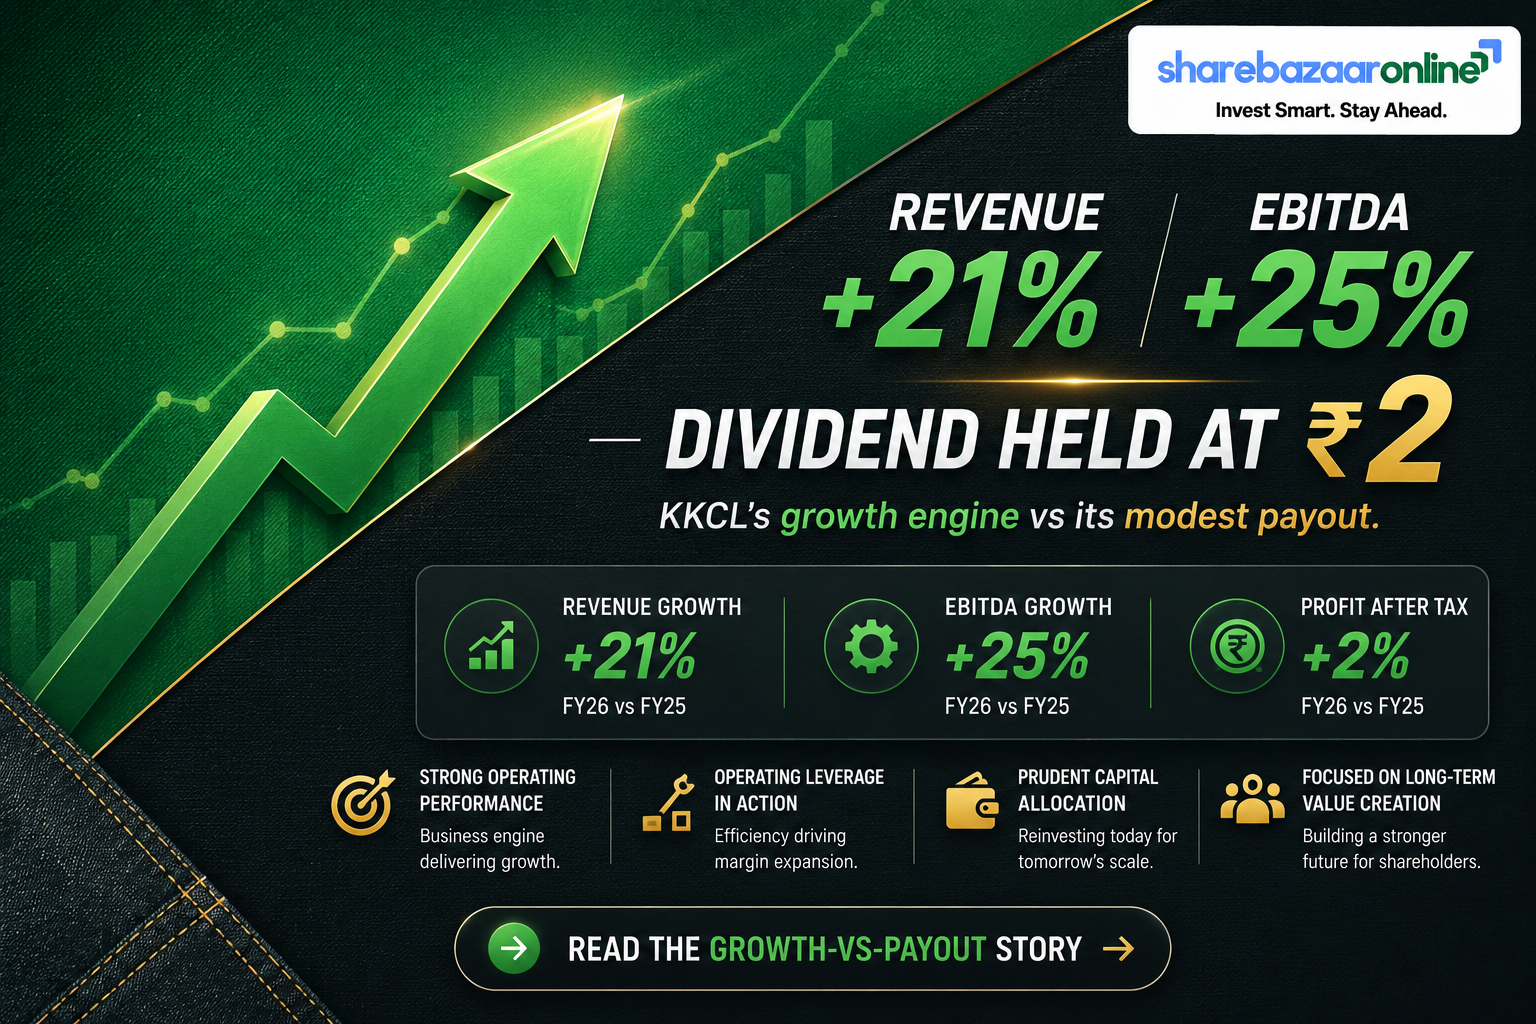
Dividend Snapshot
Kewal Kiran Clothing Limited (NSE: KKCL, BSE: 532732, ISIN: INE401H01017) has declared its 2nd Interim Dividend of ₹2 per share for FY2025-26 — a 20% payout on the ₹10 face value.
At the current market price of about ₹535, that ₹2 works out to a headline yield of just 0.37%. The eye-catching “20%” refers to face value, not to what you pay for the share.
Dividend Announcement Summary
At a board meeting held on Saturday, 9 May 2026 (which ran from 4:30 p.m. to 6:00 p.m.), the directors of Kewal Kiran Clothing declared a second interim dividend of ₹2 per equity share on 6,16,25,185 shares of ₹10 face value, for the financial year 2025-26. The declaration was filed with BSE and NSE under Regulation 43(1) read with Regulation 30 of SEBI (LODR) Regulations, 2015.
This is the second interim payout for FY26. The company had already declared a 1st interim dividend of ₹2 per share on 10 February 2026. Together, the two tranches take the full-year FY26 dividend to ₹4 per share.
Why it matters that this is an “interim” dividend: interim dividends are declared and approved by the Board of Directors and are not subject to a separate shareholder vote at the AGM. So this ₹2 is confirmed and payable — there is no “pending approval” overhang. The total cash going out for this tranche is about ₹12.33 crore.
Key Dates Timeline
Under India’s T+1 settlement cycle, the ex-date and record date fall on the same day (14 May 2026). To have been eligible, an investor needed to hold the shares at the end of 14 May 2026. Anyone buying on or after the ex-date did not qualify for this payout.
Note: the record date is confirmed from the company’s results filing and exchange corporate-action data. Both these dates have already passed relative to publication.
Dividend Yield Analysis
The 20% headline is a face-value illusion. “20% dividend” simply means ₹2 on a ₹10 face value. Your actual return depends on the market price you pay.
Reality check: even counting both FY26 interims (₹4 total), the trailing yield is only about 0.75%. That is well below the ~1.0%+ average yield of the broader consumer-cyclical space and far below dividend-focused apparel peers such as Monte Carlo Fashions (~3.8–4.0%).
KKCL is not a high-yield stock. It is a growth-oriented apparel company that pays a small, symbolic dividend and retains the bulk of its earnings to fund store expansion and acquisitions.
Dividend History Analysis
| Financial Year | Total DPS | Payout Ratio* | Notes |
|---|---|---|---|
| FY2025-26 | ₹4.00 | ~9% (accounts) | ₹2 (Feb-26) + ₹2 (May-26) |
| FY2024-25 | ₹2.00 | ~9% | Single interim |
| FY2023-24 | ₹2.00 | ~8% | Single interim |
| FY2021-22 | ₹9.00 | ~143% | High-payout / low-profit year |
| FY2020-21 | ₹4.80 | ~143% | COVID year, low base profit |
*Payout ratio and older-year totals are sourced from Screener.in and dividend aggregators (INDmoney, TipRanks); tranche dates for FY26 are confirmed from company filings. Older annual totals may include specials and are labelled “sourced from aggregator”.
The forensic story the wire misses: KKCL’s dividend has shrunk, not grown. In FY2016–FY2022 the company routinely paid ₹5–₹12 per year, with payout ratios often above 100%. Over the last five years the annual dividend has actually declined at roughly 25% a year even as profits compounded strongly. The payout ratio has collapsed from >100% to single digits. This is a deliberate shift: management is now retaining cash to fund aggressive exclusive-brand-outlet (EBO) expansion and brand acquisitions (Kraus, Cross), not to distribute it. This makes KKCL a cyclical / irregular payer, not a consistent dividend-growth stock.
Financial Performance Analysis
Consolidated, FY26 vs FY25 (₹ Crore)
| Metric | FY25 | FY26 | Chg |
|---|---|---|---|
| Revenue | 1,003 | 1,213 | +20.9% |
| EBITDA | 191 | 238 | +24.6% |
| Other income | 49 | 24 | -51% |
| PBT | 198 | 203 | +2.5% |
| PAT | 149 | 152 | +2.0% |
| EPS (₹) | 23.44 | 23.03 | -1.7% |
Operating leverage: strong top line, flat bottom line
Here is the divergence that headlines miss: EBITDA jumped 24.6%, but PAT rose only 2%. The operating business is genuinely strong — revenue up 20.9% and margin holding around 20%. But the ₹47 crore of extra operating profit was almost entirely eaten up below the operating line:
- Other (non-operating) income fell ₹25 crore (lower realised investment gains)
- Depreciation rose ₹12 crore (more stores, lease/ROU assets)
- Interest cost rose ₹4 crore
Net effect: PBT barely moved (+₹5 crore). Earnings-quality note: the flat profit is due to lower one-off investment gains, not weakness in the core apparel business.
Cash Flow Analysis
Reported profits are opinions; cash is fact. This is where KKCL’s story gets interesting.
| ₹ Cr | FY25 | FY26 |
|---|---|---|
| PAT | 149 | 152 |
| Operating cash flow | 14 | 183 |
| Free cash flow | -70 | 166 |
| OCF / EBITDA | 25% | 96% |
The FY25 red flag — and its FY26 reversal. In FY25, KKCL reported a healthy ₹149 crore profit but converted only ₹14 crore into operating cash, and free cash flow was negative ₹70 crore. Profit was locked up in a working-capital build-up (inventory and receivables).
In FY26 this reversed sharply: operating cash flow recovered to ₹183 crore and FCF turned positive at ₹166 crore. So the FY26 dividend of ₹24.65 crore (both tranches) is comfortably funded from current operating cash flow — roughly 7× covered by FCF.
Still worth watching: working-capital days rose from ~84 to 147 over the period. FY26 cash conversion was good, but the multi-year trend in working capital is the single biggest swing factor in KKCL’s cash generation.
Balance Sheet Strength
KKCL runs a low-leverage balance sheet. Against ₹128 crore of borrowings it holds roughly ₹165 crore of investments, leaving it effectively in a modest net-cash position (about ₹37 crore). The debt-to-equity ratio of just 0.14× means the ₹2 dividend is being paid from a position of financial comfort, not from a stretched balance sheet.
Screener also flags that the company has reduced debt versus the prior year. From an affordability standpoint, the dividend is not a solvency concern.
Dividend Sustainability Analysis
| Coverage Test | Result | Verdict |
|---|---|---|
| Earnings cover (EPS ₹23.03 / FY26 DPS ₹4) | 5.8× | Pass |
| OCF cover (₹183 Cr / ₹24.65 Cr) | 7.4× | Pass |
| FCF cover (₹166 Cr / ₹24.65 Cr) | 6.7× | Pass |
| Liquidity cover (Investments ₹165 Cr) | 6.7× | Pass |
| FY25 FCF cover (₹-70 Cr) | Negative | Amber (prior yr) |
Verdict: Sustainable at the current level. With a payout ratio in the high-single-to-mid-teens, low debt, and FY26 free cash flow covering the payout nearly 7 times over, this small dividend is easily affordable. The only caveat is that cash generation has been volatile year-to-year (FY25 FCF was negative), so the low payout ratio is a feature, not a bug — it gives KKCL room to keep paying even in a weak working-capital year.
Peer Comparison
| Company | Div Yield | Payout | ROE | ROCE |
|---|---|---|---|---|
| KKCL | ~0.75% | ~9–16% | 16.1% | 18.1% |
| Monte Carlo Fashions | ~3.8–4.0% | ~54% | — | ~11.8% |
| Cantabil Retail | ~0.5% | ~11–12% | ~20% | ~16.5% |
| Page Industries | ~1.9% | ~109% | ~47.6% | — |
| Dollar Industries | ~0.84% | ~17% | — | — |
Peer figures sourced from Screener.in, MarketsMojo, TipRanks and company data; blank cells are left blank where a figure could not be independently confirmed. Yields are price-dependent and change daily.
Read-across: KKCL sits at the low-yield, high-retention end of the branded-apparel table. Its return ratios (ROE 16%, ROCE 18%) are healthy and better than Monte Carlo’s, but as an income stock it is far behind Monte Carlo (~4%) and even Page (~1.9%). Page and Monte Carlo return a big chunk of profit to shareholders; KKCL keeps it to grow.
Promoter Impact Analysis
With the promoter family (the Jains) holding 74.29%, the lion’s share of any dividend flows back to them. Of this ₹12.33 crore tranche, roughly ₹9.16 crore goes to promoters; over the full FY26 (₹24.65 crore), about ₹18.31 crore is promoter income. Public shareholders collectively receive around ₹3.17 crore from this tranche.
Alignment note: because dividends are pro-rata, the promoters’ own preference for a low payout (keeping cash inside the company for expansion) is fully aligned with minority holders who also benefit from reinvestment — provided that reinvestment keeps earning healthy returns (ROCE ~18%).
Taxation Analysis
Since April 2020, dividends are taxable in the hands of the investor at their applicable income-tax slab rate. Key rules:
- Dividend is added to your total income and taxed at your slab rate.
- TDS at 10% is deducted by the company only if your total dividend from it exceeds ₹5,000 in a financial year (20% if PAN is not provided).
- For NRIs, TDS is generally 20% (plus surcharge and cess) under Section 195, subject to treaty relief.
Worked example — investor holding 1,000 shares
For this 2nd interim alone (₹2 × 1,000 = ₹2,000), a 30% payer keeps ₹1,400 after tax. Post-tax yield at ₹535 is roughly 0.52% on the full-year dividend.
Key Risks
- Working-capital swings. Working-capital days rose from ~84 to 147; a repeat of the FY25 build-up (OCF just ₹14 Cr, FCF ₹-70 Cr) can quickly drain cash even when profits look fine.
- Earnings dependence on other income. FY26 PAT was flat mainly because non-operating investment gains fell ₹25 crore. Reported profit can wobble with investment-income swings that have nothing to do with apparel demand.
- Discretionary demand & seasonality. Apparel is consumer-discretionary and highly seasonal (management itself flags uneven quarterly revenue); a slowdown in consumption directly hits sales.
- Execution risk on expansion. Heavy retention is being ploughed into EBO rollout and acquisitions (Kraus, Cross). If new stores/brands under-earn, the case for low dividends weakens.
- Very low free float / high promoter holding (74.29%). Thin public float can mean higher price volatility and limited institutional interest.
- Yield is tiny. At ~0.75% trailing, KKCL offers almost no income cushion; total return depends almost entirely on capital appreciation.
What To Monitor
- Cash conversion (OCF vs PAT). Watch whether FY26’s strong 96% OCF/EBITDA holds, or slips back toward FY25’s 25%.
- Working-capital days. A move back below ~100 days would confirm the FY26 improvement is structural, not a one-off.
- EBO store count & new-store productivity. The whole low-dividend thesis rests on retained cash earning good returns from expansion (666+ stores and rising).
- EBITDA margin (~20%). Management guides 17–18%; sustained 20%+ would signal pricing power and mix improvement.
- Payout-ratio trend. Any move to raise the payout ratio would re-rate KKCL as an income name; continued single-digit payout confirms the growth-reinvestment stance.
- Other-income normalisation. Track how much of PBT comes from investment gains versus core operations.
Conclusion
Kewal Kiran Clothing’s 2nd interim dividend of ₹2 per share is a small, easily-affordable payout that takes FY26 to ₹4 per share — a trailing yield of roughly 0.75%. The “20%” label is on face value; the real yield on market price is a fraction of a percent.
Positives: low debt (D/E 0.14×), healthy return ratios (ROE 16%, ROCE 18%), a sharp FY26 cash-flow recovery (FCF ₹166 Cr), and a dividend covered nearly 7× by free cash flow. Negatives: a shrinking dividend over five years, flat FY26 profit despite 25% EBITDA growth (masked by lower other income), volatile working capital, and a negligible yield. This is a growth-and-retention apparel story, not an income stock. The facts are laid out above; the investment decision is yours.
Frequently Asked Questions
What dividend has Kewal Kiran Clothing announced?
What is the dividend yield?
What is the record date?
What is the ex-date?
When will the dividend be paid?
Who is eligible for the dividend?
How is this dividend taxed?
Is the dividend sustainable?
What is KKCL’s dividend history?
Why did profit stay flat when revenue grew 21%?
How much of the dividend goes to promoters?
What should investors monitor going forward?
How does KKCL compare with peers on dividends?
Disclaimer
This article is for informational and educational purposes only and does not constitute investment, financial, legal or tax advice, nor a recommendation to buy, sell or hold any security. ShareBazaar Online is not a SEBI-registered investment adviser. Figures are drawn from company exchange filings and third-party sources (Screener.in, INDmoney, TipRanks, MarketsMojo and others) believed to be reliable but not independently guaranteed; market prices and yields are dynamic and change continuously. All yield and ratio figures are price-dependent and should be re-verified against the live market price before use. Please consult a SEBI-registered financial adviser and conduct your own due diligence before making any investment decision. The author and publisher accept no liability for any loss arising from the use of this information.