
Dividend Snapshot
Interim Dividend Declared
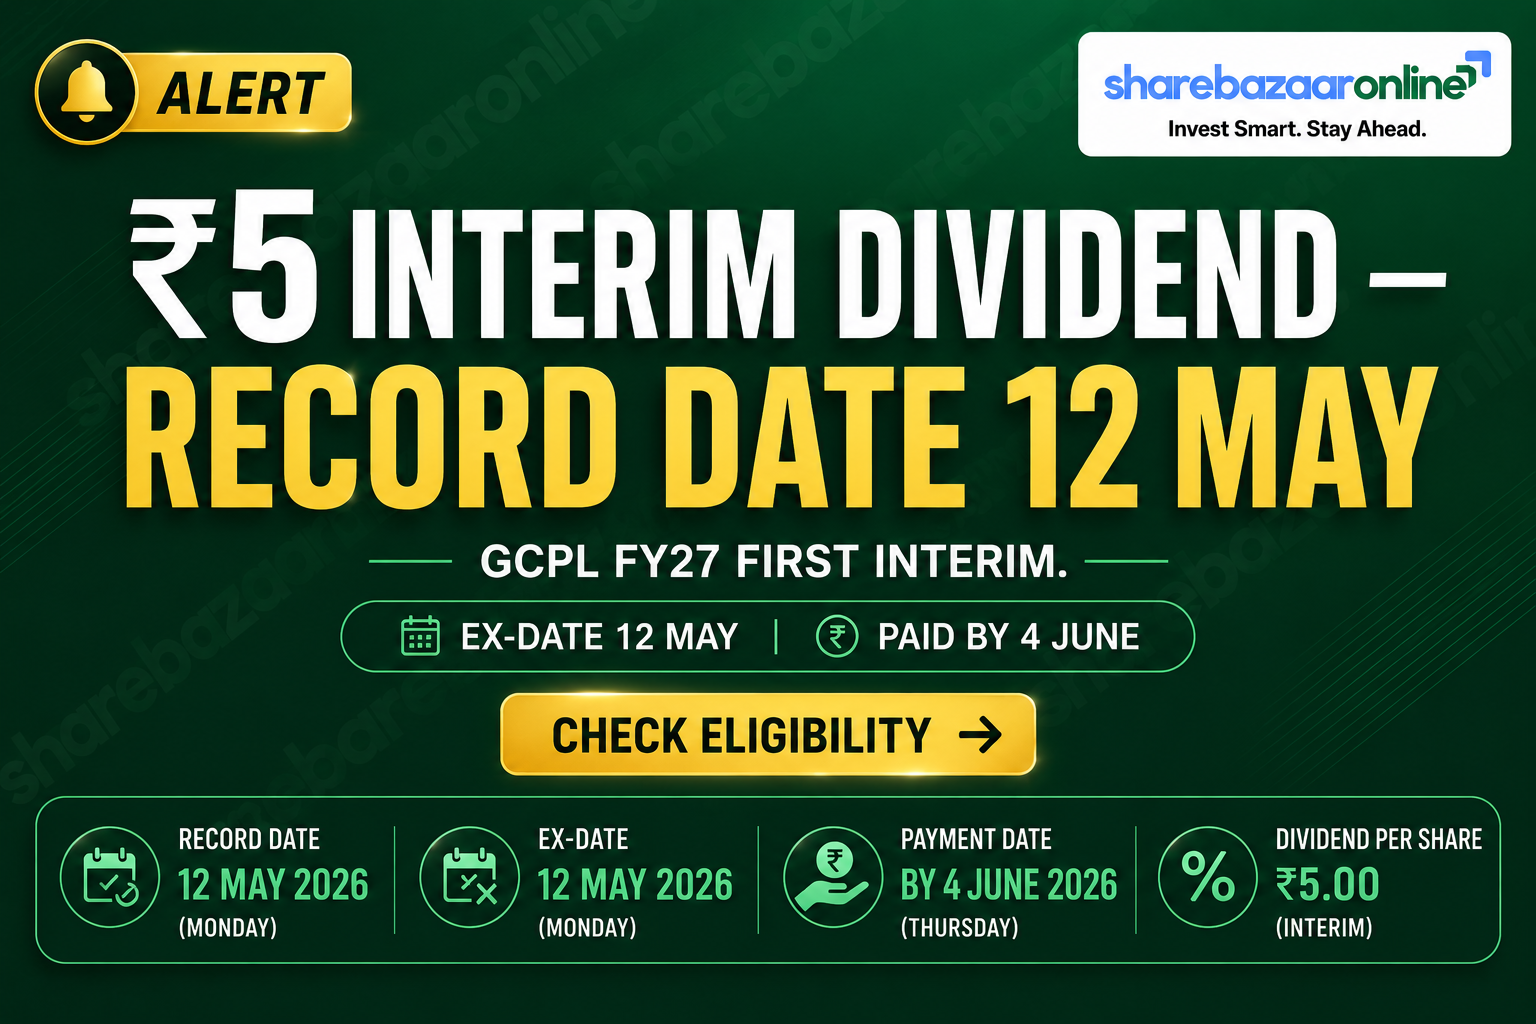
₹5.00 per share
500% on face value of ₹1 • For Financial Year 2026–27
Total Payout (this interim)
₹511.60 Crore
On 102.32 crore equity shares outstanding
| Company | Godrej Consumer Products Ltd |
| NSE / BSE | GODREJCP / 532424 |
| ISIN | INE102D01028 |
| Dividend Type | Interim |
| Face Value | ₹1 |
| Announcement Date | 06-May-2026 |
| Record Date | 12-May-2026 |
| Ex-Date (T+1) | 12-May-2026 |
| Payment Date | On or before 04-Jun-2026 |
| Yield (this interim) | ~0.48% |
The story wire services missed: This ₹5 payout looks routine, but GCPL is now paying out more than it earns — its annualised payout ratio ran near 110% in FY26 — just three years after it paid zero dividend for three consecutive years (FY21, FY22, FY23). This single interim is comfortably covered, but the full-year run-rate leans on the balance sheet, not on profit growth.
Dividend Announcement Summary
At its board meeting on Wednesday, 6 May 2026, the Board of Directors of Godrej Consumer Products Limited (GCPL) declared an interim dividend of ₹5 per equity share — equal to 500% on the ₹1 face value — for the financial year 2026–27. The declaration accompanied the company’s audited results for the quarter and year ended 31 March 2026.
What was approved
The board fixed the record date as Tuesday, 12 May 2026 and confirmed the dividend will be paid on or before Thursday, 4 June 2026. Because this is an interim dividend, it does not require shareholder approval at the AGM — a distinction that often confuses retail investors.
Declared alongside
The same board meeting re-appointed Sudhir Sitapati as Managing Director & CEO for five years from 18 October 2026, and noted the retirement of Nadir Godrej as a Non-Executive Director from 7 August 2026. The 26th AGM was convened for 7 August 2026.
Context for readers: GCPL pays dividends in multiple tranches through the year. A second ₹5 interim for FY27 was subsequently declared on 7 August 2026 (record date 13 August 2026, payment on or before 5 September 2026). This article analyses the first FY27 interim of 6 May 2026; the later payout is referenced only for run-rate context.
Key Dates Timeline
Note on eligibility: The last day to buy shares and still qualify was Monday, 11 May 2026 (one trading day before the ex/record date), given the T+1 cycle.
Dividend Yield Analysis
Yield on this ₹5 interim
~0.48%
₹5 ÷ latest CMP of ~₹1,050 (NSE/BSE, 7-Aug-2026 close)
Trailing 12-month yield
~1.90%
~₹20 paid over the last year ÷ ~₹1,050 CMP
Yield reality check
A single ₹5 tranche is a small slice of yield. GCPL’s meaningful figure is the trailing ~1.90%, built from four or more interim payouts a year. Two forces are moving that number: (1) the company has ramped total annual dividend from ₹0 (FY21–FY23) to roughly ₹20 a share, and (2) the share price is down about 11% over the past year (52-week range ₹967–₹1,309). Falling price mechanically lifts yield, so part of the “attractive” yield reflects price weakness, not just generosity. At the 6-May-2026 announcement, the stock closed near ₹1,094.60 on the BSE.
All yield figures are price-dependent and go stale quickly. Re-verify the live CMP at the moment of reading before relying on any yield number here.
Dividend History Analysis
Recent per-tranche history (exchange record dates)
| Record Date | Type | ₹ / share (FV ₹1) |
|---|---|---|
| 13-Aug-2026 | Interim (FY27) | 5.00 |
| 12-May-2026 | Interim (FY27) — this article | 5.00 |
| 13-Aug-2025 | Interim | 5.00 |
| 13-May-2025 | Interim | 5.00 |
| 03-Feb-2025 | Interim | 5.00 |
| 01-Nov-2024 | Interim | 5.00 |
| 16-Aug-2024 | Interim | 5.00 |
| 14-May-2024 | Interim | 10.00 |
| 09-Nov-2023 | Interim (resumption) | 5.00 |
Source: exchange corporate-action records (BSE/NSE), cross-referenced with TipRanks and INDmoney. Figures are on the current ₹1 face value.
The full-year payout ratio tells the real story
| Financial Year | Dividend Payout % | Signal |
|---|---|---|
| FY19 | 44% | Consistent payer |
| FY20 | 55% | Consistent payer |
| FY21 | 0% | Suspended |
| FY22 | 0% | Suspended |
| FY23 | 0% | Suspended |
| FY24 | Loss year* | Resumed ₹5 |
| FY25 | 138% | Above earnings |
| FY26 | 110% | Above earnings |
*FY24 consolidated PAT was negative due to a large one-off goodwill/impairment charge, so a payout ratio is not meaningful. Payout ratios sourced from Screener.in consolidated data.
Classification: Irregular payer turning aggressive
GCPL is not a smooth, consistent dividend compounder. It stopped dividends entirely for three years while it de-levered and reinvested, then restarted in FY24 and quickly moved to payouts above 100% of profit. The pattern is best described as an irregular payer that has shifted to a very high, cash-backed distribution policy — generous today, but with a track record that shows the tap can be turned off.
Financial Performance Analysis
Consolidated, FY ended 31-Mar-2026 (₹ Crore)
| Metric | FY26 | FY25 | Change |
|---|---|---|---|
| Revenue from Operations | 15,177.90 | 13,996.54 | +8.4% |
| Profit before exceptional & tax | 2,823.31 | 2,735.07 | +3.2% |
| Exceptional items (net) | (233.15) | (63.18) | +269% |
| Profit before tax | 2,590.16 | 2,671.89 | -3.1% |
| Net Profit (owners) | 1,861.47 | 1,852.30 | +0.5% |
| EPS (basic, ₹) | 18.19 | 18.11 | +0.4% |
The operating-leverage divergence
Revenue grew +8.4% and operating profit before exceptionals rose +3.2%, yet reported net profit was essentially flat (+0.5%). The gap sits almost entirely in exceptional items, which nearly quadrupled to ₹233 crore — product-litigation costs at the US Strength of Nature hair-relaxer business, restructuring across LATAM and Africa, and the one-off statutory impact of India’s new labour codes.
Standalone vs consolidated
The India (standalone) business was far stronger: revenue +7.9% and PAT +12.2% to ₹1,515.61 crore. So the flat consolidated profit is an overseas-and-one-off story, not a domestic demand problem. Dividends are paid out of the parent, and the India engine that funds them is growing double digits.
Earnings-quality note: Other income of ₹266 crore was ~10% of pre-tax profit — a modest, non-alarming level. Operating margin held around 21%. The profit “miss” is a below-the-line exceptional-items effect rather than a deterioration in the core business.
Cash Flow Analysis
Consolidated cash flows (₹ Crore)
| Item | FY26 | FY25 |
|---|---|---|
| Operating cash flow (OCF) | 2,488.46 | 2,576.75 |
| Capex (PPE + intangibles) | (569.52) | (599.34) |
| Free cash flow (OCF − capex) | 1,918.94 | 1,977.41 |
| Dividend paid (during year) | (2,046.21) | (2,557.28) |
| Net cash from financing | (2,387.64) | (2,181.50) |
Cash quality is genuine
OCF of ₹2,488 crore exceeded net profit of ₹1,861 crore, giving an OCF-to-operating-profit ratio near 95%. This is a cash-rich, working-capital-light FMCG model — profits convert into real cash, not accounting entries.
But dividends are eating almost all of FCF
Full-year dividends of ₹2,046 crore exceeded free cash flow of ₹1,919 crore. The shortfall was bridged partly by trimming investments and a small rise in short-term borrowings. This single ₹5 interim (₹512 crore) is easily covered; the annual run-rate is the tight part.
Where is the dividend funded from? For this interim: comfortably from current earnings and operating cash. For the full-year policy: from a blend of FCF plus a modest draw on cash reserves and short-term debt — sustainable while OCF stays near ₹2,500 crore, but with little spare room.
Balance Sheet Strength
Cash & investments (Mar-26)
₹3,772 Cr
Cash ₹977 + bank ₹29 + current inv ₹1,852 + non-current inv ₹914
Net debt (incl. leases)
~₹644 Cr
Gross debt ~₹4,416 Cr − liquid ₹3,772 Cr; Debt/Equity 0.33
A lightly-levered balance sheet
Total equity stands at ₹12,653 crore against gross debt of ~₹4,416 crore, for a debt-to-equity of just 0.33. Interest cover is strong (interest service coverage ~7.5x consolidated). The net-debt position is small relative to a company generating ~₹2,500 crore of operating cash a year, which is precisely what lets management sustain a 100%+ payout without financial stress — for now.
Watch flag: Consolidated current ratio is below 1.0 (0.91), and short-term borrowings rose to ₹4,136 crore. This is common for cash-generative FMCG names but means the company relies on rolling short-term facilities rather than holding a large net-cash buffer.
Dividend Sustainability Analysis
Four-test coverage framework
| Test | This ₹5 interim | Annualised (~₹20/yr) |
|---|---|---|
| Earnings coverage (PAT ÷ outflow) | 3.64x | 0.91x |
| OCF coverage | 4.86x | 1.22x |
| FCF coverage | 3.75x | 0.94x |
| Cash/liquidity coverage | 7.37x | 1.84x |
Verdict: Moderately Sustainable
Judged as a single interim, the ₹5 payout is unambiguously Sustainable — covered 3.6x by earnings and 4.9x by operating cash. Judged as an annual policy of ~₹20 a share, it is Moderately Sustainable: the payout ratio is above 100%, FCF coverage is just under 1x, and the gap is met from cash reserves. GCPL can maintain this while OCF holds near ₹2,500 crore, but there is little margin for a demand shock or a step-up in overseas litigation costs.
Watch flag: Some sell-side analysts have flagged that a payout consistently above earnings may eventually be trimmed. The three-year suspension in FY21–FY23 shows management is willing to cut when priorities change.
Peer Comparison
| Company | Div. Yield | Payout % | ROE |
|---|---|---|---|
| Godrej Consumer (GCPL) | ~1.90% | ~110% | 16.1% |
| Hindustan Unilever | ~3.2% | >100% | Not Independently Verified |
| Dabur India | ~1.7% | ~77% | ~21% |
| Marico | ~1.5% | ~83% | Not Independently Verified |
| Colgate-Palmolive India | ~1.9% | High | Not Independently Verified |
Peer figures are approximate, drawn from public aggregators and dated around mid-2026. Cells that could not be independently verified from primary sources are labelled accordingly rather than estimated.
How GCPL sits in the pack
GCPL’s ~1.9% yield is mid-pack — below HUL but in line with Colgate. Its payout above 100% is not unusual for large FMCG (HUL also exceeds 100%), a sign the sector is returning cash rather than reinvesting for high growth. GCPL’s ROE of ~16% trails Dabur’s ~21%, reflecting its heavier overseas asset base (Africa, Indonesia, LATAM) versus India-centric peers.
Promoter Impact Analysis
Promoter share of this interim
~₹271 Cr
53.06% promoter holding × ₹511.60 Cr outflow
Minority (public + institutions)
~₹240 Cr
46.94% of the outflow flows to non-promoter holders
The ownership shift that reframes the dividend
| Holder | Mar-2024 | Jun-2026 |
|---|---|---|
| Promoters | 63.21% | 53.06% |
| FIIs | 22.56% | 12.33% |
| DIIs | 8.94% | 19.58% |
| Public | 5.27% | 15.03% |
Why this matters for a dividend reader: Promoters trimmed their stake by ~10 points (a large 2024 block sale) and foreign investors have nearly halved their holding since early 2024 — from ~22.6% to ~12.3%. Domestic mutual funds and retail have absorbed the stock. A rising 100%+ payout is exactly the kind of cash-return policy that appeals to the domestic income buyers now on the register, even as global funds have been exiting.
Taxation Analysis
How dividends are taxed in India
Since April 2020, dividends are taxable in the hands of the shareholder at their applicable income-tax slab rate. There is no separate dividend distribution tax. The company deducts TDS at 10% under Section 194 only if total dividend paid to a resident shareholder exceeds ₹10,000 in a financial year (a higher ₹5,000 threshold applied earlier; the ₹10,000 limit applies from FY26). TDS is a credit against final tax, not an extra cost.
Worked example — 1,000 shares, ₹5/share, 30% slab
| Gross dividend (1,000 × ₹5) | ₹5,000 |
| TDS @10% (this payout is below the ₹10,000 annual threshold) | ₹0* |
| Tax @30% slab (+ applicable cess) | ₹1,500 |
| Net dividend in hand | ₹3,500 |
| Effective post-tax yield @ ₹1,050 CMP | ~0.33% |
*If the shareholder’s total GCPL dividends across the year exceed ₹10,000, 10% TDS applies on the full amount and is later adjusted against slab liability. Cess of 4% on tax is ignored for simplicity.
Key Risks
1. Payout above earnings. An annual payout near 110% of profit and just under 1x free cash flow leaves no cushion; a weak year could force a dividend trim, as happened in FY21–FY23.
2. US hair-relaxer litigation. Ongoing product-liability and class-action costs at the Strength of Nature (SON) subsidiary drove exceptional items to ₹233 crore; an adverse escalation would hit consolidated cash and profit.
3. Overseas drag. Africa, Indonesia and LATAM restructuring keeps producing one-offs and currency volatility, decoupling reported consolidated profit from the healthier India business.
4. Rich valuation. The stock trades around 50x earnings; any earnings disappointment in a premium FMCG multiple can trigger sharp de-rating, and the price is already down ~11% over a year.
5. Foreign-investor selling. FII holding has nearly halved since early 2024; continued outflows can weigh on the share price and, mechanically, distort the yield.
6. Input-cost and competition. Palm oil and packaging inflation, plus aggressive D2C and regional competition, can compress the ~21% operating margin that funds the dividend.
What To Monitor
1. Full-year FY27 payout ratio. Track whether total FY27 dividends stay near ₹20 or are trimmed toward the <100%-of-profit level that FCF can fully cover.
2. Operating cash flow trend. The 100%+ payout only works while OCF holds near ₹2,500 crore — watch quarterly cash conversion and working-capital days.
3. Exceptional-item run-off. Watch for the SON litigation and LATAM/Africa restructuring charges to fade; that is what would let consolidated profit catch up with revenue.
4. India (standalone) volume growth. The domestic engine funds the dividend; underlying volume growth and margin here are the core signal.
5. FII vs DII flows. Whether foreign selling stabilises and domestic institutions keep absorbing stock will shape both the price and the yield.
6. Net-debt and short-term borrowings. A creeping rise in short-term debt to fund distributions would be an early warning on payout sustainability.
Conclusion
Godrej Consumer Products’ ₹5 interim for FY27 is, on its own, a well-covered payout — backed 3.6x by earnings, 4.9x by operating cash and 7.4x by liquidity. The more important picture is the policy behind it: after suspending dividends entirely for three years (FY21–FY23), GCPL has swung to a very high, cash-backed distribution running above 100% of profit. That generosity is real and funded by a strong India business and clean cash conversion, but it depends on operating cash flow staying near current levels and on overseas one-offs fading.
Positives
Strong operating cash (₹2,488 Cr, ~95% conversion); India PAT +12.2%; low net debt (~₹644 Cr); large liquidity (₹3,772 Cr); consistent, multiple-per-year payouts since resumption.
Negatives
Payout above earnings and FCF; flat consolidated profit; rising exceptional items; FII exodus; rich ~50x valuation; a proven willingness to cut dividends entirely.
This analysis presents positives, negatives, risks and monitoring factors so readers can form their own view. It contains no buy, sell or hold recommendation.
Frequently Asked Questions
What dividend has Godrej Consumer Products announced?
What is the dividend yield?
What is the record date?
What is the ex-date?
When will the dividend be paid?
Who is eligible for the dividend?
Does this interim dividend need AGM approval?
How is the dividend taxed?
Is the dividend sustainable?
What is GCPL’s dividend history?
Why did consolidated profit stay flat despite higher revenue?
How much of the dividend goes to promoters?
Has GCPL declared any other FY27 dividend?
What should investors monitor going forward?
Disclaimer
This article is published by ShareBazaar Online for informational and educational purposes only. It is not investment advice and contains no buy, sell or hold recommendation. ShareBazaar Online is not a SEBI-registered investment adviser or research analyst. All figures are drawn from Godrej Consumer Products Limited’s exchange filing dated 6 May 2026, its audited FY26 financial results, and publicly available data from Screener.in, BSE/NSE, TipRanks and INDmoney; some market data may have changed since publication. Market price and yield figures are price-dependent and should be re-verified against live quotes before use. Peer figures marked “Not Independently Verified” could not be confirmed from primary sources. Investors should consult a SEBI-registered financial adviser and read the company’s original filings before making any decision. ShareBazaar Online accepts no liability for actions taken based on this content.