
Dividend Snapshot
Somany Ceramics Limited (NSE: SOMANYCERA, BSE: 531548) has recommended a final dividend of ₹2 per equity share — a 100% payout on the ₹2 face value — for the financial year ended 31 March 2026.
This final dividend sits on top of a ₹4 per share interim dividend already paid earlier in the year. The total FY26 dividend therefore reaches ₹6 per share, up sharply from the ₹3 the company paid in each of the previous four years.
| Final Dividend | ₹2.00 / share (100%) |
| Interim (already paid) | ₹4.00 / share (200%) |
| Total FY26 Dividend | ₹6.00 / share |
| Face Value | ₹2.00 |
| Record Date | 5 Aug 2026 |
| AGM | 12 Aug 2026 |
| Final-Only Yield | ~0.39% |
| FY26 Total Yield | ~1.16% |
The one-line takeaway: the headline "100% dividend" sounds dramatic, but on a market price near ₹516 the final payout is worth only about 0.39% in yield. Somany is a growth-plus-modest-income stock, not an income play — and the more interesting story is that the payout is comfortably funded by cash the parent actually generates. Live price and yield must be re-checked at publish time.
Dividend Announcement Summary
At its meeting held on Friday, 15 May 2026, the Board of Directors of Somany Ceramics approved the audited standalone and consolidated results for the quarter and year ended 31 March 2026 and recommended a final dividend of ₹2 per share under Regulations 30 & 33(3) of SEBI (LODR). The recommendation is subject to shareholder approval at the 58th Annual General Meeting.
What else the Board approved that day:
• Appointment of Grant Thornton Bharat LLP as internal auditor for FY 2026-27.
• An investment of up to ₹8 crore in associate company Vintage Tiles Private Limited, in tranches, to fund a solar power plant and a manufacturing upgrade.
• The statutory auditor, Singhi & Co., issued an unmodified (clean) audit opinion on both standalone and consolidated results.
Why the "AGM approval pending" flag matters:
A final dividend is only a recommendation until shareholders vote it through at the AGM. Remote e-voting runs 7–11 August 2026, and the 58th AGM is scheduled for 12 August 2026 via video conferencing. Only after that vote does the ₹2 become a declared, payable dividend.
Key Dates Timeline
| Event | Date | Source / Basis |
|---|---|---|
| Board Recommendation | 15 May 2026 | Company filing |
| Record Date | 5 Aug 2026 (Wed) | Reg. 42 corporate-action intimation |
| Ex-Date | 5 Aug 2026 | Same as record date under T+1 settlement |
| E-Voting Window | 7–11 Aug 2026 | Company filing |
| 58th AGM | 12 Aug 2026 (Wed) | Company filing |
| Payment Date | By ~10 Sep 2026 | Within 30 days of AGM declaration (statutory outer limit) |
To be eligible, an investor must appear on the company's register on the record date, 5 August 2026. Because India settles trades on a T+1 basis, the ex-date and record date now fall on the same day — shares bought on or after 5 August 2026 do not carry the right to this final dividend. Publishers should confirm the exact payment date against the company's post-AGM intimation.
Dividend Yield Analysis
| Latest price (20 Jul 2026)* | ₹516.45 |
| Price on announcement (15 May 2026) | ~₹445.65 |
| Final-only yield @ ₹516 | 0.39% |
| FY26 total (₹6) yield @ ₹516 | 1.16% |
| Final-only yield @ announcement | 0.45% |
| FY26 total yield @ announcement | 1.35% |
*Live CMP must be re-verified at publish time; yield figures move with price.
Yield reality check
The "100%" headline refers to face value, not price. On the actual share price, the final dividend yields well under half a percent. Even counting the full ₹6 FY26 payout, the trailing yield is about 1.16% — below a bank savings rate.
The yield is low for a healthy reason, not a worrying one: the price sits far above face value and the company retains roughly 70% of profit to reinvest. This is a capital-appreciation stock with a small dividend attached, not a high-yield income holding.
Dividend History Analysis
| Financial Year | Dividend / Share | Pattern |
|---|---|---|
| FY2025-26 | ₹6.00 (₹4 interim + ₹2 final) | Doubled |
| FY2024-25 | ₹3.00 | Flat |
| FY2023-24 | ₹3.00 | Flat |
| FY2022-23 | ₹3.00 | Flat |
| FY2021-22 | ₹3.00 | Flat |
| FY2020-21 | ₹2.40 | — |
| FY2019-20 | ₹2.00 | — |
| FY2018-19 | ₹2.00 | — |
History compiled from public dividend records (TipRanks / Trendlyne). Amounts are on the current ₹2 face value. Not independently verified against every year's exchange circular.
Classification: Consistent Payer
Somany has paid a dividend every year shown, with no cuts or suspensions in the recent record. The payout was frozen at ₹3 for four straight years (FY22–FY25) — a period of soft demand and cost pressure — before the FY26 step-up.
The non-obvious point
FY26's ₹6 is a doubling of the four-year ₹3 run-rate. That is a genuine signal, but note the shape: ₹4 of it came as an interim declared after year-end (4 May 2026), with only ₹2 as the final. The board chose to front-load the reward rather than lift a single annual figure.
Financial Performance Analysis
| Consolidated (₹ crore) | FY2025-26 | FY2024-25 | Change |
|---|---|---|---|
| Revenue from operations | 2,789.84 | 2,658.76 | +4.93% |
| EBITDA | 257.44 | ~220.98 | +16.5% |
| Profit before tax | 108.65 | 85.21 | +27.5% |
| Net profit (group total) | 74.07 | 57.98 | +27.8% |
| Net profit (owners) | 81.19 | 60.07 | +35.2% |
| EPS (basic, consol) | ₹19.80 | ₹14.65 | +35.2% |
Operating leverage: margins did the work
Revenue grew only 4.9%, yet EBITDA rose 16.5% and profit far more. The driver is margin, not volume: EBITDA margin expanded from 8.31% to 9.23% (about +92 basis points) as cost pressures — power, fuel and raw material — eased through the year. This is the healthy kind of profit growth.
Two things the "+35%" headline hides
• The group's total profit grew 27.8%; the 35.2% figure is the owners' share, and it looks larger partly because loss-making subsidiaries pushed a bigger loss (₹7.12 cr) onto minority holders.
• Growth was operational, not tax-driven — the effective tax rate held near 32% in both years. Earnings quality here is clean.
A ₹5.22 crore exceptional loss (a one-time provision for gratuity and leave under the new Labour Codes) trimmed reported PBT; excluding it, pre-exceptional profit was ₹113.87 crore. It is a book provision, not a cash outflow that threatens the dividend.
Cash Flow Analysis
Reported profit is an opinion; cash is a fact. On the cash test, Somany looks stronger than its profit statement alone suggests.
| Operating cash flow (OCF), FY26 | ₹246.76 cr |
| Net profit (group) | ₹74.07 cr |
| OCF-to-profit conversion | 3.33x |
| Capex (PP&E + intangibles) | ₹55.61 cr |
| Free cash flow (OCF − capex) | ₹191.15 cr |
| Total FY26 dividend outflow | ₹24.61 cr |
Cash conversion is the standout
OCF of ₹246.76 crore is 3.3x the group's net profit — helped by a large release from receivables and payables during the year. Free cash flow of ₹191 crore dwarfs the entire ₹24.6 crore FY26 dividend.
How is the dividend funded?
Entirely from current-year free cash flow. The company is not dipping into reserves, selling assets or borrowing to pay shareholders. FCF covers the payout roughly 7.8x over, leaving ample room for reinvestment and debt reduction.
Standalone lens: the parent alone generated ₹169.29 crore OCF and about ₹130 crore free cash flow. Since the dividend is legally paid by the parent, this standalone cushion is what ultimately backs the ₹2 cheque.
Balance Sheet Strength
| Cash, bank & current investments | ₹159.84 cr |
| Gross borrowings | ₹251.26 cr |
| Net debt (ex-leases) | ₹91.42 cr |
| Net debt / equity (ex-leases) | 0.10x |
| Total equity | ₹919.89 cr |
| Book value / share (owners) | ~₹205 |
A lightly-levered, cash-cushioned balance sheet
Net debt excluding lease liabilities is a modest ₹91 crore against ₹920 crore of equity — a 0.10x net gearing. Including lease liabilities, the company reports net debt-to-equity of about 0.30x, still comfortable. CRISIL rates the company AA/Stable (long-term) and A1 (short-term), an investment-grade profile.
Returns are moderate rather than spectacular: computed ROE ~9.6–10% and ROCE ~13% for FY26 (external trackers cite ROE ~7.8% and ROCE ~11.8% on differing bases).
Dividend Sustainability Analysis
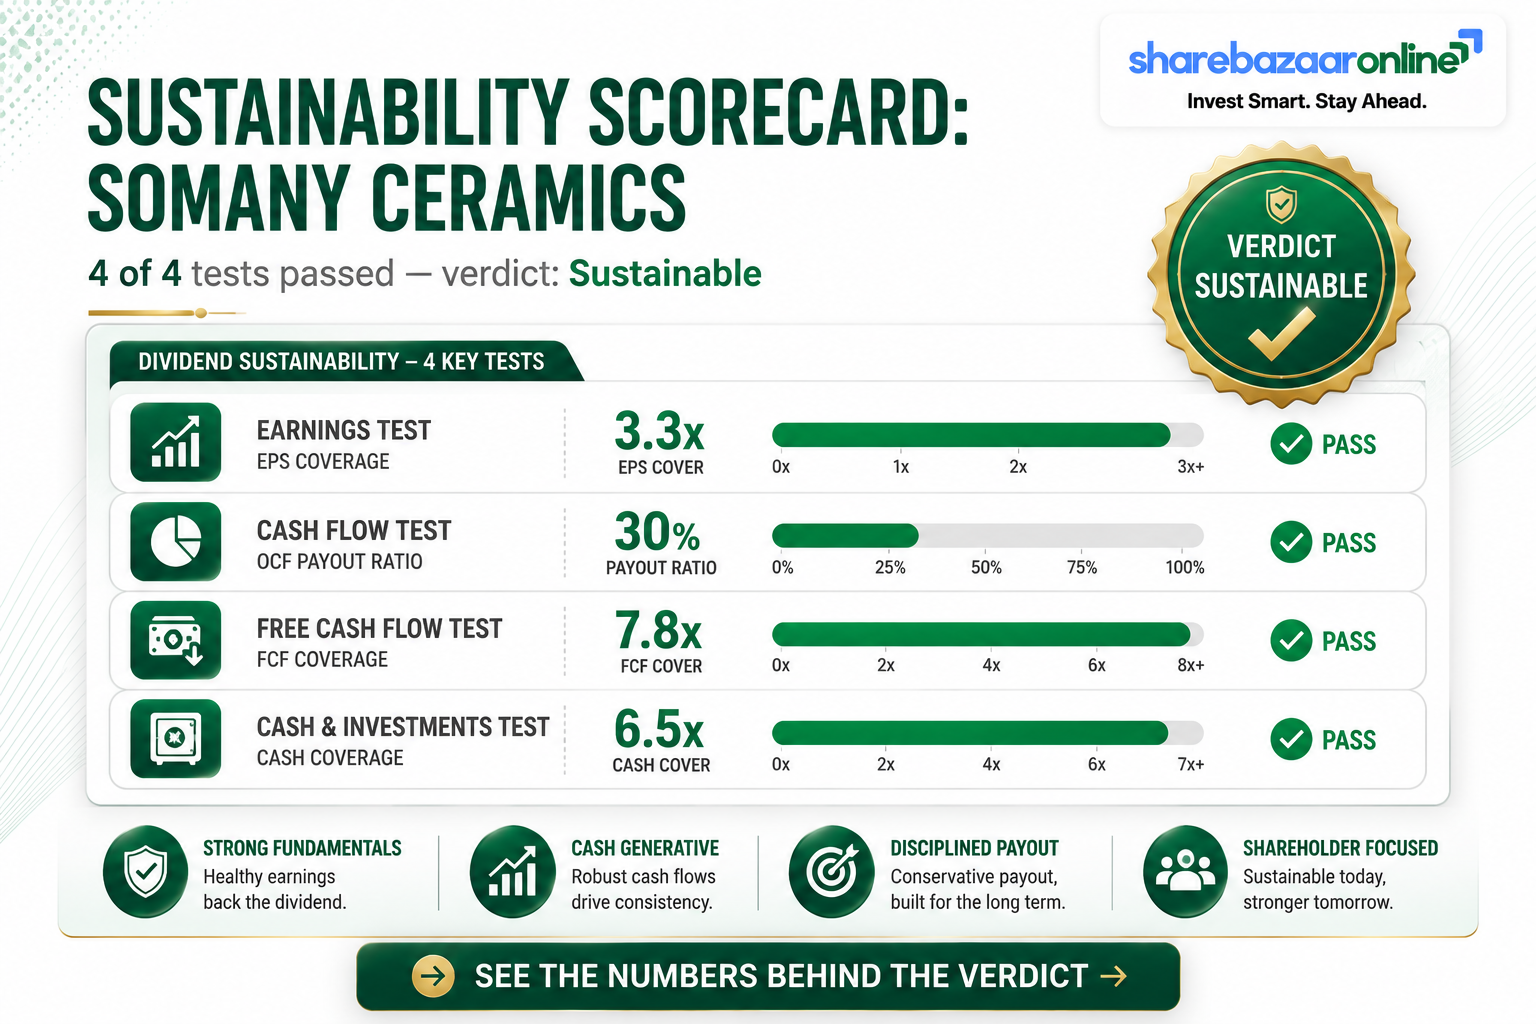
| Sustainability Test | Reading | Verdict |
|---|---|---|
| Earnings coverage (EPS ₹19.80 vs ₹6 DPS) | 3.30x | Strong |
| Payout ratio (total FY26) | 30.3% | Conservative |
| FCF coverage (₹191 cr vs ₹24.6 cr) | 7.77x | Strong |
| Cash coverage (₹159.84 cr vs ₹24.6 cr) | 6.50x | Strong |
Overall verdict: Sustainable. All four tests pass with room to spare. A 30% payout covered 3.3x by earnings and 7.8x by free cash flow means Somany could raise the dividend materially without straining the balance sheet. The chief watch flag is not affordability but demand cyclicality — tile volumes track real estate and construction, so earnings (and therefore the base for future increases) can wobble year to year.
Peer Comparison
| Metric | Somany | Kajaria | Cera |
|---|---|---|---|
| FY dividend / share | ₹6 | ~₹12–17 | ~₹65 |
| Dividend yield | ~1.16% | ~0.8% | ~1.1–1.2% |
| Payout ratio | ~30% | ~42–46% | ~33–41% |
| ROE | ~10% | ~18% | |
| ROCE | ~13% | ~36% | |
| P/E (approx) | ~22–26 | ~39 | ~29–30 |
Peer figures from public trackers; blank cells indicate data not verified from a primary source at time of writing. Not independently verified.
Somany sits in the middle of its peer set: a lower payout and lower absolute returns than Cera (a much higher-margin, higher-ROCE business) but the cheapest valuation of the three on P/E. Its yield is broadly comparable to Kajaria and Cera — none of these tile/bathware names is a genuine high-yield stock; all three retain most of their earnings for growth.
Promoter Impact Analysis
| Promoter holding | 55.19% |
| FII holding | 1.33% |
| DII holding | 21.63% |
| Public / others | ~21.85% |
| Promoter share of final ₹2 | ₹4.53 cr |
| Promoter share of FY26 ₹6 | ₹13.58 cr |
Shareholding from latest public pattern; not independently verified.
Who benefits, and is it fair?
Of the total ₹24.61 crore FY26 payout, the Somany promoter family receives about ₹13.58 crore by virtue of its 55% stake; the ₹2 final alone sends roughly ₹4.53 crore their way. The remaining ~45% (₹11 crore) flows to institutions and public shareholders on identical per-share terms.
Because the payout is funded by free cash flow and the ratio is conservative, this is a balanced distribution rather than a promoter cash-extraction event — minority holders are treated pari passu.
Taxation Analysis
Since April 2020, dividends are taxed in the hands of the investor at their applicable income-tax slab rate. Key rules:
• The full dividend is added to "Income from Other Sources" and taxed at your slab rate.
• The company deducts TDS at 10% under Section 194 if your total dividend from that company in the year exceeds ₹5,000 (10% for FY26; a 5,000 threshold applies). No TDS below that limit.
• TDS is 20% (or DTAA rate) if PAN is not furnished / for certain non-residents. Investors below the taxable limit can file Form 15G/15H to avoid TDS.
Worked example — retail investor holding 1,000 shares
| Item | Final only (₹2) | Full FY26 (₹6) |
|---|---|---|
| Gross dividend | ₹2,000 | ₹6,000 |
| TDS @10% (if > ₹5,000/yr) | Nil* | ₹600 |
| Tax at 30% slab | ₹600 | ₹1,800 |
| Net in hand (30% slab) | ₹1,400 | ₹4,200 |
*The ₹2,000 final alone is below the ₹5,000 TDS threshold, so no TDS on that payment in isolation; the ₹6,000 full-year figure crosses it. Final tax always equals the slab liability regardless of TDS; TDS is only an advance. Illustrative only — not tax advice.
Key Risks
• Demand cyclicality: tile and sanitaryware volumes track real estate and construction activity; a housing slowdown directly hits revenue and, with it, future dividend capacity.
• Energy cost volatility: power and fuel are among the largest expense lines. The company has flagged restricted gas supply at its Kassar (Haryana) plant following revised regulations — a live margin risk after the FY26 margin recovery.
• Morbi / import competition: intense pricing pressure from unorganised Morbi (Gujarat) manufacturers and cheaper imports can cap realisations.
• Subsidiary drag: standalone profit (₹99 cr) exceeds consolidated owners' profit (₹81 cr); loss-making subsidiaries dilute group returns, and several restructuring/amalgamation moves are still in progress before the NCLT.
• AGM approval risk: the ₹2 final dividend is not payable until shareholders approve it at the 12 August 2026 AGM.
• Working-capital reversal: FY26 cash flow was flattered by a favourable working-capital swing; a reversal would lower next year's OCF even if profit holds.
What To Monitor
• EBITDA margin trend: whether the ~92 bps FY26 margin gain holds or reverses as energy costs move — this, not revenue, drives profit here.
• Kassar gas-supply situation: resolution or escalation of the restricted-gas issue and any production/cost impact.
• Subsidiary amalgamation: completion of the NCLT-approved merger of Somany Bathware, Excel Vitrified and SR Continental into the parent, and whether it lifts consolidated returns.
• Payout policy signal: whether the FY26 doubling to ₹6 becomes the new base or was a one-off catch-up after four flat years.
• Working-capital and FCF: whether free cash flow stays strong once the FY26 working-capital release normalises.
• Capex & capital allocation: the pace of investment into associates (Vintage Tiles, Siravit) versus buybacks or higher dividends.
Conclusion
Positives: Somany's ₹2 final dividend caps an FY26 payout that doubled to ₹6, funded entirely by free cash flow, covered 3.3x by earnings and ~7.8x by FCF, on a conservative 30% payout and a lightly-geared, investment-grade balance sheet. Profit growth was operational and clean, not tax- or one-off-driven.
Negatives / caveats: the actual yield is small (final ~0.39%, full-year ~1.16%), returns are only moderate (ROE ~10%), loss-making subsidiaries drag the consolidated picture below standalone, and the final dividend still awaits AGM approval. Energy-cost and demand cyclicality remain the key swing factors.
In short, this is a financially comfortable, well-covered dividend from a mid-cap tile major — best understood as a modest income kicker on a growth-and-value stock rather than a reason to own it for yield. The figures above are for information only; readers should weigh the positives, negatives and risks and reach their own conclusions.
Frequently Asked Questions
What dividend has Somany Ceramics announced?
What is the dividend yield?
What is the record date for the final dividend?
What is the ex-date?
When will the dividend be paid?
Who is eligible for the dividend?
How is the dividend taxed?
Is the dividend sustainable?
What is Somany Ceramics' dividend history?
Why is the reported profit up 35% when revenue rose only 5%?
How much does the dividend cost the company, and how much goes to promoters?
What should investors monitor from here?
Disclaimer
This article is published by ShareBazaar Online for informational and educational purposes only and does not constitute investment, financial, legal or tax advice, nor a recommendation to buy, sell or hold any security. ShareBazaar Online is not a SEBI-registered investment adviser. Dividend recommendations are subject to shareholder approval and may change; the final dividend discussed here awaits approval at the 58th AGM. Market price, yield and date figures are time-sensitive and must be independently re-verified at the time of reading — live CMP and the exact payment date in particular. Certain figures are computed or inferred from primary filings and public data sources and are labelled where not independently verified. Investors should consult a qualified financial adviser and read the company's official exchange filings before making any decision. Past dividend behaviour is not a guarantee of future payments.