
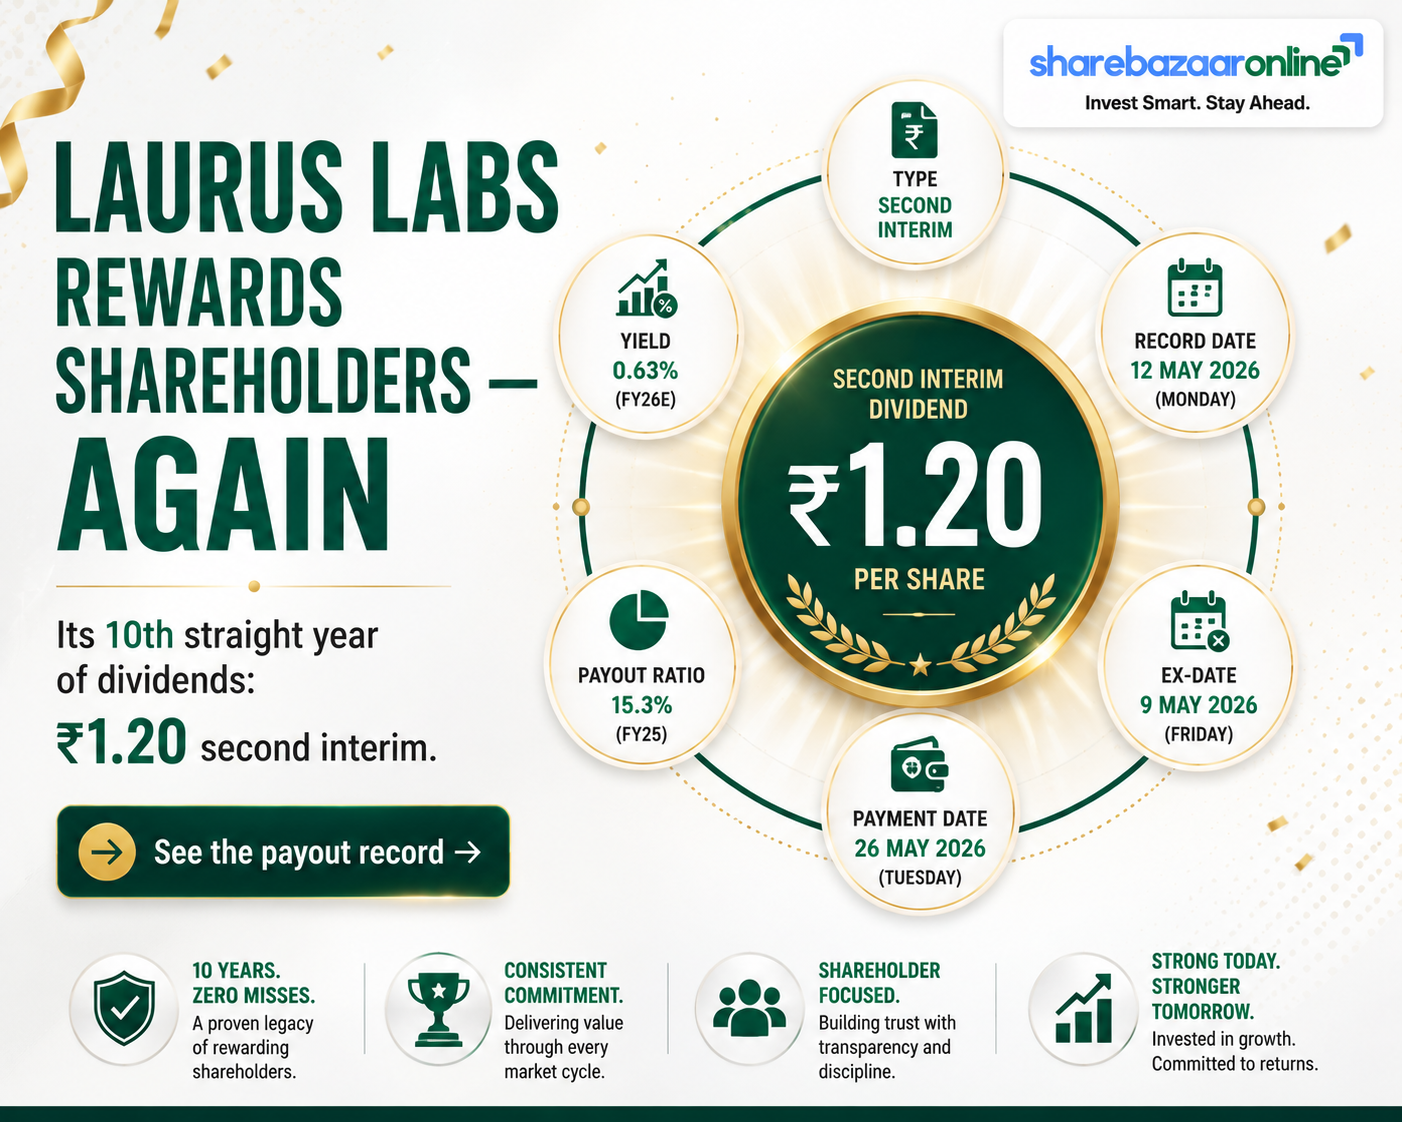
Dividend Snapshot
Company
Laurus Labs Limited
NSE: LAURUSLABS | BSE: 540222 | ISIN: INE947Q01028
Sector: Pharmaceuticals & Biotechnology (API / CDMO / FDF)
The Announcement
2nd Interim Dividend — ₹1.20 / share
60% of face value of ₹2, for FY 2025–26
Total FY26 dividend so far: ₹2.00 (₹0.80 first interim + ₹1.20 second interim)
Key Numbers
₹1.20
60%
08 May 2026
On/after 20 May 2026
₹1,835
~0.11%
CMP source: Screener.in (05 Aug 2026 close). Re-verify at publish; yield is price-sensitive.
Our One-Line Read
Laurus is a consistent but low-yield payer. The FY26 dividend is comfortably affordable (covered ~8x by earnings, ~15x by operating cash), yet the payout ratio has fallen to 12% from 27% two years ago — management is channelling a profit surge into a large capex cycle rather than into distributions. The headline yield looks tiny mainly because the share price has roughly doubled in a year.
Dividend Announcement Summary
On 30 April 2026, the Board of Directors of Laurus Labs, at a meeting held from 2:00 p.m. to 3:00 p.m., approved a Second Interim Dividend of ₹1.20 per equity share (60%) on shares of ₹2 face value, for the financial year 2025–26. The declaration was made alongside the company’s Q4 & full-year FY26 results.
What the filing states
- Record date fixed under Regulation 42 of SEBI LODR as 08 May 2026.
- Dividend to be paid on or after 20 May 2026.
- This is the second interim for FY26; a first interim of ₹0.80 was paid in November 2025.
Approval mechanics (important nuance)
Because this is an interim dividend, it is declared and paid on the strength of the Board’s approval alone — it does not require prior shareholder approval at the AGM (unlike a final dividend). Interim dividends are typically noted/ratified at the subsequent AGM, which the company has scheduled for 02 July 2026.
Key Dates Timeline
Under India’s T+1 settlement, the ex-date and record date coincide (both 08 May 2026), consistent with the company’s previous interim (ex/record 31 Oct 2025). To be eligible, an investor must hold shares as of the record date. Ex/record and payment dates verified against corporate-action trackers; confirm against the exchange circular before publishing.
Dividend Yield Analysis
Yield, three ways
| ₹1.20 on CMP ₹1,835 | 0.065% |
| ₹1.20 on announcement price (≈₹1,078) | 0.111% |
| FY26 total ₹2.00 on CMP ₹1,835 | 0.109% |
| FY26 total ₹2.00 on announcement price | 0.186% |
Announcement-day (30 Apr 2026) price is approximate — inferred from the +5.8% move to ₹1,141 on the next trading day (04 May 2026, with 01 May a market holiday). Not independently verified to the paisa.
Yield Reality Check — why it’s so low
This is a low yield born of strength, not weakness. The number is small because the share price roughly doubled in a year (up ~78–114% over 12 months, from a 52-week low of ₹810 to a high of ₹1,859), while the dividend rose only modestly. It is the opposite of a “value-trap” high yield created by a collapsing price. Anyone buying Laurus for dividend income is, in effect, paying ~₹1,835 to receive ₹2.00 a year — the thesis here is capital appreciation and reinvestment, not yield.
Dividend History Analysis
Per-share dividend & payout (face value ₹2)
| Financial Year | Total DPS | EPS | Payout % |
|---|---|---|---|
| FY2021–22 | ₹2.00 | ₹15.40 | ~13% |
| FY2022–23 | ₹2.00 | ₹14.67 | ~14% |
| FY2023–24 | ₹0.80 | ₹2.98 | ~27% |
| FY2024–25 | ₹1.60 | ₹6.64 | ~24% |
| FY2025–26 | ₹2.00 | ₹16.46 | ~12% |
Payout % computed as total DPS ÷ EPS from Screener.in consolidated data. Intra-year splits (interim vs final) vary year to year; figures shown are full-year totals on the current ₹2 face value. Earlier years pre-date the face-value split and are not directly comparable.
Classification: Consistent Payer
Laurus has paid a dividend every year for the past decade and now distributes semi-annually (typically one interim around October/November and a second around April/May). There have been no suspensions. The absolute DPS has trended up over ten years (from roughly ₹0.30 to ₹2.00).
The non-obvious signal
Notice the payout ratio falling as profits rise: 27% (FY24) → 24% (FY25) → 12% (FY26). In FY24, when profits were at a trough, the company held the dividend steady, pushing payout up; in FY26, with profits surging, it raised DPS only slightly, pushing payout down. The message: Laurus smooths its dividend and retains the upside for reinvestment.
Financial Performance Analysis
Consolidated results (₹ Crore)
| Metric | FY24 | FY25 | FY26 | YoY (FY26) |
|---|---|---|---|---|
| Revenue | 5,041 | 5,554 | 6,813 | +22.7% |
| EBITDA | — | ~1,113 | 1,826 | +64% |
| EBITDA margin | ~15% | ~20% | 26.8% | +~6.8 pts |
| Net Profit (PAT) | 161 | 358 | 889 | +148% |
| EPS (₹) | 2.98 | 6.64 | 16.46 | +148% |
Source: Screener.in consolidated / company results. FY25 EBITDA is approximate (derived from the disclosed +64% FY26 growth).
Operating leverage is real — and margin-led
Revenue up 22.7%, EBITDA up 64%, PAT up 148% — a textbook operating-leverage cascade. The engine is margin expansion: gross margin improved by over 5 points to ~60.4% on a richer CDMO mix, lifting EBITDA margin from the high-teens to 26.8%. The CDMO (contract development/manufacturing) segment rebounded sharply after a soft patch.
Read the 148% with care (base effect + one-offs)
The eye-catching +148% PAT is amplified by a low base: FY24 was a trough year (PAT just ₹161 Cr). Also, the prior-year FY25 EBITDA included a one-time gain of ~₹59 Cr from a land-parcel sale (about ₹0.9 of EPS), which flatters the comparison base in some line items. The underlying business genuinely improved — but the growth rate overstates the run-rate step-up.
Cash Flow Analysis
Cash generation (₹ Crore, consolidated)
| Metric | FY24 | FY25 | FY26 |
|---|---|---|---|
| Operating Cash Flow (OCF) | 666 | 602 | 1,624 |
| Free Cash Flow (FCF) | -10 | 61 | 560 |
| OCF as % of operating profit | 99% | 70% | 107% |
FY26 cash quality is excellent…
This is the standout. FY26 OCF of ₹1,624 Cr is 1.83x reported PAT and 107% of operating profit — meaning the profit is backed by real cash, not accruals. Even after heavy investing outflow (~₹1,086 Cr of capex/investments), the company still threw off ₹560 Cr of free cash. The ₹108 Cr full-year dividend is a rounding error against this — funded entirely from current-year operating cash, not reserves, asset sales, or borrowings.
…but it’s a very recent phenomenon
Context matters. In FY24, FCF was negative (-₹10 Cr), and in FY25 it was a thin ₹61 Cr — during those heavy-capex years the dividend was effectively funded on razor-thin free cash. The FY26 leap is driven by both the profit jump and a strong working-capital release. Investors should watch whether this FCF strength persists once the next capex wave begins, rather than assuming it is now structural.
Balance Sheet Strength
Position (Mar 2026, ₹ Crore)
2,518
2,171
~347
5,192
₹98.2
18.3% / 17.8%
Interpretation
Laurus carries net debt of ~₹2,171 Cr, but it is falling (from ~₹2,405 Cr a year earlier) and modest against ₹5,300 Cr of net worth. Returns have recovered strongly: ROCE back to 17.8% and ROE to 18.3% from the single-digit trough of FY24–FY25. One efficiency drag remains: a heavy cash-conversion cycle of ~263 days (inventory ~317 days), which ties up working capital — though it improved from ~276 days in FY25.
Capital-allocation note: a purist could argue the ₹108 Cr paid out could instead have trimmed net debt. In practice the sum is immaterial to the debt profile, and the company is simultaneously reducing borrowings and paying a token dividend while gearing up for a large capex programme — a balanced stance rather than an aggressive one.
Dividend Sustainability Analysis
Four-test scorecard (FY26 total dividend ₹108 Cr)
| Test | Coverage | Verdict |
|---|---|---|
| Earnings (EPS ÷ DPS) | 8.2x | Strong |
| Operating cash (OCF ÷ dividend) | 15.0x | Strong |
| Free cash (FCF ÷ dividend) | 5.2x | Strong (FY26) |
| Balance-sheet cash (Cash+Inv ÷ dividend) | 6.1x | Strong |
Verdict: Sustainable
On every test, the dividend is easily affordable. At a 12% payout, Laurus could multiply its distribution several times over and still stay well within earnings and cash generation. There is no sustainability risk to the current small dividend.
Watch flags
- FCF coverage is only recently comfortable — it was thin/negative in FY24–FY25.
- A large capex cycle (Vizag, >$600mn over 8 years, starting end-FY27) could pressure free cash again.
- Do not confuse “affordable” with “growing fast” — management is choosing to keep the dividend small.
Peer Comparison
| Company | Div Yield | Payout | ROE | ROCE |
|---|---|---|---|---|
| Laurus Labs | ~0.11% | ~12% | 18.3% | 17.8% |
| Divi’s Laboratories | ~0.46% | ~36% | 17.9% | — |
| Aurobindo Pharma | ~0.25% | ~7% | ~13% | — |
| Sector (Pharma) median | ~0.4–0.8% | — | — | — |
Peer figures compiled from public trackers (Screener/SimplyWallSt/Investing.com) and rounded; cells left blank where a value could not be verified from a primary source. Yields are point-in-time and price-sensitive.
Takeaway: Laurus sits at the low end of an already low-yield cohort. Even “dividend-friendly” Divi’s yields under half a percent. Laurus’ 12% payout is the lowest among these names — but its ROE/ROCE (18%) is at the top, which is the more relevant fact: high-return businesses often (rationally) retain more and pay less. The pharma/CDMO space is a growth-and-compounding sector, not an income sector.
Promoter Impact Analysis
Who receives the ₹108 Cr (FY26)
| Promoters (27.47%) | ₹29.7 Cr |
| FIIs (28.00%) | ₹30.2 Cr |
| DIIs (13.73%) | ₹14.8 Cr |
| Public (30.79%) | ₹33.3 Cr |
Of the ₹1.20 second interim alone, promoters receive ~₹17.8 Cr. Shareholding as of Jun 2026 (Screener.in).
Distribution read
Promoter holding is stable at ~27.5% and has barely moved for two years. Notably, FII holding (28%) now exceeds promoter holding — and DIIs hold another ~14% — so ~42% of the payout flows to institutions and only ~28% to the family. The dividend is not a promoter-skewed extraction; minority and institutional shareholders receive the majority of it, proportionate to a genuinely diversified register.
Taxation Analysis
Since April 2020, dividends are taxed in the hands of the shareholder at their applicable income-tax slab rate (the earlier Dividend Distribution Tax was abolished). The company deducts TDS under Section 194 at 10% only if a resident individual’s total dividend from that company in a financial year exceeds ₹5,000 (submit Form 15G/15H to avoid TDS if income is below the taxable limit; NRIs face 20% TDS, subject to DTAA relief).
Worked example — 1,000 shares, 30% slab
| Gross dividend (1,000 × ₹1.20) | ₹1,200 |
| TDS u/s 194 (below ₹5,000 threshold) | ₹0 |
| Tax at 30% slab (+ cess) | ₹360 |
| Net in hand | ₹840 |
Cess of 4% on the tax is ignored for simplicity. Post-tax effective yield on a ₹1,835 share ≈ 0.046%.
Full-year context
On the full FY26 dividend of ₹2.00, the same 1,000-share holder receives ₹2,000 gross — still below the ₹5,000 TDS threshold, so no tax is withheld at source; the holder self-reports and pays ₹600 (at 30%), keeping ₹1,400. For most retail holders of Laurus, the dividend is tax-thin because it is cash-thin — the return case rests on the share price, which is taxed as capital gains only when sold.
Key Risks
- Valuation risk. At ~₹1,835 the stock trades at a trailing P/E of ~90x (and ~111x on FY26 reported EPS) and ~18.7x book. A large share of future growth is already priced in; several analysts carry “Hold”/“Underperform” ratings with targets well below the market price. Any earnings miss can de-rate the stock sharply — and would shrink the (already small) yield further.
- CDMO lumpiness. The margin surge is driven by a favourable CDMO mix and a recovery in that segment. CDMO revenue is project-based and can be lumpy quarter to quarter; a slowdown in milestone deliveries could compress the recently expanded margins.
- Concentration in antiretrovirals (ARV). A significant part of the API/FDF book is ARV-linked and exposed to tender-driven pricing (e.g. Global Fund) and volume swings, which have historically caused earnings volatility.
- Heavy upcoming capex. The >$600mn, 8-year Vizag investment (capex from end-FY27) could pressure free cash flow and net debt during the build-out, echoing the thin-FCF years of FY24–FY25.
- Working-capital intensity & forex/regulatory exposure. A ~263-day cash-conversion cycle ties up capital, and as a global exporter with USFDA-approved plants, Laurus is exposed to currency swings and regulatory-inspection outcomes.
What To Monitor
- CDMO order book & segment revenue share — the durability of the margin re-rating hinges on repeat/growth projects converting to revenue.
- EBITDA margin trajectory — whether ~27% holds or was a mix-driven peak. Watch gross margin around the 60% mark.
- Free cash flow through the Vizag capex cycle — does FCF stay positive once the >$600mn programme begins spending near end-FY27?
- Net debt trend — continued reduction (from ~₹2,171 Cr) vs. re-leveraging to fund capex.
- Payout policy signal — whether management lifts the payout ratio back toward the mid-20s% or keeps it near 12% (a tell on its reinvestment confidence).
- Working-capital cycle — further improvement from ~263 days would materially strengthen cash conversion.
Conclusion
Laurus Labs’ second interim dividend of ₹1.20 takes its FY26 payout to ₹2.00 per share — a distribution that is utterly secure (covered ~8x by earnings and ~15x by operating cash) but deliberately modest, at just a 12% payout even after a 148% jump in profit. The ~0.11% yield is low not because the business is weak, but because the share price has roughly doubled and management is retaining the profit surge to fund a multi-year, >$600mn capacity build-out.
Positives
- Consistent 10-year payer; no cuts or suspensions.
- Exceptional FY26 cash conversion (OCF 1.83x PAT).
- Sharp margin and return-ratio recovery (ROE/ROCE ~18%).
- Falling net debt; institutionally well-held.
Negatives / caveats
- Yield is negligible — not an income stock.
- 148% PAT growth flattered by a low base & prior one-offs.
- Rich valuation (~90x P/E) leaves little margin for error.
- FCF strength is recent; capex cycle looms.
In short: a high-quality compounder that happens to pay a token dividend. We present the positives, negatives, risks and monitoring factors above so readers can form their own view.
Frequently Asked Questions
What dividend has Laurus Labs announced?
What is the dividend yield?
What is the record date?
What is the ex-date?
When will the dividend be paid?
Who is eligible to receive it?
How is this dividend taxed?
Is the dividend sustainable?
Does an interim dividend need AGM approval?
What is Laurus Labs’ dividend history?
Why is the payout ratio falling if profits are rising?
Should I buy Laurus Labs for its dividend?
What should investors monitor going forward?
Disclaimer
This article is for informational and educational purposes only and does not constitute investment, financial, legal or tax advice, nor a recommendation to buy, sell or hold any security. ShareBazaar Online is not a SEBI-registered investment adviser. Figures are compiled from company filings and public sources (including Screener.in, exchange disclosures and corporate-action trackers) and may contain errors or become outdated; the current market price and dividend dates must be re-verified before acting. Certain figures are labelled approximate or inferred where they could not be independently verified. Investments in securities are subject to market risks; past performance is not indicative of future results. Please consult a SEBI-registered financial adviser before making any investment decision.