
Dividend Snapshot
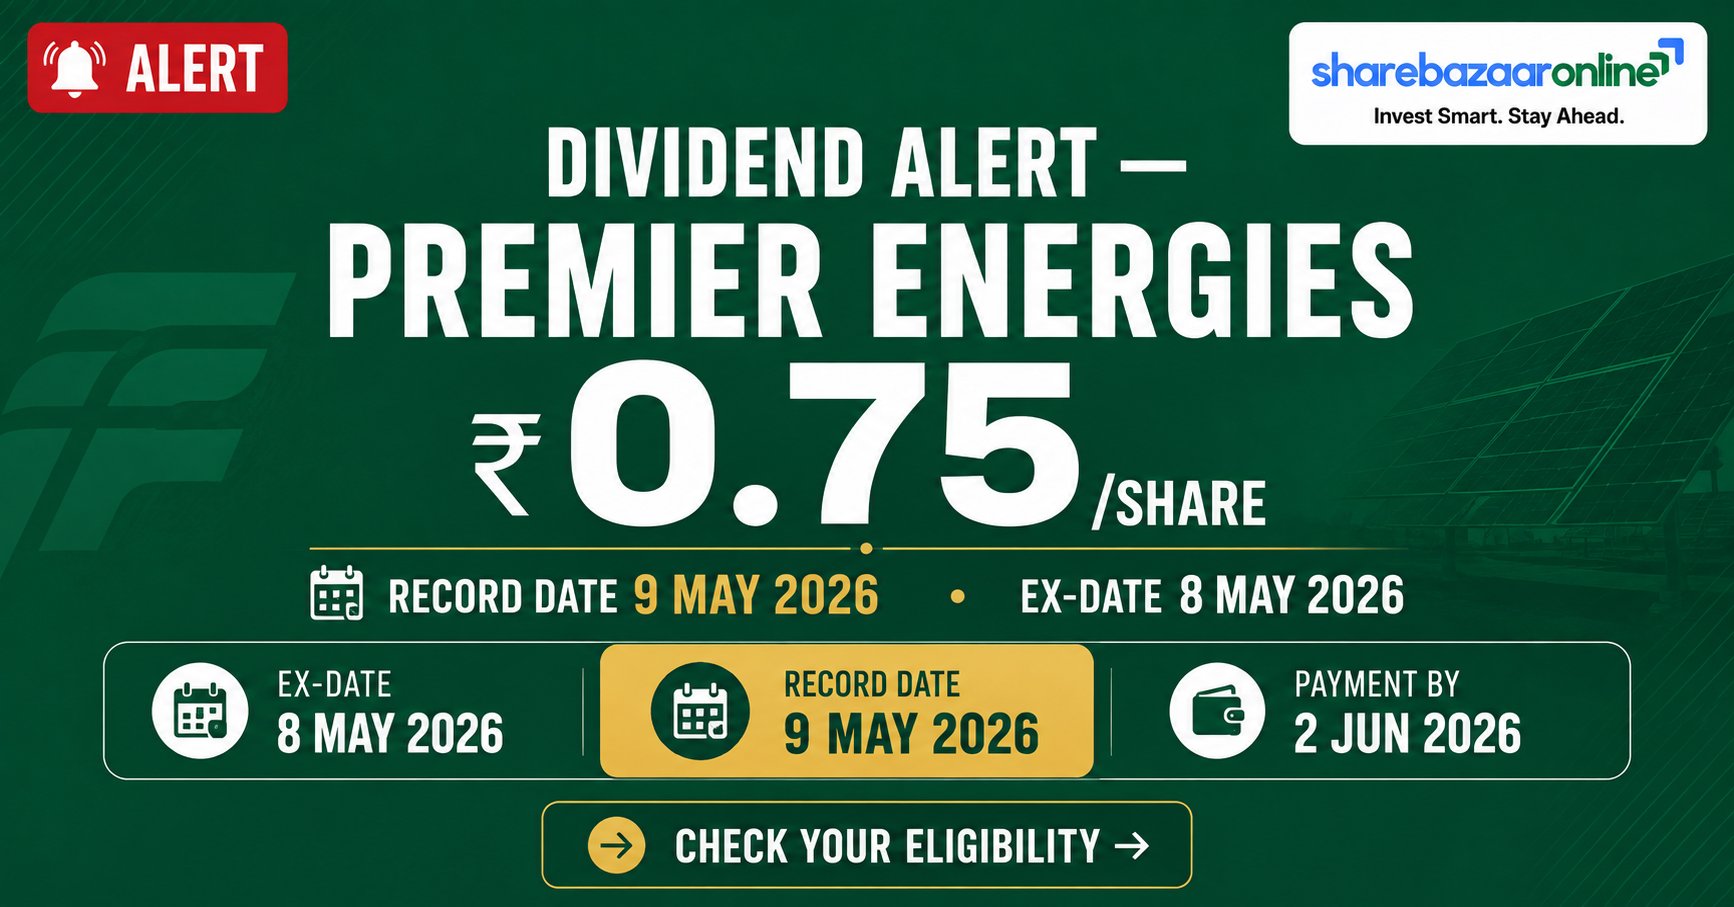
Premier Energies Limited — one of India's largest integrated solar cell and module makers — has declared its 2nd Interim Dividend of Rs 0.75 per equity share (75% of Re 1 face value) for FY2025-26. Combined with the Rs 0.25 first interim already paid, the full-year interim payout is Rs 1.00 per share. This is a token, growth-stage payout: the yield is only about 0.10% and the company retains roughly 97% of its profit to fund a large capacity build-out.
Key Facts
- CompanyPremier Energies Ltd
- NSE / BSEPREMIERENE / 544238
- Dividend Type2nd Interim (FY26)
- Dividend / ShareRs 0.75 (75%)
- Face ValueRs 1.00
- FY26 Total InterimRs 1.00 / share
At a Glance
- Announcement04-May-2026
- Record Date09-May-2026 (Sat)
- Ex-Date08-May-2026
- Payment ByOn/before 02-Jun-2026
- Yield (TTM Re 1)~0.10%
- Payer TypeEarly-Stage
Prices & ratios sourced from exchange filing (BSE/NSE) and Screener.in consolidated data. CMP of ~Rs 1,035 as on 04-Aug-2026. Live CMP must be re-verified at publish time — yields move with price.
Dividend Announcement Summary
At its Board Meeting held on 4 May 2026, the Board of Premier Energies Limited, under Regulation 43 of SEBI (LODR) Regulations, declared a second interim dividend of Rs 0.75 per equity share for the financial year 2025-26. The Board also fixed Saturday, 9 May 2026 as the Record Date (under Regulation 42) to identify eligible shareholders. Payment is to be made on or before 2 June 2026.
Board-Approved, No AGM Needed
Because this is an interim dividend (not a final dividend), it is fully approved by the Board and does not require shareholder approval at an AGM. There is no "subject to approval" caveat — payment proceeds directly to eligible holders.
A Notable Sequencing Detail
The dividend was declared on 4 May 2026, but the company's audited FY26 results were only approved on 15 May 2026. The Board therefore committed the cash outflow before signing off the full-year audited accounts — a detail wire coverage rarely flags.
Key Dates Timeline
Announcement Date
04 May 2026
Board meeting; dividend declared (Reg 43).
Ex-Date
08 May 2026
Last day to buy for eligibility is 7 May 2026; from the ex-date the stock trades without the dividend right. Confirmed by market data providers; verify against the exchange corporate-action circular.
Record Date
09 May 2026
Register of members checked (a Saturday); holders on record are eligible.
Payment Date
By 02 Jun 2026
Statutory outer limit stated by company; exact credit date not separately disclosed.
Note: The record date falls on a Saturday. The ex-date (8 May 2026) is the last trading day before it, consistent with T+1 settlement. Always confirm against the NSE/BSE corporate-action circular.
Dividend Yield Analysis
Dividend yield tells you how much cash income a share throws off relative to its price. For Premier Energies, the number is deliberately tiny — this is a growth stock, not an income stock.
On This Rs 0.75 Tranche
0.07%
Rs 0.75 ÷ CMP ~Rs 1,035. On announcement-day close (Rs 1,034.60, BSE) the figure is the same at 0.07%.
On Full FY26 Payout (Rs 1.00)
0.10%
Rs 1.00 ÷ CMP ~Rs 1,035. This is the trailing-twelve-month yield most data sites display.
Yield Reality Check
A ~0.10% yield is not a sign of weakness or a falling price — it reflects a conscious capital-allocation choice. Premier's earnings are compounding fast (FY26 EPS Rs 33.33), but management is channelling almost all of that into new cell and module capacity. The dividend is a symbolic signal of confidence, not a cash-return stream. Income-focused investors will find far higher yields elsewhere; the broad market's top quartile yields over 1%.
Dividend History Analysis
| Financial Year | Type | Rs / Share | FY Total |
|---|---|---|---|
| FY2024-25 | Interim | Rs 0.50 | Rs 0.50 |
| FY2025-26 | 1st Interim | Rs 0.25 | Rs 1.00 |
| FY2025-26 | 2nd Interim | Rs 0.75 |
FY26 amounts are company-confirmed. FY25 amount is per market data providers (Not Independently Verified against the original exchange circular). Earlier record/ex-dates across aggregators show minor inconsistencies.
Classification: Early-Stage Payer
Premier Energies listed only in September 2024 and paid its first-ever dividend in FY25. With just two years of history, it cannot yet be called a "Consistent Payer." The trend, however, is upward — from Rs 0.50 (FY25) to Rs 1.00 (FY26), a doubling. There have been no cuts or suspensions, but the track record is too short to project reliability. Treat it as a growing but unproven dividend, not an established one.
Financial Performance Analysis
| Rs Cr (Consolidated) | FY24 | FY25 | FY26 | YoY |
|---|---|---|---|---|
| Revenue | 3,144 | 6,519 | 7,824 | +20.0% |
| EBITDA (Op. Profit) | 478 | 1,781 | 2,377 | +33.5% |
| Net Profit (PAT) | 231 | 937 | 1,510 | +61.2% |
| EPS (Rs) | 8.78 | 20.79 | 33.33 | +60.3% |
| OPM % | 15% | 27.3% | 30.4% | +310 bps |
Operating Leverage: Profit Outrunning Sales — The Right Way
Here is the non-obvious point. Revenue rose +20%, but PAT jumped +61% — three times faster. This is healthy operating leverage, driven by two things: operating margin expanded from 27.3% to 30.4% (a solar-cycle sweet spot for integrated makers), and depreciation actually fell (Rs 498 Cr → Rs 452 Cr) even as the asset base grew. Interest cost also eased (Rs 177 Cr → Rs 158 Cr). So the profit surge is operational and structural, not a one-off tax or treasury gain — the FY26 effective tax rate (~23%) was broadly stable versus FY25 (~24%). This is a materially higher-quality earnings jump than headline growth alone suggests.
Cash Flow Analysis
Reported profit is an opinion; cash is a fact. And on cash, Premier Energies tells a more complicated story than its profit line — this is the single most important thing wire coverage misses.
Operating Cash Flow
Rs 1,261 Cr
FY26 OCF vs PAT of Rs 1,510 Cr — a cash-conversion of ~70% of operating profit. Solid, but slipped from FY25's Rs 1,348 Cr as working capital absorbed cash.
Free Cash Flow
– Rs 1,736 Cr
FY26 FCF swung deeply negative — reversing FY25's positive Rs 728 Cr — as capex exploded (CWIP jumped from Rs 242 Cr to Rs 2,144 Cr).
So How Is the Dividend Funded?
The dividend outflow is tiny — roughly Rs 34 Cr for this Rs 0.75 tranche and ~Rs 45 Cr for the full FY26 Re 1.00 — against Rs 1,261 Cr of operating cash. On an earnings and operating-cash basis it is trivially affordable. But on a free-cash basis the company is a net cash consumer: after Rs 2,156 Cr of investing outflow, the group relied on Rs 1,559 Cr of financing inflows (fresh borrowings and other funding). In plain terms, the dividend is comfortably covered by current earnings, but it is being paid during a year when the business as a whole is consuming cash to build capacity — funded from reserves and borrowings, not surplus free cash. That is fine at this token scale; it would matter a great deal if the payout were large.
Working-Capital Watch
The cash conversion cycle stretched from 78 days (FY25) to 115 days (FY26), mainly because inventory days rose from 121 to 159. Rising inventory is common in a fast-scaling manufacturer, but it is a real drag on cash that partly explains why OCF fell even as profit rose.
Balance Sheet Strength
Key Balance-Sheet Items (FY26)
- Net WorthRs 4,307 Cr
- BorrowingsRs 3,707 Cr
- InvestmentsRs 670 Cr
- CWIPRs 2,144 Cr
- Book Value / ShareRs 95.1
Return Ratios
- ROE (FY26)42.4%
- ROCE (FY26)33.3%
- 3-Yr Avg ROE~45.8%
- Stock P/E~31x
The Debt Story
Borrowings nearly doubled — from Rs 1,954 Cr (FY25) to Rs 3,707 Cr (FY26). On its own that looks alarming next to a dividend, but context matters: the debt is funding a large capacity expansion (reflected in the Rs 2,144 Cr CWIP), not the payout. Return ratios remain excellent (ROE 42.4%, ROCE 33.3%), so the borrowed capital is being deployed at high returns. The exact net-debt figure needs the cash-and-bank line from the full annual report (Not Independently Verified here); on gross terms the company is now moderately leveraged rather than net-cash.
Dividend Sustainability Analysis
1. Earnings Coverage
33.3x PASS
EPS Rs 33.33 covers the Re 1.00 FY26 payout 33 times. Payout ratio only ~3%.
2. Operating-Cash Coverage
27.8x PASS
OCF of Rs 1,261 Cr dwarfs the ~Rs 45 Cr total outflow.
3. Free-Cash Coverage
–38.3x WATCH
FCF is negative (–Rs 1,736 Cr), so the payout is not covered by free cash this year — it comes from earnings/reserves.
4. Balance-Sheet Coverage
14.8x PASS
Investments of Rs 670 Cr alone cover the outflow ~15x.
Verdict: Sustainable at Token Levels — With One Watch Flag
Three of four tests pass comfortably. The dividend is so small relative to profit and operating cash that its continuation is not in doubt at current levels. The single amber flag is negative free cash flow alongside rising debt — meaning this is a payout funded by earnings during a capex-heavy year, not by surplus free cash. Investors should read the dividend as a confidence signal, not a cash-return engine. A meaningful step-up in the payout is unlikely until the capex supercycle peaks and free cash flow turns positive again.
Peer Comparison
| Company | Div Yield | ROE | ROCE | P/E |
|---|---|---|---|---|
| Premier Energies | ~0.10% | 42.4% | 33.3% | ~31x |
| Waaree Energies | ~0.07% | 32.8% | 38.8% | ~19x |
| Waaree Renewable Tech. | ~0.11% | 69.1% | 85.4% | ~19x |
Peer data per Screener.in as on early Aug 2026. Blank cells left blank where not verified from primary sources.
Read-Through
The pattern is consistent across the entire listed Indian solar-manufacturing space: near-zero yields (all around 0.1%) because every player is in an aggressive, cash-hungry expansion phase. Waaree Energies likewise pays a token first-post-IPO dividend and runs negative free cash flow. Premier stands out for the highest ROE (42.4%) in the group but trades at a richer P/E (~31x) than Waaree's ~19x. The takeaway: none of these are dividend plays — they are growth-and-capacity stories where the payout is a footnote.
Promoter Impact Analysis
Shareholding (Jun 2026)
- Promoters58.48%
- FIIs7.92%
- DIIs17.97%
- Public & Others15.62%
Promoter Dividend Income
- On this Rs 0.75 tranche~Rs 22 Cr
- On full FY26 Re 1.00~Rs 29 Cr
Estimated on promoter holding of ~63.94% around the record date. Post-record (Jun 2026) holding fell to 58.48%.
A Detail Worth Flagging
Of the ~Rs 45 Cr total FY26 dividend, roughly Rs 29 Cr flowed to promoters given their majority stake. Separately, promoter holding declined from 63.94% (Mar 2026) to 58.48% (Jun 2026) — a 5.46-point reduction around the dividend window. This is not unusual for a recently listed company (institutional interest rose in parallel — DIIs climbed to ~18%), but the combination of collecting dividends while trimming stake is a fact minority investors should note and monitor. There is nothing in the filing to suggest anything improper; it simply warrants attention.
Taxation Analysis
Since the abolition of Dividend Distribution Tax, dividends in India are taxed in the hands of the shareholder at their applicable income-tax slab rate. The company deducts TDS at 10% under the Income-tax rules if the total dividend paid to a resident individual in a financial year exceeds a threshold (the company's own communication references the applicable limit for FY26-27). Submitting Form 15G/15H (where eligible) can prevent TDS for those below the taxable limit. NRIs face higher withholding, subject to DTAA relief.
Worked Example — This Rs 0.75 Tranche
Investor holds 1,000 shares, tax slab 30%:
- Gross dividend (1,000 × Rs 0.75)Rs 750
- TDS @10%Nil (below threshold)
- Tax @30% slabRs 225
- Net in handRs 525
Worked Example — Full FY26 (Re 1.00)
Same 1,000 shares, 30% slab, on total FY26 payout:
- Gross dividend (1,000 × Rs 1.00)Rs 1,000
- Tax @30% slabRs 300
- Net in handRs 700
Effective post-tax yield on a ~Rs 1,035 share is roughly 0.07%.
Illustrative only. Actual TDS thresholds, surcharge, and cess depend on the prevailing Income-tax provisions and individual circumstances. Consult a tax professional.
Key Risks
1. Negative Free Cash Flow
FY26 FCF was –Rs 1,736 Cr. Until the capex cycle peaks, the business consumes cash, limiting any dividend step-up and increasing reliance on debt/equity funding.
2. Rising Leverage
Borrowings nearly doubled to Rs 3,707 Cr. If solar margins compress, higher interest and repayment obligations could pressure returns.
3. Customer / Export Concentration
The company holds a very large share of Indian solar-cell exports to the US. Shifts in US trade policy, tariffs, or demand could hit a key revenue channel.
4. Technology & Price Cyclicality
Solar cell/module prices and technology (e.g., TOPCon) evolve fast. Global oversupply or a technology shift could erode the current ~30% margins.
5. Rich Valuation
At ~31x earnings and ~10x book, the stock prices in strong future growth. Any execution slip on capacity or margins leaves little valuation cushion.
6. Working-Capital Drag
The cash conversion cycle lengthened to 115 days on rising inventory, weakening cash conversion even as profit grows.
What To Monitor
1. Free Cash Flow Turn
Watch for the quarter when capex peaks and FCF turns positive — the trigger for any meaningful dividend increase.
2. Capacity Commissioning
Track cell/module GW additions (e.g., the Seetharampur ramp) and utilisation rates — the payoff on the Rs 2,144 Cr CWIP.
3. Operating Margin Trend
The 30%+ OPM is the earnings engine. Any slide toward the mid-20s on price competition would matter more than the dividend.
4. Debt & Fund-Raising
Monitor gross borrowings and any equity raise (a large fund-raising was on the Board agenda) for dilution or leverage shifts.
5. Promoter Holding
After the drop to 58.48% (Jun 2026), watch subsequent shareholding filings for further promoter stake changes.
6. Order Book & US Policy
Track order-book value and any change in US import/tariff policy affecting solar-cell exports.
Conclusion
Premier Energies' Rs 0.75 second interim dividend is best understood as a confidence signal from a fast-growing company, not an income proposition. The positives are real and substantial: FY26 profit up 61% to Rs 1,510 Cr, margins expanding to 30%+, and one of the best return profiles in the sector (ROE 42.4%). The dividend is trivially covered by earnings and operating cash.
The caution is equally real: free cash flow is deeply negative (–Rs 1,736 Cr), debt has nearly doubled, the working-capital cycle has stretched, and the yield (~0.10%) is negligible against a rich ~31x valuation. This is a capacity-and-growth story where the dividend is a footnote. Investors seeking cash income should look elsewhere; those attracted to the growth thesis should judge the stock on execution, margins, and free-cash-flow recovery — not the payout. We present the facts; the decision is yours.
Frequently Asked Questions
What dividend has Premier Energies announced?
What is the dividend yield?
What is the record date?
What is the ex-date?
When will the dividend be paid?
Who is eligible for this dividend?
How is this dividend taxed?
Is the dividend sustainable?
What is Premier Energies' dividend history?
Does this dividend need AGM approval?
How much did promoters earn from this dividend?
What should investors monitor going forward?
Is Premier Energies a good dividend stock?
Disclaimer
This article is published by ShareBazaar Online for information and educational purposes only and does not constitute investment, financial, legal, or tax advice, nor a recommendation to buy, sell, or hold any security. ShareBazaar Online is not a SEBI-registered investment adviser or research analyst. Figures are drawn from the company's exchange filings and third-party data sources (including Screener.in) believed reliable but not independently audited; items marked "Not Independently Verified" or "Not Disclosed by Company" should be treated accordingly. Live market price, ex-date, and record-date details must be re-verified against the primary exchange corporate-action circular before acting. Securities investments are subject to market risks; past performance does not guarantee future results. Readers should consult a qualified professional and conduct their own due diligence before making any decision.