
Dividend Snapshot
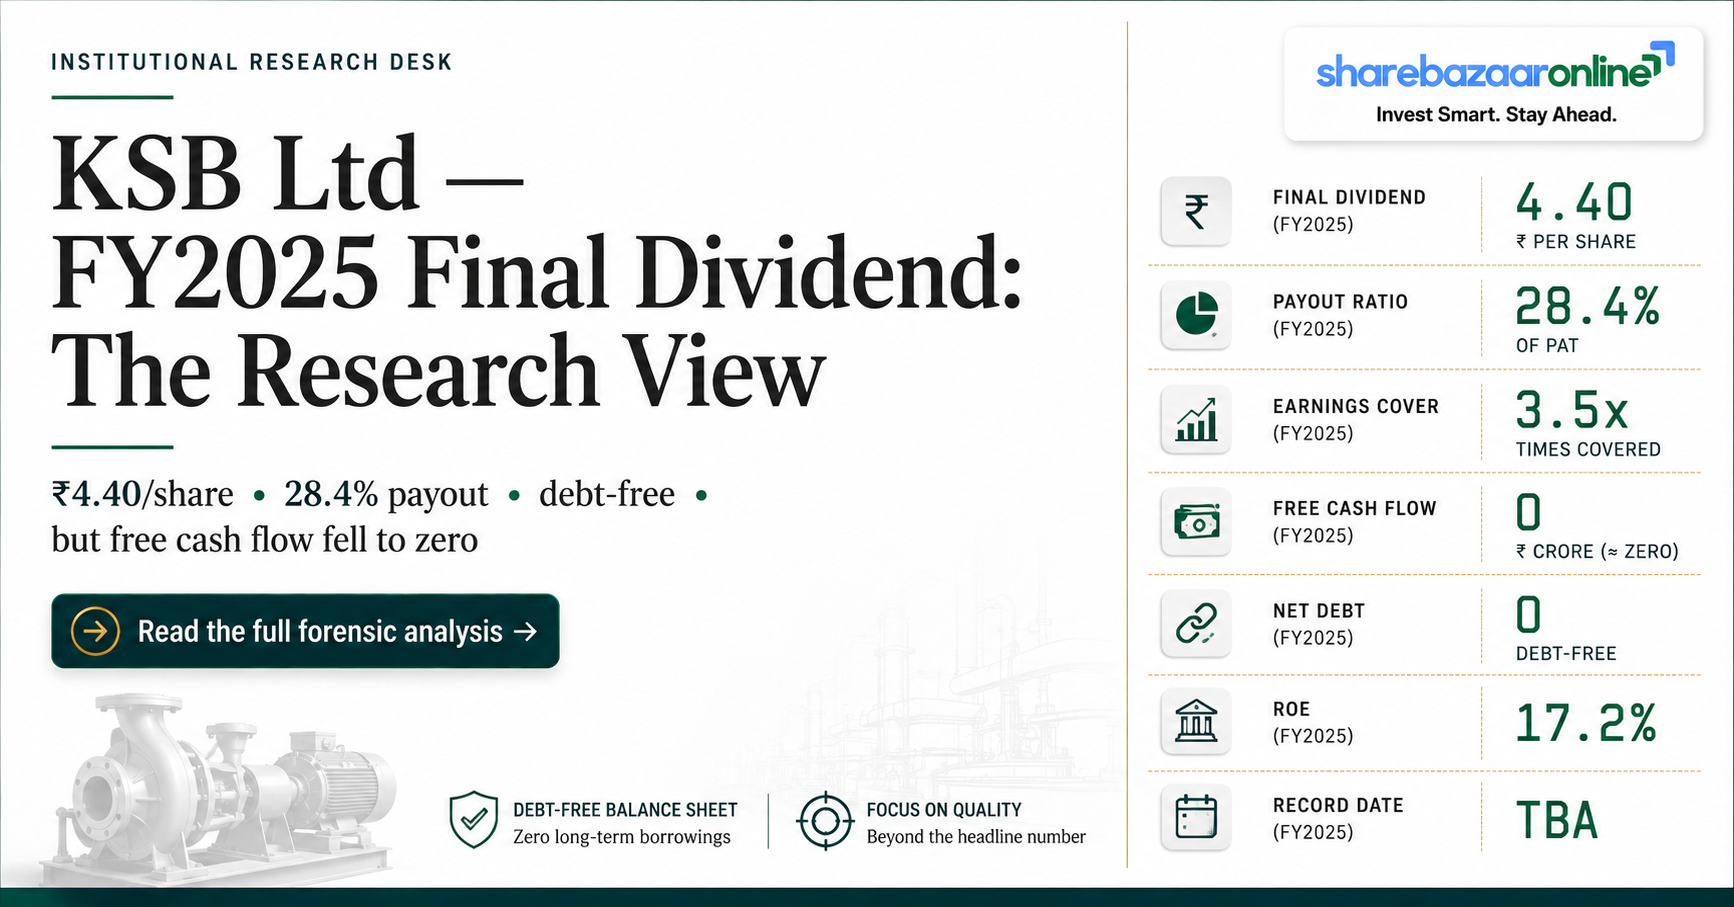
KSB Limited (formerly KSB Pumps Limited) has recommended a Final Dividend of ₹4.40 per share (220% of the ₹2 face value) for the financial year ended 31 December 2025. KSB follows a January–December financial year, so this is the full-year payout for FY2025.
KSB / 500249
INE999A01023
Final Dividend
₹2
₹4.40
0.54%
28.4%
8 May 2026
₹76.58 Cr
Consistent Payer
Yield computed on CMP ₹811 (05 Aug 2026, NSE via Screener). Re-verify live price at publish — yield figures go stale quickly.
Dividend Announcement Summary
At its board meeting on 25 February 2026, the Board of Directors of KSB Limited recommended a final dividend of ₹4.40 per equity share (220%) on 17,40,39,220 equity shares of ₹2 face value each, for the year ended 31 December 2025. Under Regulation 42 of SEBI (LODR), the company fixed 8 May 2026 as the record date to determine entitlement.
The dividend was declared subject to shareholder approval at the Annual General Meeting (AGM) held on 20 May 2026. Being a final dividend, it is not payable until approved by members — unlike an interim dividend which the board can pay directly. The AGM approved the payout.
The same board cycle also approved the re-appointment of Mr. Rajeev Jain as Managing Director for a further five years with effect from 1 July 2026, signalling management continuity.
Key Dates Timeline
Ex-date note: The company did not disclose an ex-date. Under India's T+1 settlement, the ex-date and record date fall on the same trading day, so the ex-date is inferred as 8 May 2026. Confirm against the exchange corporate-action circular before relying on it.
Payment note: A final dividend must be paid within 30 days of AGM approval under the Companies Act. With the AGM on 20 May 2026, the statutory outer limit was on or about 19 June 2026. The prior-year (FY2024) dividend was paid on 14 June 2025, a comparable timeline. The exact FY2025 payment date is Not Independently Verified.
Dividend Yield Analysis
The maths
Yield reality check
KSB's yield is low by design, not by distress. The dividend has grown every year (see history), but the share price has re-rated far faster — the stock trades at a P/E near 54x and 8.8x book value. When a quality compounder re-rates, the yield compresses even as the rupee dividend rises.
This is a classic "growth-stock, thin-yield" profile: investors are paid mainly through capital appreciation, not dividend income. The 0.54% yield sits below the ~1.3% top-quartile Indian dividend payer and below the machinery-industry average.
Dividend History Analysis
| Financial Year | Declared (as paid) | Split-Adjusted (₹2 FV) | Payout |
|---|---|---|---|
| FY2019 (Dec) | ₹8.00 (FV10) | ₹1.60 | 28% |
| FY2020 (Dec) | ₹8.50 (FV10) | ₹1.70 | 32% |
| FY2021 (Dec) | ₹12.50 (FV10) | ₹2.50 | 29% |
| FY2022 (Dec) | ₹15.00 (FV10) | ₹3.00 | 29% |
| FY2023 (Dec) | ₹17.50 (FV10) | ₹3.50 | 29% |
| FY2024 (Dec) | ₹4.00 (FV2) | ₹4.00 | 28% |
| FY2025 (Dec) | ₹4.40 (FV2) | ₹4.40 | 28.4% |
Declared amounts and dates cross-referenced from exchange filings and TipRanks/Trendlyne records. Split adjustment applied by the author, not the aggregators.
Financial Performance Analysis
| Metric (Consolidated, ₹ Cr) | FY2024 | FY2025 | Growth |
|---|---|---|---|
| Revenue | 2,533 | 2,696 | +6.4% |
| EBITDA (Operating Profit) | 340 | 377 | +10.9% |
| Operating Margin (OPM) | 13% | 14% | +~100 bps |
| Net Profit (PAT) | 247 | 270 | +9.3% |
| EPS (₹) | 14.22 | 15.54 | +9.3% |
Operating leverage: quality growth
Unusually for FY2025, EBITDA (+10.9%) and PAT (+9.3%) both grew faster than revenue (+6.4%) — positive operating leverage. Margins expanded to 14% as the pump/valve mix and aftermarket ("SupremeServ") service revenue improved. The profit growth is operational, not accounting-driven: the tax rate held steady at ~25% and there was no one-off tax benefit inflating the number.
The near-term wobble to note
The FY2025 headline masks a soft start to FY2026. In Q1 CY2026 (Mar-26 quarter), net profit fell ~23% YoY to ₹40 Cr and OPM slid to 8% (from 14%). Q2 CY2026 (Jun-26) recovered partially to ₹57 Cr PAT at 12% OPM. Trailing-twelve-month PAT has slipped to ~₹246 Cr. Momentum has cooled after the dividend was declared.
Cash Flow Analysis
| ₹ Cr | FY2024 | FY2025 |
|---|---|---|
| Net Profit | 247 | 270 |
| Operating Cash Flow | 187 | 93 |
| CFO / Operating Profit | 75% | 53% |
| Free Cash Flow | 88 | ~0 |
Why cash lagged profit
Two forces drained cash: (1) a working-capital blowout — the cash conversion cycle stretched from 163 to 204 days, with debtor days rising from 94 to 118 and inventory days from 165 to 197; and (2) elevated capex — capital work-in-progress rose from ₹55 Cr to ₹92 Cr as the company invests in capacity. Together these turned ₹270 Cr of profit into roughly zero free cash for the year.
Balance Sheet Strength
KSB is effectively debt-free, carrying just ₹5 Cr of borrowings against ₹1,679 Cr of net worth. Reserves of ₹1,644 Cr are ~21x the ₹76.6 Cr dividend outflow, so the payout poses no balance-sheet risk.
The one soft spot is working-capital intensity: the cash conversion cycle at 204 days is elevated and rising, tying up cash in receivables and inventory even though the capital structure itself is pristine. Precise cash-and-bank balances are Not Independently Verified from primary filings here; the debt-free, high-reserve position is confirmed.
Dividend Sustainability Analysis
| Coverage Test | Result | Verdict |
|---|---|---|
| Earnings coverage (EPS ₹15.54 ÷ DPS ₹4.40) | 3.53x | Strong |
| OCF coverage (CFO ₹93 Cr ÷ outflow ₹76.6 Cr) | 1.21x | Thin |
| FCF coverage (FCF ~₹0 ÷ outflow) | ~0.0x | Not covered (FY25) |
| Reserve coverage (reserves ₹1,644 Cr ÷ outflow) | 21.5x | Very strong |
Peer Comparison
| Company | Div Yield | Payout | ROE | ROCE | Debt |
|---|---|---|---|---|---|
| KSB Ltd | 0.54% | 28.4% | 18.4% | 24.7% | Debt-free |
| Kirloskar Brothers | 0.37% | ~21% | Low | ||
| Roto Pumps | 0.36% | ~15% | Low | ||
| Shakti Pumps | ~3% |
Blank cells are intentionally left empty where the figure could not be verified from primary sources. Peer yields/payouts per latest available screens; re-verify at publish.
Promoter Impact Analysis
The German parent group holds 69.80%, so ₹53.45 Cr of the ₹76.58 Cr payout (70%) flows to the promoter. This is normal for a majority-held MNC subsidiary and is not, by itself, a red flag — the dividend rate per share is identical for every shareholder.
Worth noting: promoter holding rose from 66.69% to 69.80% in mid-2024 via a creeping acquisition. A high, rising promoter stake can raise the odds of higher future payouts (parents often prefer cash extraction via dividend), but it also thins the free float. Minority holders receive the same ₹4.40/share on their ~30% collective stake.
Taxation Analysis
How dividends are taxed in India (post-2020 regime): Dividends are taxable in the hands of the shareholder at their applicable income-tax slab rate — there is no separate Dividend Distribution Tax anymore. The company deducts TDS under Section 194 at 10% only if total dividend from that company in a financial year exceeds ₹5,000 (₹10,000 for certain cases from FY2025-26). Resident investors with income below the basic exemption limit can file Form 15G/15H to avoid TDS.
Worked example — 1,000 shares
Worked example — 2,000 shares (TDS triggers)
Illustrative only; cess/surcharge vary by total income. Not tax advice — consult a qualified professional.
Key Risks
1. Working-capital deterioration. The cash conversion cycle has stretched to 204 days (from 163), with debtor days at 118. This is already suppressing free cash flow and could worsen if project-linked receivables (power, water, infra) stay slow.
2. Near-term earnings softness. Q1 CY2026 PAT fell ~23% YoY with OPM dropping to 8%. A weak start to FY2026 could pressure the next dividend's growth rate.
3. Valuation risk. At ~54x earnings and ~8.8x book, the stock prices in strong growth. Any earnings disappointment can de-rate the price sharply — the 52-week range (₹667–₹1,028) shows the volatility.
4. Order-cycle and input-cost exposure. Demand is tied to capex cycles in energy, water and industry; steel/casting input inflation and supply-chain disruption can compress margins.
5. Thin free float / promoter concentration. With promoters at 69.8%, liquidity is limited and minority influence is low; corporate actions are effectively parent-driven.
6. Low income appeal. A 0.54% yield offers negligible downside cushion for income-focused investors versus the price risk carried.
What To Monitor
1. Cash conversion cycle & debtor days. Watch whether the 204-day CCC and 118 debtor days revert toward historic norms (~160/94) — the key to restoring free cash flow.
2. Operating margin recovery. Track whether OPM rebuilds from the 8% Q1 CY2026 trough back toward the 14% full-year level.
3. Order intake & backlog. Monitor order inflows (including nuclear, solar pumps, exports) and orders-on-hand as the leading indicator of FY2026-27 revenue.
4. Capex / CWIP trajectory. CWIP rose to ₹92 Cr; watch whether new capacity converts into revenue and improved asset turns rather than trapped capital.
5. Payout ratio & free-cash funding. Track whether the ~28% payout holds and whether future dividends are backed by free cash flow rather than reserves.
6. Export and forex mix. ~17% of order intake is exports; monitor global project demand and currency effects.
Conclusion
The positives: A ₹4.40 dividend that continues a decade-long, split-adjusted rising streak; a disciplined ~28% payout; 3.5x earnings coverage; a debt-free balance sheet with reserves covering the payout 21x; and a high-quality franchise compounding revenue ~17% and profit ~25% over five years.
The negatives & risks: A thin 0.54% yield; free cash flow that fell to roughly zero in FY2025 as working capital ballooned (CCC 204 days); a soft Q1 CY2026 (PAT −23% YoY); and a rich ~54x valuation with limited float.
The bottom line: KSB is a Consistent Payer whose dividend is Sustainable from earnings and reserves, but FY2025 exposed a cash-conversion soft spot that keeps the payout backstopped by the balance sheet rather than by the year's own free cash. Income-seekers will find the yield negligible; the dividend is best read as a signal of financial health and capital discipline alongside a growth story, not as an income source.