
Dividend Snapshot
Company
Sundram Fasteners Limited
NSE: SUNDRMFAST | BSE: 500403 | ISIN: INE387A01021
A TVS Group auto-component maker (fasteners, powertrain & precision parts)
Dividend Declared
₹4.25 per share
Second Interim Dividend, FY2025–26 · 425% on face value of Re 1
*Ex-date not disclosed by company. Inferred as record date minus one trading day under the T+1 settlement convention. Investors should confirm against the NSE/BSE corporate-action circular before acting. CMP and yields are as of the last verified close and become stale quickly — re-verify at read time.
Dividend Announcement Summary
On 30 April 2026, the Board of Directors of Sundram Fasteners Limited approved a Second Interim Dividend of ₹4.25 per equity share (425% on a face value of Re 1) for the financial year ended 31 March 2026. The board meeting began at 5:00 p.m. and concluded at 7:10 p.m. IST. The record date to identify eligible shareholders is 8 May 2026 (Friday), and the dividend was scheduled for payment on 25 May 2026 (Monday). Book closure was marked "Not Applicable" in the filing.
The full FY26 picture (the part aggregators miss)
This is the second interim payout of the year, not the whole story. The company had already paid a first interim dividend of ₹3.75 per share (record date 4 November 2025, paid 20 November 2025). Together, FY26 dividends total ₹8.00 per share (800%). The board recommended no separate final dividend for FY26 — the two interims are the full annual distribution.
A common misconception to correct
Several price-data websites tagged this payout as "subject to shareholder approval." That is inaccurate. Interim dividends are declared by the board and do not require AGM approval under the Companies Act, 2013 — only final dividends do. This dividend was therefore payable on the stated date without waiting for the AGM (held 24 June 2026).
Key Dates Timeline
Announcement / Board Meeting
30 April 2026 (Thursday)
Board approved second interim dividend alongside audited FY26 results.
Ex-Date (inferred, T+1)
07 May 2026 (Thursday)
Not company-disclosed. Record date minus one trading day. Confirm with exchange circular.
Record Date
08 May 2026 (Friday)
Shareholders on the register on this date are eligible.
Payment Date
25 May 2026 (Monday)
Credited electronically to eligible shareholders' bank accounts.
TDS documentation deadline: the company advised shareholders to update PAN, bank and residential-status details by 11 May 2026 to avoid a higher withholding rate.
Dividend Yield Analysis
Yield on this dividend (₹4.25)
Yield on full-year FY26 (₹8.00)
Yield reality check — don't be fooled by "425%"
The headline "425%" looks dramatic, but it is calculated on a Re 1 face value — every rupee of dividend equals 100%. In cash terms the payout is a modest ₹4.25 per share, and the full-year yield of about 0.81% is well below the ~1.0–1.3% typical of the auto-components peer set. Sundram Fasteners is structurally a growth compounder that reinvests heavily in capacity, not a high-yield income stock. Its low yield reflects a rising share price and a deliberately restrained payout — not a weak dividend. Investors buying purely for income should calibrate expectations accordingly.
*The ~₹808.85 reference is an approximate price prevailing around the 30-Apr-2026 announcement; the exact NSE close on the announcement date is Not Independently Verified. Yields at CMP use the last verified close (₹993, 04-Aug-2026) and should be re-computed at publish time.
Dividend History Analysis
| Financial Year | Interim(s) | Final | Total DPS (₹) | Frequency |
|---|---|---|---|---|
| FY26 | ₹3.75 + ₹4.25 | Nil | 8.00 | Semi-annual |
| FY25 | ₹3.00 + ₹4.20 | Nil | 7.20 | Semi-annual |
| FY24 | ₹2.68 | ₹4.17 | 6.85 | Semi-annual |
| FY23 | ₹3.57 | ₹3.06 | 6.63 | Semi-annual |
| FY22 | ₹6.45 | — | 6.45 | Interim |
| FY21 | ₹1.30 + ₹3.40 | Nil | 4.70 | Semi-annual |
Per-share figures on current face value of Re 1. Compiled from exchange filings and dividend-history aggregators (TipRanks / Trendlyne / IndMoney). Individual line items are Not Independently Verified against each year's original board resolution; treat as indicative.
Classification: Consistent Payer
Sundram Fasteners has paid a dividend every year for over a decade, typically twice a year, with no cuts or suspensions through the COVID year (FY21) or the demand slowdown of FY20. The trend is one of steady growth: from ₹4.70 (FY21) to ₹8.00 (FY26).
Growth trend
The FY26 total of ₹8.00 is up ~11% over FY25's ₹7.20. The first interim itself rose 25% year-on-year (₹3.75 vs ₹3.00). No special dividends have distorted the series — this is organic, earnings-linked growth.
Financial Performance Analysis
Consolidated financials (₹ Crore)
| Metric | FY26 | FY25 | YoY |
|---|---|---|---|
| Revenue | 6,289 | 5,955 | +5.6% |
| EBITDA (Op. Profit) | 999 | 945 | +5.7% |
| Operating Margin (OPM) | 16% | 16% | Flat |
| Net Profit (PAT) | 591 | 542 | +9.0% |
| EPS (₹) | 28.13 | 25.66 | +9.6% |
Operating leverage: quality, not one-offs
Revenue (+5.6%), EBITDA (+5.7%) and PAT (+9.0%) all moved in the same direction, and margins held at 16%. The faster PAT growth was helped by lower borrowing costs (debt reduced ₹198 Cr) rather than a tax break — the effective tax rate was steady near 24–25%. This is clean, operations-led profit growth, not accounting flattery.
Watch the Q4 headline
Q4FY26 PAT of ₹161.4 Cr jumped +29.7% YoY — an eye-catching number, but partly a base effect: the comparable Q4FY25 quarter was unusually weak (₹124.4 Cr, itself down ~7% YoY). Sequentially and on a full-year view, the underlying growth is a more grounded high-single-digit rate.
Five-year context: consolidated sales CAGR ~12% and profit CAGR ~11%. Screener flags sales growth as "poor" at ~11.5% over five years — respectable for a mature auto-ancillary but not a hyper-growth print. Source: Screener.in (consolidated). Figures rounded.
Cash Flow Analysis
Reported profits are opinions; cash is fact — and the cash story is the best part of FY26
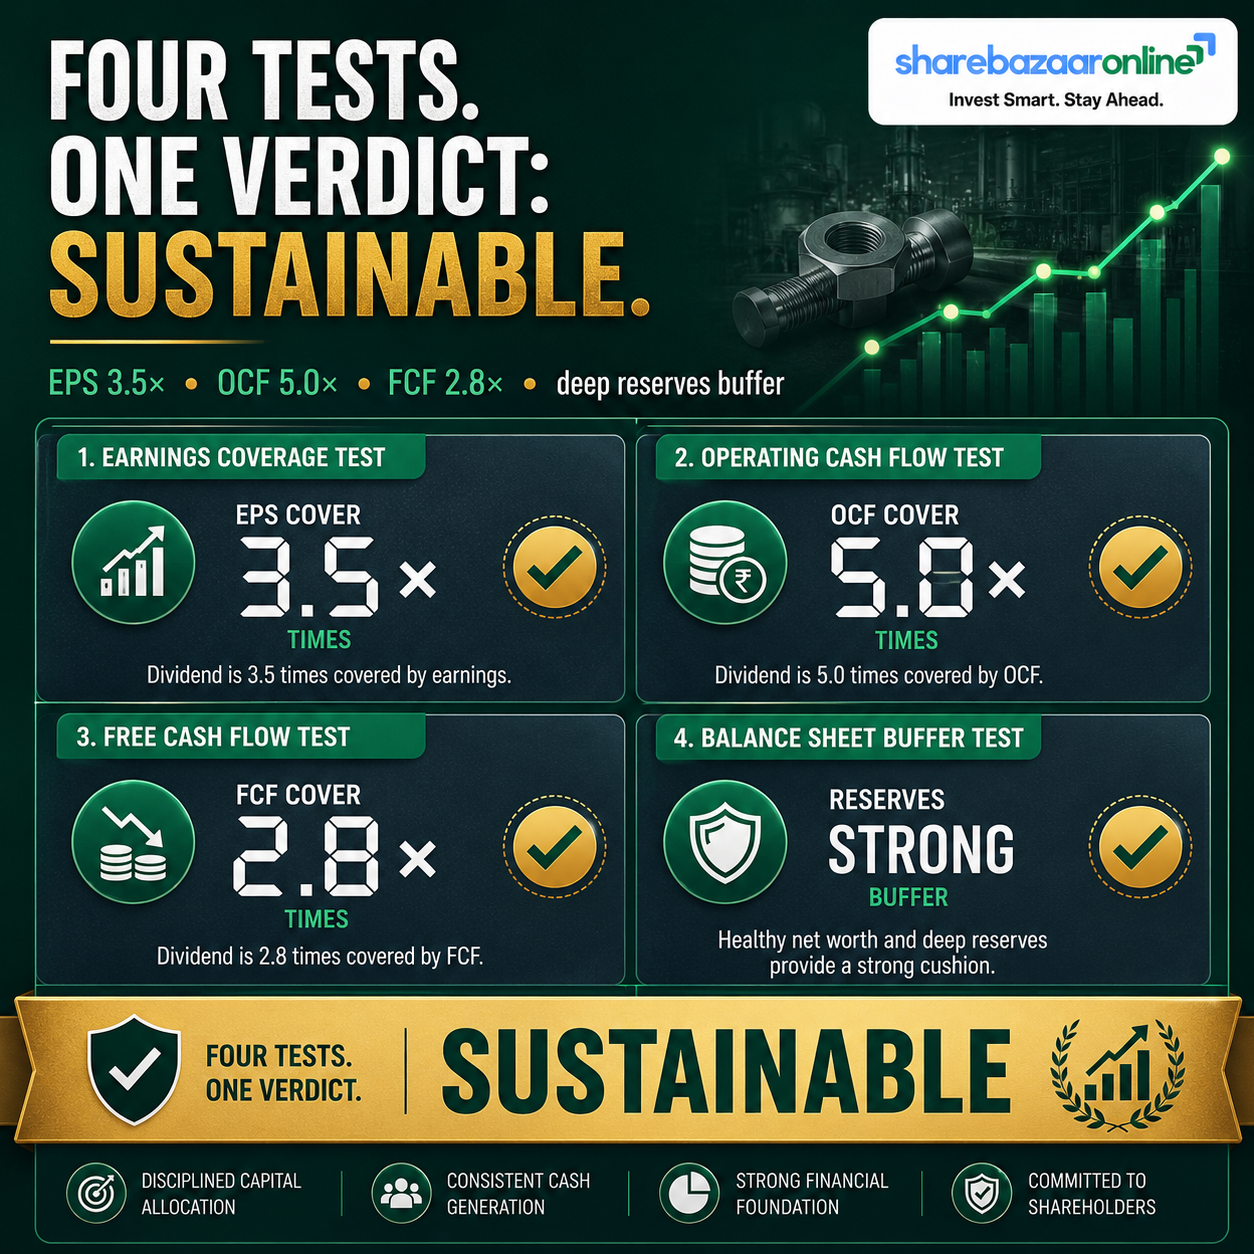
Operating cash flow surged to ₹837 Cr in FY26 (from ₹423 Cr in FY25), converting ~101% of TTM operating profit into cash. Free cash flow rebounded to ₹467 Cr — a dramatic recovery from just ₹29 Cr in FY25, when heavy capex and working-capital build-up had squeezed it. The full-year dividend of ₹167 Cr is therefore covered 2.8× by FY26 free cash flow and 5.0× by operating cash flow.
How is the dividend funded?
From current earnings and internally generated cash, not borrowings or asset sales. In FY26 the company simultaneously paid ₹167 Cr in dividends, funded ₹357 Cr of investing outflow (capex), and reduced debt by ₹198 Cr — all financed by the ₹837 Cr operating cash engine. That is the hallmark of a self-funding balance sheet.
The one caution: receivables and inventory are stretching
Debtor days sit at 89 and inventory days at 175, pushing the cash-conversion cycle to ~173 days — up sharply from ~130 days in FY23. FY26's cash recovery is real, but the multi-year working-capital creep is the single most important item to keep watching; if it resumes, it can quietly erode free cash flow even when the P&L looks healthy.
Balance Sheet Strength
The balance sheet is comfortably geared: borrowings of ₹625 Cr sit against reserves of ₹4,254 Cr, and debt fell ₹198 Cr in FY26. Returns are solid for a capital-intensive components maker (ROCE ~17.6%), though ROE has drifted down toward ~15% as the equity base has grown faster than profit — a natural feature of a company retaining ~72% of earnings to fund expansion. Precise net-debt/cash figures are Not Disclosed in the summary data used here; readers should consult the FY26 annual report for exact cash and cash-equivalents.
Dividend Sustainability Analysis
Test 1 — Earnings coverage
EPS ₹28.13 vs full-year DPS ₹8.00 → 3.5× cover; payout ratio ~28%. Pass.
Test 2 — Operating cash coverage
OCF ₹837 Cr vs dividend ₹167 Cr → 5.0× cover. Pass.
Test 3 — Free cash flow coverage
FCF ₹467 Cr vs dividend ₹167 Cr → 2.8× cover in FY26 (but only ~0.2× in FY25 — watch). Pass with flag.
Test 4 — Balance-sheet coverage
Reserves ₹4,254 Cr and falling debt provide a deep buffer many times the annual payout. Pass.
Verdict: Sustainable
The dividend clears all four tests on FY26 numbers, with a conservative ~28% payout that leaves ample room. The single watch flag is the volatility of free cash flow — FY25 covered the dividend only ~0.2× before FY26's strong rebound. As long as working capital stays contained, the payout looks durable and likely to keep growing with earnings.
Peer Comparison
| Company | Div Yield | Payout | ROE | ROCE | P/E |
|---|---|---|---|---|---|
| Sundram Fasteners | ~0.81% | ~28% | ~14.9% | ~17.6% | ~33.6 |
| Bosch Ltd | ~0.7% | — | — | — | ~44–48 |
| Schaeffler India | ~0.8% | ~47% | — | — | — |
| Bharat Forge (consol) | ~0.3%* | — | — | — | — |
Blank cells are intentional where values could not be verified from primary sources. *Bharat Forge yield reflects the ₹6.50 final dividend only. Peer businesses differ materially in scale and mix (Bosch, Schaeffler and Bharat Forge are structured differently), so treat the table as directional context, not a like-for-like ranking. Sources: MarketsMojo, Screener, exchange filings.
Across the auto-components space, dividend yields cluster in a low 0.3%–0.8% band — these are reinvesting, capex-heavy franchises, not income plays. Sundram Fasteners' ~0.81% yield and ~28% payout sit in the middle of the pack: more generous than Bharat Forge's payout, more conservative than Schaeffler's ~47%. Its ROCE of ~17.6% is competitive within the group.
Promoter Impact Analysis
Shareholding (Jun 2026)
Dividend distribution (FY26 total ₹167 Cr)
Because the promoter holds under half the equity, the majority of every dividend rupee (~53%) flows to minority shareholders — institutions and the public. Promoter holding has been stable (no selling; shares reported as unencumbered for FY26), and DII ownership has risen meaningfully over three years, signalling institutional confidence. The dividend policy is not skewed to extract cash for the promoter; it is broadly aligned with all shareholders.
Taxation Analysis
Since April 2020, dividends are taxed in the hands of the shareholder at their applicable income-tax slab rate (the company no longer pays Dividend Distribution Tax). Under Section 194, the company deducts TDS at 10% if a resident shareholder's total dividend from that company in a financial year exceeds ₹5,000 (higher for missing PAN; different rules and DTAA relief apply to non-residents). Eligible investors can file Form 15G/15H to avoid TDS where their income is below the taxable threshold. TDS is only a credit — the final liability is at your slab.
Worked example — investor holding 1,000 shares
On this 2nd interim (₹4.25/sh)
On full-year FY26 (₹8.00/sh)
On the ₹4.25 payout alone, no TDS applies because ₹4,250 is below the ₹5,000 threshold — but the amount is still fully taxable at slab. The effective post-tax yield for a 30%-slab investor on the full-year dividend is roughly 0.56% at CMP. Illustrative only; not tax advice.
Key Risks
1. Working-capital creep
The cash-conversion cycle has widened to ~173 days (from ~130 in FY23). Rising debtor and inventory days can drain free cash flow even in profitable years.
2. Auto-cycle & demand dependence
As an auto-components supplier, revenue is tied to OEM production volumes. A slowdown in domestic autos or exports directly hits the top line.
3. EV transition & product mix
Some legacy powertrain/fastener content is exposed to the shift away from internal-combustion engines; the pace of the company's EV/non-auto diversification matters.
4. Raw-material & margin pressure
Steel and alloy price inflation can compress the ~16% operating margin if cost pass-through to OEMs lags.
5. Capex intensity & return dilution
Sustained heavy capex (₹350–400 Cr/yr) grows the equity base; if incremental returns lag, ROE can keep drifting lower, as seen recently.
6. Global trade & currency
A meaningful export share (Europe/Americas) exposes earnings to tariff shifts, freight costs and rupee volatility.
What To Monitor
1. Cash-conversion cycle
Track debtor days (89) and inventory days (175) each quarter. A move back toward FY23 levels would strengthen FCF; further stretch is a red flag.
2. Free cash flow consistency
FY26's ₹467 Cr FCF was a big rebound from ₹29 Cr. Watch whether the company can sustain 2×+ dividend cover through the capex cycle.
3. Export & non-auto revenue share
Growth in Europe and non-auto/EV segments is the key to de-risking from the domestic ICE auto cycle. Subsidiaries contributed ~13% of consolidated revenue in FY26.
4. Operating margin trajectory
Whether the ~16% OPM holds or expands as capex projects ramp and volumes scale.
5. Payout-ratio drift
The ~28% payout has been remarkably stable. A step-up would signal maturing capex needs; a cut would signal reinvestment pressure.
6. Debt trend & interest cost
Debt fell ₹198 Cr in FY26; continued deleveraging supports both margins and dividend headroom.
Conclusion
Positives
A decade-long, uninterrupted, growing dividend record; a conservative ~28% payout with 3.5× earnings cover; a strong FY26 cash rebound (OCF ₹837 Cr, FCF ₹467 Cr covering the payout ~2.8×); falling debt; and a distribution that sends the majority of cash to minority shareholders.
Negatives & watch-points
A low absolute yield (~0.81%) that makes this an unsuitable pure-income holding; a widening cash-conversion cycle; a flattering base-effect in the Q4 headline; and an ROE that has drifted toward ~15% as the equity base grows. FY25's near-zero FCF is a reminder that cash cover can swing sharply year to year.
In short, the ₹4.25 second interim (₹8.00 for the full year) is a sustainable, well-covered dividend from a financially sound compounder — but it is a reinvestment-first business where the dividend is a modest by-product of growth, not the main event. We present the positives, negatives, risks and monitoring factors above; the investment decision rests with the reader.
Frequently Asked Questions
What dividend has Sundram Fasteners announced?
What is the dividend yield?
What is the record date?
What is the ex-date?
When will the dividend be paid?
Who is eligible for the dividend?
Does this dividend need AGM/shareholder approval?
How is the dividend taxed?
Is the dividend sustainable?
What is Sundram Fasteners' dividend history?
Why is the yield so low if the dividend is "425%"?
What should investors monitor going forward?
How much of the dividend goes to the promoter?
Disclaimer
This article is prepared by ShareBazaar Online for informational and educational purposes only and is not investment advice, nor a recommendation to buy, sell or hold any security. ShareBazaar Online is not a SEBI-registered investment adviser or research analyst. Dividend amounts, dates and financial figures are compiled from company exchange filings (NSE/BSE), the FY26 annual report, Screener.in and third-party dividend-history aggregators; certain items are inferred or unverified and are explicitly flagged as such (for example, the ex-date is inferred under the T+1 convention and the announcement-date price is not independently verified). Market price and yield figures become stale quickly and must be re-verified against live data before acting. Investments in securities are subject to market risks; please read all related documents carefully and consult a qualified, SEBI-registered financial adviser and tax professional before making any decision.