
Dividend Snapshot
National Aluminium Company Limited (NALCO), a Navratna Central Public Sector Enterprise under the Ministry of Mines, has recommended a final dividend of Re.1.00 per share (20% on the face value of Rs.5) for the financial year 2025-26. The recommendation was made at the Board meeting held on 31 July 2026 and is subject to shareholder approval at the 45th Annual General Meeting.
Company / Ticker
National Aluminium Company Ltd
NSE: NATIONALUM | BSE: 532234 | ISIN: INE139A01034
Final Dividend (FY2025-26)
Re.1.00 per share (20%)
Type: Final | Face Value: Rs.5
Record Date
Monday, 24 August 2026
Ex-Date: 24 Aug 2026 (record-date basis under T+1)
Live Market Price (CMP)
Rs.377 (04-05 Aug 2026)
Market Cap: ~Rs.69,241 crore
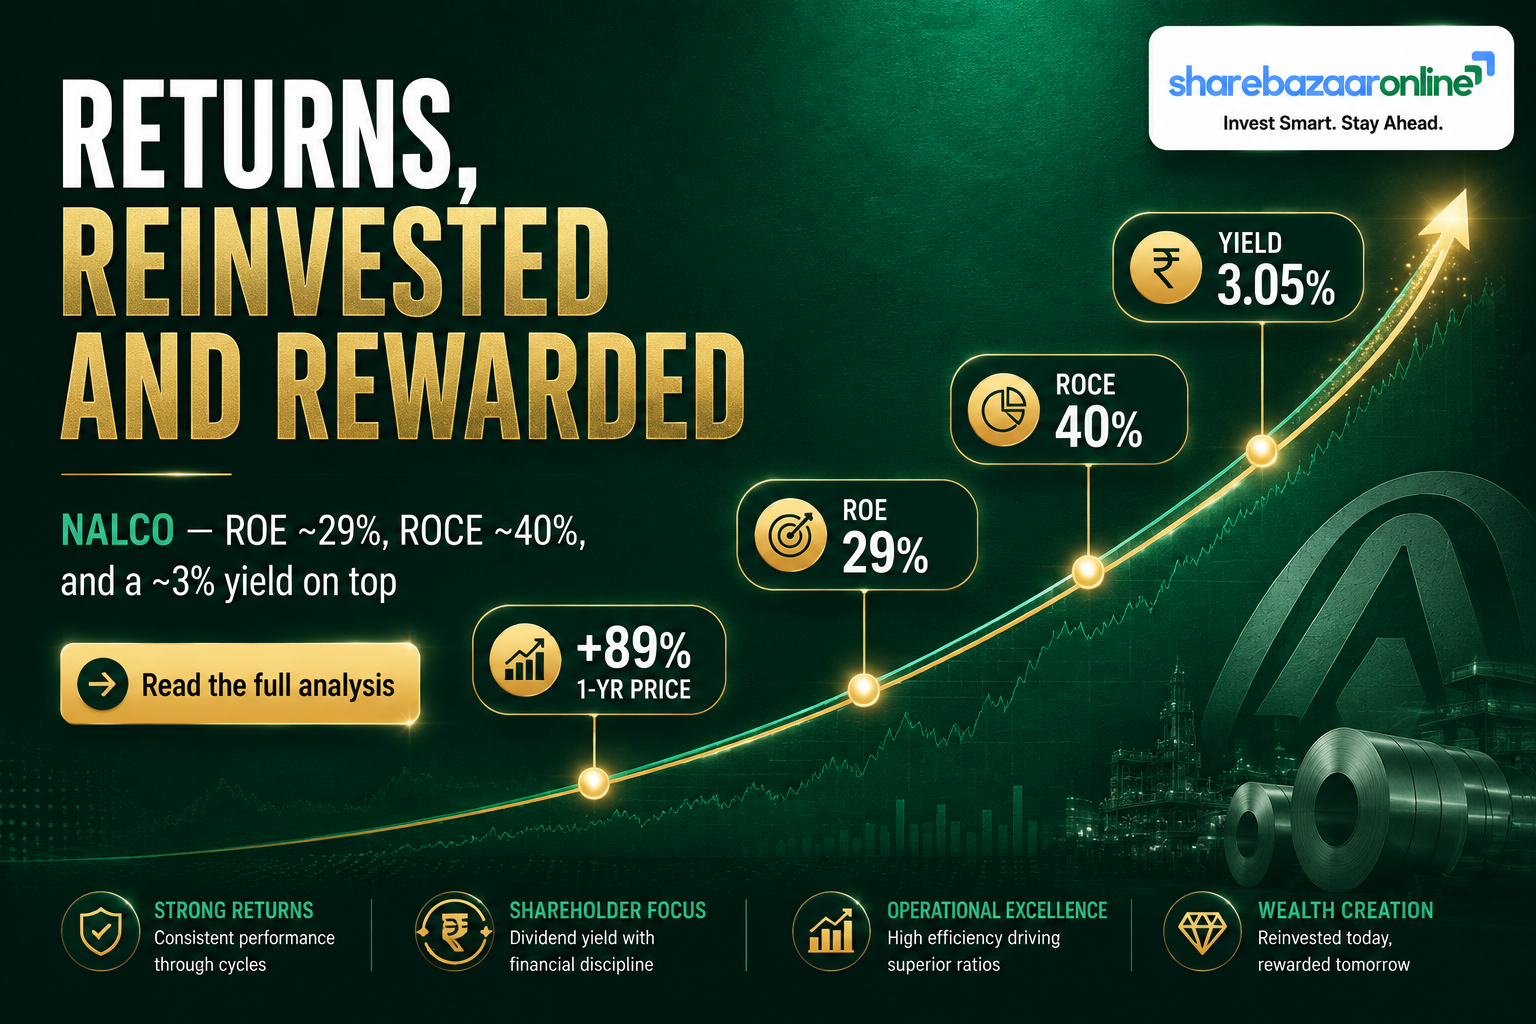
Key context most wire reports miss: the Re.1 final dividend is only the closing instalment of a full-year payout of Rs.11.50 per share for FY2025-26 — the company had already paid three interim dividends of Rs.4.00, Rs.4.50 and Rs.2.00. On the current price, the final dividend alone yields just ~0.27%, while the full-year trailing yield is ~3.05%. NALCO is a consistent-but-cyclical payer: it has declared a dividend every year since 1992, but the amount swings with the aluminium and alumina price cycle. (Market data: Screener.in / INDmoney, Aug 2026.)
Dividend Announcement Summary
At its meeting on 31 July 2026 (which ran from 1700 to 2000 hours), the NALCO Board approved the unaudited standalone and consolidated results for the quarter ended 30 June 2026 and recommended a final dividend of Re.1.00 per equity share for FY2025-26. As disclosed by the company, the total final-dividend outflow works out to approximately Rs.183.66 crore.
What was announced
Final dividend of Re.1.00/share (20%), in addition to three interims already paid during FY2025-26 (Rs.4.00 + Rs.4.50 + Rs.2.00 = Rs.10.50, i.e. 210%). Full-year distribution: Rs.11.50/share (230% on face value).
Approval & payment mechanics
The final dividend requires shareholder approval at the 45th AGM on 31 August 2026. Once declared, it will be paid within 30 days as per the Companies Act, 2013 — implying an outer limit on or before ~30 September 2026. The exact payment date has not been disclosed by the company.
Note on eligibility timing: the record date (24 August 2026) falls before the AGM (31 August 2026). This is a standard sequence for PSU final dividends — the register is frozen to fix eligibility, but actual payment follows shareholder ratification.
Key Dates Timeline
Announcement Date
31 July 2026 (Board meeting)
Ex-Date
24 August 2026 (inferred, T+1)
Record Date
Monday, 24 August 2026
45th AGM
Monday, 31 August 2026, 11:00 AM (VC/OAVM)
Payment Date
On/before ~30 Sept 2026 (statutory limit; exact date not disclosed)
Financial Year
FY2025-26 (final dividend)
Sourcing discipline: The record date is company-disclosed. Under the current T+1 settlement regime, the ex-date typically coincides with the record date, and NALCO's four most recent dividends have all carried ex-date = record date. Investors should still confirm the ex-date against the NSE/BSE corporate-action circular before trading around the cut-off.
Dividend Yield Analysis
Final dividend, in isolation
Re.1.00 ÷ Rs.377 (CMP) = ~0.27%
Re.1.00 ÷ Rs.350.05 (announcement-day close, 31 Jul 2026) = ~0.29%
Full-year FY2025-26 dividend
Rs.11.50 ÷ Rs.377 (CMP) = ~3.05% (trailing yield)
Rs.11.50 ÷ Rs.350.05 (31 Jul close) = ~3.29%
Yield reality check
A headline of "NALCO declares final dividend" can mislead income-focused readers: the final instalment yields under a third of a percent. The meaningful income figure is the ~3.05% trailing yield on the full Rs.11.50. Note also that this yield has compressed versus a year ago — not because the dividend was cut, but because the share price has roughly doubled over 12 months (up ~89-96%). A falling yield here reflects price appreciation, not deteriorating distribution. (Yields must be re-verified at publish time; CMP moves daily.)
Dividend History Analysis
| Financial Year | Total Dividend/Share | Total Outflow | Notes |
|---|---|---|---|
| FY2025-26 | Rs.11.50 (230%) | ~Rs.2,112 cr | 3 interims (Rs.10.50) + Re.1 final |
| FY2024-25 | Rs.10.50 (210%) | Rs.1,928.46 cr | Record payout; GoI share ~Rs.988.88 cr |
| FY2023-24 | ~Rs.5.00 (approx) | Not independently verified | Payout ~46% of PAT (Screener) |
| FY2022-23 | ~Rs.4.50 (approx) | Not independently verified | Payout ~58% of PAT (Screener) |
| FY2021-22 | ~Rs.6.50 (approx) | Not independently verified | Payout ~40% of PAT (Screener) |
| FY2019-20 | ~Rs.1.50 (approx) | Not independently verified | Payout ~205% — earnings crashed, dividend maintained |
Per-share figures for FY2019-20 to FY2023-24 are inferred from Screener.in payout ratios and are labelled "approx / not independently verified." FY2024-25 and FY2025-26 totals are corroborated by company filings and press coverage.
Classification: Consistent Payer, Cyclical Amount
NALCO has been profitable since 1987 and has paid a dividend every year since 1992, with cumulative distributions of roughly Rs.14,331 crore through FY2024-25. But the size of the payout is not a smooth growth line — it tracks the commodity cycle. The FY2019-20 payout of ~205% (dividend maintained while profit collapsed to Rs.136 crore) is the tell-tale signature of a cyclical payer. Investors should read NALCO's dividend as reliable in occurrence but variable in magnitude, not as a bond-like, ever-rising income stream.
Financial Performance Analysis
FY2025-26 (Consolidated, audited)
Revenue from operations: Rs.17,843 cr (+6.3% YoY)
Net profit (PAT): Rs.5,797 cr (+10.0% YoY)
EPS: Rs.31.56 | Operating margin: ~44%
Q1 FY2026-27 (Consolidated, Jun 2026)
Revenue from operations: Rs.5,302 cr (+39.3% YoY)
Net profit (PAT): Rs.2,003 cr (+90.9% YoY)
EPS (quarter): Rs.10.91 | Operating margin: ~51%
The non-obvious read on the growth numbers
The Q1 FY27 profit "+90.9% YoY" headline is real but flattered by a soft base: the June-2025 quarter (Rs.1,049 cr) was one of the weaker prints in the recent run. The more durable signal is the operating margin expanding to ~51% on strong aluminium prices and higher output. Separately, note that full-year FY26 PAT rose only ~10% — the explosive move was in FY25 (+158%, when aluminium/alumina prices surged). FY26 looks like a consolidation at a high earnings plateau, not a fresh acceleration. Reported profit here is operationally driven (margins, volumes, prices), not inflated by tax write-backs or one-off treasury gains — a positive quality signal.
Audit "Emphasis of Matter" flag (rarely reported): the statutory auditors have drawn attention to the non-recognition of revenue from two wind power plants in Rajasthan, pending execution of a fresh Power Purchase Agreement (PPA), with the matter sub-judice before the Rajasthan High Court since 2019. The audit conclusion is not modified, but this is a live contingency worth monitoring.
Cash Flow Analysis
Reported profit is an accounting opinion; cash is the fact that funds a dividend. On this test NALCO scores well. For FY2025-26 (consolidated), operating cash flow was ~Rs.6,438 crore against net profit of ~Rs.5,797 crore — a cash conversion (CFO/OP) of roughly 105%, meaning earnings are backed by real cash, not stretched receivables. NALCO's debtor days are extremely low (~4 days), typical of a producer selling into strong-demand metal markets.
Free cash flow vs the dividend
FY26 free cash flow: ~Rs.4,413 cr
FY26 total dividend outflow: ~Rs.2,112 cr
FCF coverage: ~2.1x — the dividend is funded out of genuinely generated cash,
not borrowings or asset sales.
The capex nuance
NALCO is in a heavy-investment phase: capex (investing outflow) was ~Rs.4,200 cr in FY26 and capital work-in-progress has climbed to ~Rs.6,296 cr. FCF still comfortably covers the dividend today, but rising capital intensity is the variable that could compress future FCF coverage if metal prices soften.
How the dividend is funded: current-year cash generation — comfortably. This is the key distinction from a company that pays out of reserves or debt. NALCO earns the cash it distributes, while also self-funding a large expansion programme.
Balance Sheet Strength
Net worth (Mar 2026, consolidated)
~Rs.21,604 cr
Reserves ~Rs.20,685 cr + equity Rs.918 cr
Borrowings
~Rs.60 cr (near debt-free)
Debt-to-equity effectively negligible
Return ratios (Screener, FY26)
ROE ~29% | ROCE ~40%
Among the highest in the metals space
Book value / valuation
BV ~Rs.118 | P/E ~10-12x
5-yr profit CAGR ~35%
The balance sheet is a genuine dividend anchor: near-zero borrowings and ~Rs.20,685 crore of reserves mean the company can sustain distributions through a down-cycle without stress. The precise cash-and-bank plus current-investment figure is not separately broken out in the quarterly results and would need the full FY2025-26 balance sheet from the annual report to state exactly (marked "Not Disclosed in this filing"). What is clear is that NALCO is net-cash, which structurally de-risks the dividend relative to leveraged peers.
Dividend Sustainability Analysis
Test 1 — Earnings coverage
FY26 EPS Rs.31.56 ÷ DPS Rs.11.50 = 2.74x PASS
Test 2 — Operating cash coverage
OCF Rs.6,438 cr ÷ outflow Rs.2,112 cr = 3.05x PASS
Test 3 — Free cash flow coverage
FCF Rs.4,413 cr ÷ outflow Rs.2,112 cr = 2.09x PASS
Test 4 — Balance-sheet coverage
Reserves ~Rs.20,685 cr; borrowings ~Rs.60 cr PASS
Verdict: Sustainable — with a cyclicality watch flag
On all four tests the FY2025-26 dividend is comfortably covered. The payout ratio is a moderate ~36% of consolidated profit, leaving a large buffer. The single watch flag is commodity-price cyclicality combined with rising capex: NALCO's earnings are a leveraged bet on LME aluminium and alumina prices, and a sharp price fall — as in FY2019-20 — would shrink the earnings and FCF cushion even if the company chooses to maintain the per-share payout.
Peer Comparison
| Company | Div. Yield | Payout | ROE | ROCE | Balance sheet |
|---|---|---|---|---|---|
| NALCO | ~3.05% | ~36% | ~29% | ~40% | Near debt-free / net cash |
| Hindalco | ~0.5% | ~6% | ~10% | n/v | Net debt (Novelis) |
| Vedanta | ~4.7% | High | n/v | n/v | Elevated leverage |
| Hindustan Zinc | ~2-6% | High | Very high | n/v | Some debt; high dividend |
| Hindustan Copper | ~0.4% | Low | n/v | n/v | Low leverage |
"n/v" = not verified from a primary source and intentionally left blank. Peer figures are indicative, sourced from Screener.in / Trendlyne / Simply Wall St around Aug 2026 and move with prices and results.
NALCO occupies a distinctive middle ground: a higher yield than the growth-reinvestors (Hindalco, Hindustan Copper) but backed by a far stronger balance sheet than the high-yield names (Vedanta). Vedanta's ~4.7% yield comes with heavy leverage and a stretched payout; NALCO's ~3.05% comes with near-zero debt and a ~36% payout. On a quality-of-yield basis — is the dividend safe? — NALCO screens the best of this set, at the cost of a slightly lower headline yield.
Promoter Impact Analysis
Shareholding (Jun 2026)
Promoter (Government of India): 51.28%
FIIs: 21.99% | DIIs: 11.22%
Public: 15.52% | ~9.49 lakh shareholders
Who the dividend flows to
Final dividend to GoI (51.28% of Rs.183.66 cr): ~Rs.94 cr
FY26 full-year dividend to GoI (51.28% of Rs.2,112 cr): ~Rs.1,083 cr
GoI's disclosed FY24-25 dividend share was ~Rs.988.88 cr.
Alignment, and a caveat. Because the government owns a majority stake, dividends double as a fiscal-transfer channel to the exchequer, and every rupee per share is paid pro-rata to all holders — minority shareholders receive the same Rs.1 as the promoter, so there is no preferential treatment. The nuance for public investors: PSU payout decisions can be influenced by the government's fiscal needs, which is a supportive factor for dividend consistency but can occasionally sit in tension with pure capital-allocation logic (for example, paying out versus retaining more for the large ongoing expansion).
Taxation Analysis
Since the abolition of the Dividend Distribution Tax (April 2020), dividends are taxed in the hands of the shareholder at their applicable income-tax slab rate. The company deducts TDS under Section 194 at 10% where the aggregate dividend paid to a resident individual in a financial year exceeds Rs.10,000 (this threshold was raised from Rs.5,000 with effect from FY2025-26). Investors can file Form 15G/15H to avoid TDS if their income is below the taxable limit. Non-resident shareholders are subject to different rates, subject to DTAA relief.
Worked example — retail investor holding 1,000 NALCO shares
Final dividend only: 1,000 × Re.1.00 = Rs.1,000 gross. As this is below
the Rs.10,000 threshold, no TDS is deducted on the final instalment alone. At a 30% slab, tax
of ~Rs.312 (incl. 4% cess) applies, leaving ~Rs.688 net.
Full FY2025-26 dividend (illustrative): 1,000 × Rs.11.50 = Rs.11,500 gross.
This exceeds Rs.10,000, so TDS @10% = Rs.1,150 is withheld at source. At a 30% slab, total tax
(incl. 4% health & education cess) is ~Rs.3,588, of which the Rs.1,150 TDS is adjustable.
Net in-hand: ~Rs.7,912. On a Rs.377 CMP, that is a post-tax yield of ~2.10% for
a top-bracket investor.
Illustration only, not tax advice. Actual liability depends on the investor's total income, slab, residency and surcharge. Consult a qualified tax professional.
Key Risks
1. Commodity-price cyclicality
Earnings and dividends are a leveraged bet on LME aluminium and alumina prices. FY2019-20 (profit Rs.136 cr) shows how sharply a down-cycle can hit.
2. Rising capital intensity
CWIP has climbed to ~Rs.6,296 cr with ~Rs.4,200 cr annual capex (5th refinery stream, captive coal, Angul CPP JV). Heavy spend can pressure FCF if prices fall.
3. Rajasthan wind-power PPA dispute
Revenue from two wind plants is unrecognised pending a fresh PPA, sub-judice since 2019 (auditors' Emphasis of Matter). A contingency, not yet quantified in P&L.
4. Input-cost & energy exposure
Coal, power and caustic-soda costs drive margins. Aluminium is energy-intensive; cost inflation or coal-supply disruption can squeeze the ~50% margins.
5. PSU / policy & FX risk
Government majority ownership means payout and capex decisions can reflect fiscal priorities. Exports and imported inputs add rupee-dollar sensitivity.
6. New-capacity competition
Large new aluminium capacity being planned by other groups could pressure long-run domestic pricing and market share.
What To Monitor
1. LME aluminium & alumina prices
The single biggest swing factor for margins, profit and next year's dividend size.
2. Capex execution & commissioning
Progress on the 5th alumina refinery stream, Utkal captive coal ramp-up and the 1,080 MW Angul CPP JV with NLC — timelines and cost overruns.
3. FCF vs dividend trend
Whether FCF coverage stays above ~2x as capex peaks; a slide toward 1x would be an early sustainability warning.
4. Operating margin (OPM)
The ~51% Q1 FY27 margin is cycle-high; watch for cost inflation or price mean-reversion.
5. Rajasthan PPA litigation outcome
Resolution could release recognised revenue or crystallise a liability.
6. Captive coal & bauxite security
Self-sourcing of coal and bauxite (Pottangi, Utkal) is central to NALCO's low-cost edge and future margins.
Conclusion
Positives
The Re.1 final caps a full-year payout of Rs.11.50 (~3.05% trailing yield) that is covered 2.7x by earnings and 2.1x by free cash flow, sits on a near debt-free balance sheet with ~Rs.20,685 cr reserves, and is backed by industry-leading ROE (~29%) and ROCE (~40%) and a 34-year unbroken dividend record.
Negatives & watch-points
Both earnings and dividends are cyclical and commodity-driven; the payout amount is not a smooth growth series. The company is in a heavy capex phase that could compress future FCF cover, and an unresolved Rajasthan PPA dispute remains an open contingency. The current ~3% yield also reflects a share price that has roughly doubled in a year.
Overall: a well-covered, sustainable dividend from a financially robust, cyclical PSU. This analysis is informational and non-advisory — the positives, negatives, risks and monitoring factors are laid out so readers can reach their own conclusions.
Frequently Asked Questions
What dividend has NALCO announced for FY2025-26?
What is the NALCO dividend yield?
What is the record date for the NALCO final dividend?
What is the ex-date?
When will the NALCO dividend be paid?
Who is eligible for the dividend?
How is the NALCO dividend taxed?
Is the NALCO dividend sustainable?
What is NALCO's dividend history?
Why has the dividend yield fallen versus last year?
How much does the Government of India earn from this dividend?
What should investors monitor going forward?
Disclaimer
This article is for informational and educational purposes only and does not constitute investment, financial or tax advice, nor a buy/sell/hold recommendation. ShareBazaar Online is not a SEBI-registered investment adviser. Figures are drawn from the company's exchange filings and third-party sources (Screener.in, INDmoney, Trendlyne and others) believed reliable but not independently audited; items labelled "approx," "inferred" or "not independently verified" should be confirmed against primary sources. Market price, yield, ex-date and payment date must be re-verified at the time of reading, as they change. The final dividend is subject to shareholder approval at the 45th AGM. Investors should do their own research and consult a qualified professional before making any decision. Investments in securities are subject to market risks.