
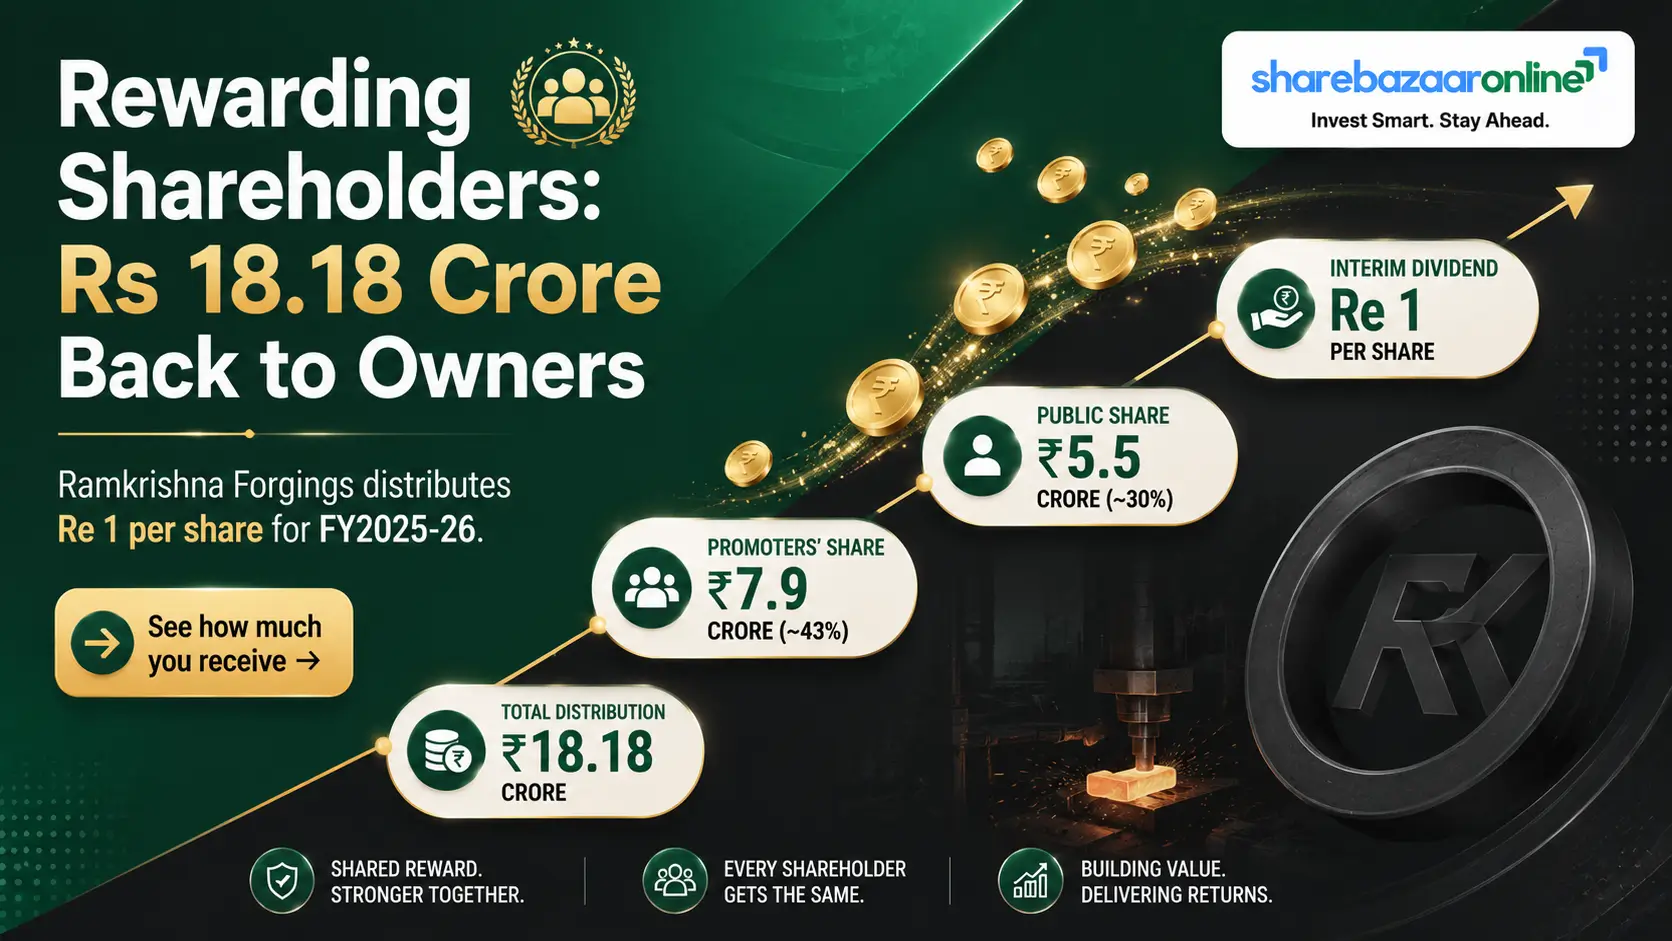
Dividend Snapshot
Dividend Declared
Re 1.00 per share
1st Interim Dividend for FY 2025-26 · 50% of the Rs 2 face value
Dividend Yield (on this payout)
~0.15%
On CMP Rs 646.70 (04 Aug 2026). Trailing 12-month dividend of ~Rs 2 yields ~0.31%. Re-verify CMP at publish.
Key Facts
- Announcement date: 1 May 2026
- Record date: 8 May 2026 (Friday)
- Ex-date: 8 May 2026 (same as record date under T+1)
- Payment: on or before 31 May 2026 (within 30 days of declaration)
- Total outflow: ~Rs 18.18 crore
The One-Line Story
Ramkrishna Forgings kept its dividend steady at Re 1 even as FY26 consolidated net profit fell ~83% to Rs 71.8 crore. Because earnings shrank, the payout ratio jumped from roughly 9% to ~25% without the company paying a single rupee more per share.
ShareBazaar note: This is an interim dividend. Under the Companies Act it is declared and paid by the Board and does not require shareholder approval at the AGM. The 44th AGM (29 Aug 2026) covers other items only.
Dividend Announcement Summary
At its Board meeting held on Friday, 1 May 2026 (11:30 A.M. to 2:30 P.M. IST), the Board of Ramkrishna Forgings Limited approved the audited standalone and consolidated financial results for the quarter and year ended 31 March 2026 and declared a 1st Interim Dividend of Re 1 per equity share of face value Rs 2, for FY 2025-26. The dividend is payable within 30 days of declaration and is subject to TDS.
Company & Security
| Company | Ramkrishna Forgings Ltd |
| NSE Symbol | RKFORGE |
| BSE Code | 532527 |
| ISIN | INE399G01023 |
| Sector | Forgings / Auto Components |
Other Board Decisions (1 May 2026)
- Allotment of 1,64,413 equity shares to the RKFL ESOP Trust at Rs 556/share (Rs 554 premium); paid-up shares rose to 18,18,35,017.
- Re-appointment of Naresh Jalan as Managing Director for 3 years (w.e.f. 5 Nov 2026, subject to AGM approval).
- Appointment of Bijay Kumar & Co. as Cost Auditor for FY 2026-27.
- Cessation of two Independent Directors (20 May 2026) and reconstitution of key Board committees.
Key Dates Timeline
| Event | Date | Source / Basis |
|---|---|---|
| Board Meeting / Declaration | 1 May 2026 | Company filing |
| Ex-Date | 8 May 2026 | Exchange data (= record date under T+1) |
| Record Date | 8 May 2026 (Fri) | Company filing |
| Payment (outer limit) | By 31 May 2026 | Within 30 days of declaration (exact date not separately disclosed) |
| 44th AGM | 29 Aug 2026 | Company filing (unrelated to interim dividend) |
To be eligible, shares had to be held in the demat account as of the record date (8 May 2026). Buyers on or after the ex-date (8 May 2026) were not entitled to this dividend.
Dividend Yield Analysis
Yield Maths
| On Re 1 @ CMP Rs 646.70 (04 Aug 2026) | 0.15% |
| On Re 1 @ ~Rs 580 (near announcement)* | 0.17% |
| Trailing 12M (~Rs 2) @ CMP Rs 646.70 | 0.31% |
*Announcement-day price is an approximation and is Not Independently Verified to the exact tick.
Yield Reality Check
The yield here is low, not because the price is high, but because the dividend itself is small. Ramkrishna Forgings runs a deliberately modest, single-digit-percent payout policy and reinvests most profit into capacity and debt reduction. A ~0.15% yield is a token, symbolic distribution, not an income proposition.
Put plainly: an investor holding Rs 1 lakh of the stock at Rs 646.70 owns roughly 155 shares and receives about Rs 155 from this dividend (before tax). The investment case for this stock is capital appreciation and cyclical earnings recovery, not dividend income.
Dividend History Analysis
| Financial Year | Dividend / Share (Rs) | Notes |
|---|---|---|
| FY 2025-26 | 1.00 (interim, so far) | Declared 1 May 2026 with FY26 results |
| FY 2024-25 | ~2.00 (total) | Paid across two tranches |
| Long-run range (10 yrs) | ~0.40 to 2.00 | On adjusted basis; face value revised to Rs 2 |
Values are on a face-value-Rs-2 basis. Older per-share amounts have been affected by a prior face-value change (Rs 10 to Rs 2) and are shown on an adjusted/indicative basis. Not Independently Verified year-by-year beyond the two most recent years.
Classification: Growing but Volatile Payer
Over a decade, the dividend has trended up (roughly mid-teens CAGR on third-party estimates) but has not been smooth — third-party dividend trackers flag at least one cut in the last ten years and describe the payout schedule as uneven. Combined with a consistently low payout ratio, Ramkrishna Forgings is best classified as a Consistent-but-modest / mildly cyclical payer whose distribution scales with a highly cyclical forging earnings stream.
Financial Performance Analysis (Consolidated)
| Metric (Rs crore) | FY 2025-26 | FY 2024-25 | Change |
|---|---|---|---|
| Total income | 4,251.19 | 4,060.49 | +4.7% |
| Net profit (PAT) | 71.80 | 415.03 | -82.7% |
| EPS (Rs) | 3.95 | 22.95 | -82.8% |
| Q4 revenue | 1,216.78 | 947.21 | +28.5% |
| Q4 PAT | 55.94 | 199.83 | -72.0% |
Source: company results / EquityBulls / market data. Q4 FY26 EBITDA (ex-other-income) reported at Rs 208.19 crore, ~17.1% margin.
The Non-Obvious Point: Read the 83% Drop Carefully
The headline is startling: revenue up ~5%, but net profit down ~83%. Two things drove the divergence, and only one is bad news:
- Base effect: FY25's Rs 415 crore profit was flattered by an exceptional tax reversal (per third-party result analysis). Stripping that out, FY25 was not a "normal" Rs 415 crore year, so the fall overstates the true operational decline.
- Genuine operating weakness: through FY26, margins compressed on weaker exports, tariff-related uncertainty, rare-earth/supply-chain constraints and softer realizations (early quarters saw PAT margins collapse toward ~1%). This part is real.
The encouraging counter-signal: Q4 FY26 EBITDA rose ~111% YoY with margins back to ~17%, and Q1 FY27 PAT jumped ~298% YoY to Rs 46.9 crore — evidence the cyclical trough may be behind the company. Exceptional-item detail Not Independently Verified from primary accounts.
Cash Flow Analysis
Profits Are Opinions; Cash Is Fact
This is where Ramkrishna Forgings looks weakest, and where wire coverage stays silent. Independent analysis indicates operating cash flow was squeezed to roughly Rs 32 crore in the most recent reported comparison — a steep fall from about Rs 621 crore a year earlier — as changes in working capital consumed ~Rs 362 crore of cash. The exact fiscal-year label on these cash-flow figures is Not Independently Verified from primary statements and should be confirmed against the audited cash-flow statement.
What This Means for the Dividend
The dividend outflow of ~Rs 18.18 crore is small enough to be technically covered even by a thin OCF (~1.8x). But the wider truth is that this dividend is not being funded by abundant free cash flow. With heavy capex and working-capital absorption, the company is a net user of cash, so any distribution effectively competes with debt reduction.
Funding Source of the Dividend
- Current earnings: Partial (PAT Rs 71.8 cr covers it ~4x)
- Free cash flow: Weak / negative in recent periods
- Cash reserves: Thin (~Rs 29 cr)
- Borrowings: Company already carries high debt
Balance Sheet Strength
| Item (latest audited, Mar-2025 basis) | Value |
|---|---|
| Total equity | ~Rs 3,037 cr |
| Total debt | ~Rs 2,126 cr |
| Cash & short-term investments | ~Rs 29 cr |
| Net debt | ~Rs 2,097 cr |
| Debt-to-equity | ~0.70x |
| Interest coverage (EBIT/interest) | ~1.4x (weak) |
Source: third-party balance-sheet aggregation on the latest fully-captured audited year (Mar-2025). FY26 closing balance-sheet detail is Not Independently Verified here; management has guided to Rs 400-500 crore of debt reduction in FY27.
The stand-out flags are thin liquid cash (~Rs 29 crore) against ~Rs 2,100 crore of debt, and interest coverage near 1.4x — the company's operating profit only just covers its interest bill. Debt-to-equity has improved over five years (from >110% to ~70%), and the company has raised equity (QIP and warrant conversions) partly to deleverage, but the balance sheet remains leveraged and interest-sensitive.
Dividend Sustainability Analysis
Four-Test Scorecard
| Test | Reading | Verdict |
|---|---|---|
| Earnings coverage (EPS/DPS) | 3.95x | Adequate |
| OCF coverage | ~1.8x | Thin |
| FCF coverage | Weak / negative | Watch |
| Cash / balance-sheet coverage | ~1.6x on ~Rs 29 cr cash | Thin |
Overall Verdict
Moderately Sustainable
The dividend is small enough to be affordable and covered by earnings — but it is not backed by strong free cash flow, and it sits alongside high debt and a stated deleveraging goal.
Watch Flags
- Payout ratio rose to ~25% only because earnings fell, not because the dividend grew.
- OCF and FCF must recover for future dividends to be comfortably self-funded.
- Any renewed margin/export shock could pressure both earnings and the dividend.
Peer Comparison
| Company | Div Yield | Payout | ROE | ROCE | Debt/Equity |
|---|---|---|---|---|---|
| Ramkrishna Forgings | ~0.15% | ~25%* | ~7.3% | ~3.3% | ~0.70x |
| Bharat Forge | ~0.68% | ~39% | ~9.9% | ~16.5% | ~0.70x |
| Happy Forgings | ~0.23% | ~13% | ~15.0% | ~18.0% | ~0.02x |
| MM Forgings | ~0.89% | ~16% | ~11.5% | ~9.8% | ~1.04x |
*RKFORGE payout ratio is elevated only because FY26 earnings fell. Peer figures are from third-party aggregators (Screener/MarketsMojo/TipRanks) as of mid-2026 and are indicative; face values differ (MM Forgings Rs 10, others Rs 2). Cells left indicative where primary verification was not possible.
On the numbers that matter to a dividend investor, Ramkrishna Forgings currently trails its peers: it has the lowest dividend yield, the weakest latest ROCE (~3.3%), and one of the higher leverage profiles. Happy Forgings stands out as nearly debt-free with far higher returns, while MM Forgings offers the best headline yield. Ramkrishna's appeal is a turnaround/operating-leverage story, not current cash returns or capital efficiency.
Promoter Impact Analysis
Shareholding (Mar-2026, indicative)
| Promoters | ~43.3% |
| FIIs / FPIs | ~21.7% |
| DIIs | ~4.4% |
| Public / Others | ~30.5% |
Largest promoter entity: Riddhi Portfolio Pvt Ltd. A portion of promoter shares (~15.6% of promoter holding, per one tracker) is reported as pledged — Not Independently Verified; confirm against the latest pledge disclosure.
Who Gets the Rs 18.18 crore?
| Promoters (~43.3%) | ~Rs 7.9 cr |
| FIIs (~21.7%) | ~Rs 3.9 cr |
| DIIs (~4.4%) | ~Rs 0.8 cr |
| Public (~30.5%) | ~Rs 5.5 cr |
Because the dividend is proportional, the promoter group receives roughly Rs 7.9 crore of the total. That is a modest sum relative to the company's scale, and there is no sign this small dividend is a disguised promoter-cash-out — minority and promoter shareholders are treated identically per share. The more relevant governance watch-items are promoter pledge levels and the MD re-appointment coming to the AGM.
Taxation Analysis
How Dividends Are Taxed in India (post-2020)
- Dividend is fully taxable in the hands of the investor at their applicable income-tax slab rate (there is no separate Dividend Distribution Tax anymore).
- TDS under Section 194: the company deducts 10% TDS only if total dividend from that company in the year exceeds Rs 5,000 (Rs 10,000 from FY 2025-26 onwards under recent amendments — confirm current threshold at filing).
- Resident investors can file Form 15G/15H to avoid TDS if their income is below the taxable limit.
- Non-residents are taxed as per the Act read with the applicable DTAA.
Worked Example — Retail Investor
Assume 1,000 shares, dividend Re 1/share, investor in the 30% slab:
| Gross dividend (1,000 × Re 1) | Rs 1,000 |
| TDS u/s 194 (below Rs 5,000 threshold) | Rs 0 |
| Tax at 30% slab (+ applicable cess) | ~Rs 300 |
| Net dividend after tax | ~Rs 700 |
| Post-tax yield on Re 1 (at CMP Rs 646.70) | ~0.11% |
Illustrative only; excludes surcharge and health & education cess specifics. Not tax advice.
Key Risks
1. Earnings cyclicality & margin volatility
FY26 PAT fell ~83% on export weakness, tariffs and supply-chain issues. Forging demand is tied to CV/auto and railway cycles, so earnings — and the dividend — can swing sharply.
2. High leverage & thin interest cover
Net debt ~Rs 2,100 crore and interest coverage ~1.4x leave limited buffer if EBIT dips. Rising rates or an earnings shock could strain debt servicing.
3. Weak / volatile cash conversion
Operating cash flow has been squeezed by heavy working-capital absorption. Persistent weak FCF limits the capacity to grow dividends without borrowing.
4. Export & customer concentration
A meaningful revenue share comes from North America/Europe and large OEMs. Tariff actions, demand softness or a single large-customer slowdown can hit realizations.
5. Execution & capex/JV risk
Growth depends on ramping new capacity (rail wheel JV, trailer axles, machining). Delays, cost overruns or slow utilization could dilute returns on the ~Rs 400 crore FY27 capex.
6. Governance / promoter pledge & dilution
Reported promoter pledging and repeated equity raises (QIP, warrants, ESOP) can dilute per-share metrics. The MD re-appointment is subject to AGM approval.
What To Monitor
- Quarterly EBITDA margin trajectory — management guided to a further 100-250 bps improvement over Q4 FY26's ~17%. Track whether it holds.
- Debt reduction delivery — the stated Rs 400-500 crore FY27 deleveraging and the trend in interest coverage.
- Operating and free cash flow — a return to strong OCF is the single most important signal for future dividend growth.
- Export share & North America demand — company expects exports at ~35% of FY27 revenue; watch tariff developments.
- Capacity utilization — guidance of 80-85% across forging/casting by end-FY27, plus rail-wheel JV and trailer-axle ramp.
- Whether a 2nd interim/final dividend follows — this was the "1st" interim; watch for further FY26/FY27 distributions and any change in payout policy.
Conclusion
Positives
- Dividend maintained at Re 1 despite a weak profit year.
- Q4 FY26 and Q1 FY27 point to a clear earnings recovery.
- Low payout policy keeps the dividend affordable.
- Ongoing deleveraging and diversification (rail wheels, machining, exports).
Negatives / Watch-Outs
- Very low yield (~0.15%) — not an income stock.
- Weak cash conversion and thin liquid cash.
- High debt, interest coverage only ~1.4x.
- Lowest ROCE vs peers; elevated valuation on depressed EPS.
Ramkrishna Forgings' Re 1 interim dividend is a steady, symbolic gesture during a transitional year, not a cash-return highlight. The real question for investors is operational: whether the Q4 FY26/Q1 FY27 recovery in margins and profits is durable, and whether cash flow and debt improve as guided. We present the evidence on both sides; the decision is yours.
Frequently Asked Questions
What dividend has Ramkrishna Forgings announced?
What is the dividend yield?
What is the record date?
What is the ex-date?
When will the dividend be paid?
Who is eligible for the dividend?
Does this interim dividend need AGM approval?
How is this dividend taxed?
Is the dividend sustainable?
Why did profit fall ~83% but the dividend stayed the same?
What is Ramkrishna Forgings' dividend history?
How does the dividend compare with peers?
What should investors monitor next?
Disclaimer
This article is published by ShareBazaar Online for informational and educational purposes only and is not investment advice. It does not constitute a recommendation to buy, sell or hold any security. ShareBazaar Online is not a SEBI-registered investment adviser. Dividend figures, dates and financials are based on the company's exchange filing dated 1 May 2026 and third-party data sources; some figures are labelled "Not Independently Verified" and should be confirmed against primary documents (company results, audited financial statements and exchange corporate-action circulars). Market price, yield and shareholding data change continuously and must be re-verified at the time of reading. Balance-sheet and cash-flow figures may reflect the latest fully-captured audited year and may differ from the most recent quarter. Taxation depends on individual circumstances; consult a qualified tax professional. Investments in securities are subject to market risks. Please do your own research or consult a SEBI-registered adviser before investing.
Data sources: BSE/NSE filing (1 May 2026); Screener.in; TipRanks; MarketsMojo; company earnings materials; brokerage/market-data aggregators. Figures in Rs crore unless stated.