
Dividend Snapshot
Company
Central Bank of India
NSE: CENTRALBK | BSE: 532885 | ISIN: INE483A01010
Dividend Declared
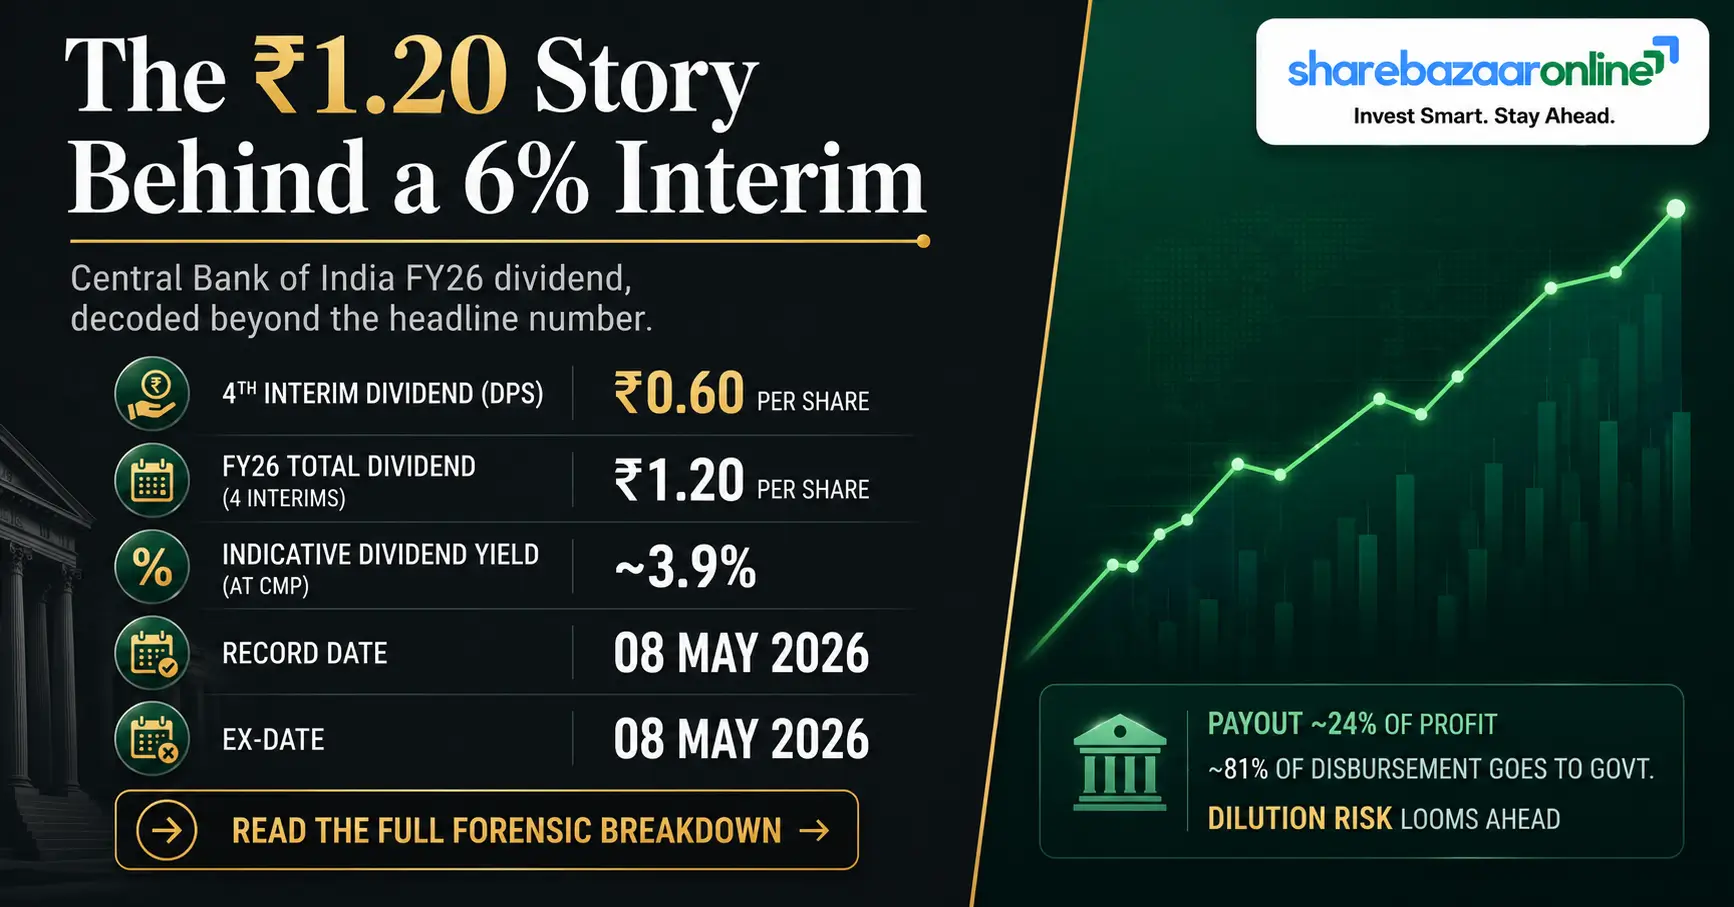
4th Interim Dividend — ₹0.60 per share
6% of ₹10 face value | FY 2025-26
Record Date
08 May 2026 (Friday)
Ex-date same as record date under T+1 settlement
FY26 Total Dividend
₹1.20 per share (four interims)
Trailing yield ~3.9% at CMP ₹31 (re-verify at publish)
One-line takeaway: A small ₹0.60 interim caps a year in which Central Bank paid ₹1.20 in total — its most generous distribution since resuming dividends in FY25 after a nine-year gap. The headline ~3.9% trailing yield is flattered by a share price that has fallen roughly 15% over the past year, and the payout stays modest at about 24% of profit, well within RBI limits.
Dividend Announcement Summary
On Thursday, 30 April 2026, the Board of Directors of Central Bank of India, at a meeting held in Mumbai (4:00 PM to 5:55 PM), approved its 4th interim dividend of ₹0.60 per equity share (6% on face value of ₹10) for the financial year 2025-26. The intimation was filed with NSE and BSE under Regulation 30 of SEBI (LODR) Regulations, 2015 (filing ref: CO:IRD:2026:27:32). The Bank fixed Friday, 08 May 2026 as the record date.
Why "interim" and not "final"?
The dividend was declared after the FY26 year-end but is classified as interim because the Board declared it directly. An interim dividend does not require shareholder approval at the AGM, so eligible holders on the record date receive it without waiting for the annual meeting.
Announced alongside
The same Board meeting approved audited FY26 results and a ₹7,000 crore capital-raising plan for FY27 (FPO / Rights / QIP / preferential / AT1 & Tier-II bonds). This capital plan is directly relevant to future dilution — discussed in the Promoter Impact section.
Key Dates Timeline
| Event | Date | Source / Basis |
|---|---|---|
| Board Meeting / Announcement | 30 April 2026 (Thu) | Company filing (Reg. 30) |
| Ex-Dividend Date | 08 May 2026 (Fri) | Same as record date under T+1 — not independently verified vs exchange circular |
| Record Date | 08 May 2026 (Fri) | Company filing |
| Payment Date | Not disclosed by company | Statutory outer limit ~30 days from declaration (on or before ~29 May 2026) |
Eligibility rule: To receive this dividend, an investor needed to hold shares in their demat account as on the record date, 08 May 2026. Since Indian equities settle on a T+1 basis, the last day to buy and still qualify was the trading day before the record date; buying on the ex-date (08 May 2026) did not confer entitlement.
Dividend Yield Analysis
Yield on this ₹0.60 interim
At the announcement-day price of ₹36.29 (BSE, 30 Apr 2026), the standalone yield on the ₹0.60 interim is only 1.65%. At the latest price of ~₹31.02 (NSE, 30 Jul 2026), it works out to ~1.93%.
Trailing 12-month yield (₹1.20)
Counting all four FY26 interims (₹1.20), the trailing yield is ~3.31% at the announcement price and ~3.87% at the latest price — broadly matching the ~3.7% shown on data aggregators.
Yield Reality Check — why the yield "looks" high
The ~3.9% trailing yield is not the result of an unusually generous payout. The rupee dividend (₹1.20) is small; the yield is elevated mainly because the share price fell about 14.5% between the announcement (₹36.29) and late July (₹31.02), and roughly 15-18% over the past year. A falling denominator mechanically lifts yield. Investors should read this as a price-weakness signal as much as an income signal — a high yield here reflects a de-rated stock (P/B ~0.72x) rather than a rising dividend stream.
Dividend History Analysis
| Financial Year | Dividend / Share | Notes |
|---|---|---|
| FY2014-15 | ₹0.50 | Last dividend before the gap |
| FY2016 to FY2024 | NIL | Loss years; under RBI Prompt Corrective Action (2017-2022) |
| FY2024-25 | ₹0.1875 | First dividend in 10 years (record date 4 Jul 2025) |
| FY2025-26 | ₹1.20 | Four interims (~₹0.20 + ₹0.20 + ₹0.20 + ₹0.60) |
Classification: Early-Stage / Recently-Reinstated Payer
Central Bank is not yet a "consistent payer." Dividends were suspended for nine straight years during its loss and clean-up phase and were only reinstated in FY25. FY26 shows a sharp step-up (₹0.1875 to ₹1.20, a 6.4x jump) and a move to quarterly interims, which is encouraging — but the track record is just two years long. Given the bank's cyclical, capital-hungry PSU profile, the dividend trajectory should be treated as improving but unproven rather than dependable.
Financial Performance Analysis
| Metric (Consolidated) | FY24 | FY25 | FY26 |
|---|---|---|---|
| Total Income (₹ cr) | 30,849 | 33,797 | 36,168 |
| Net Profit (₹ cr) | 2,677 | 3,943 | 4,531 |
| EPS (₹) | 3.07 | 4.35 | 5.00 |
| ROE (%) | 9% | 11% | ~12% |
Standalone FY26 net profit was ₹4,369 cr (EPS ₹4.83). Source: company results / Screener consolidated.
Headline: +15% profit — but read the fine print
FY26 net profit rose ~15% to ₹4,531 cr. Notably, this growth was achieved despite a ₹632 crore one-time deferred-tax charge in Q4 (from Finance Act 2026 changes). Stripping that out, underlying profitability was stronger — a rare case where the reported number understates operating momentum.
Two items that flattered / dented the number
A depreciation-method change (WDV to SLM) added ₹49 cr to FY26 profit. Meanwhile Q4 treasury income collapsed to ₹9 cr from ₹409 cr as bond yields hardened — the main reason Q4 profit fell ~30% YoY to ₹724 cr even as the full year grew. Core banking (NII, operating profit) was the real driver, not treasury.
Operating leverage check: FY26 operating profit grew ~4.4% to ₹8,479 cr while net profit grew ~15% — the wider bottom-line gain came mostly from lower credit costs (asset quality improving: GNPA 2.67%, NNPA 0.50%, provision coverage ~96%), not from operating efficiency. In fact, the cost-to-income ratio (~58.6%) remains among the highest in the PSU pack, a structural drag flagged in the Peer section.
Cash Flow Analysis
Important context: cash flow means something different for a bank
For an industrial company, "free cash flow" tells you whether a dividend is funded by real cash. For a bank, reported operating cash flow swings wildly year to year because it is dominated by movements in deposits and advances, not by profitability. So bank dividends are assessed against distributable profits and capital adequacy, not free cash flow.
| Cash Flow (Consolidated, ₹ cr) | FY24 | FY25 | FY26 |
|---|---|---|---|
| Cash from Operations | -5,910 | -2,460 | +2,804 |
| Cash from Investing | -584 | -451 | -454 |
| Cash from Financing | 0 | +1,500 | -713 |
What stands out: Operating cash flow swung from negative in FY24 and FY25 to positive ₹2,804 cr in FY26 — a genuine improvement driven by stronger deposit inflows. But this figure is volatile and should not be over-read. The more meaningful point is that the FY26 dividend of ~₹1,086 cr is comfortably small against ₹4,531 cr of profit and a ₹39,001 cr net worth (dividend = ~2.8% of net worth). The dividend is funded out of current earnings, not reserves, asset sales, or borrowings.
Balance Sheet Strength
Capital Adequacy (CRAR)
17.91% (Mar 2026)
CET1 15.61% — well above regulatory minimums; rose to 18.28% by Jun 2026
Asset Quality
GNPA 2.67% | NNPA 0.50%
Provision coverage ~96% — among sector best
Deposits & Business
Deposits ₹4.68 lakh cr
Total business ~₹8.12 lakh cr (+15.6% YoY); CASA 47.3%
Net Worth & Book Value
Net worth ₹39,001 cr
Book value ~₹43.1/share; stock trades at ~0.72x book
Verdict: The balance sheet is the strongest it has looked in a decade. High provision coverage (~96%), low net NPAs (0.50%), a healthy CASA ratio (47.3%) and CRAR near 18% give the bank ample capacity to keep paying — and to absorb the planned capital raise. Balance-sheet strength is not the concern here; profitability quality and dilution are.
Dividend Sustainability Analysis
| Sustainability Test | Reading (FY26) | Assessment |
|---|---|---|
| Earnings coverage (EPS / DPS) | 4.2x (EPS ₹5.00 vs DPS ₹1.20) | Comfortable |
| Payout ratio | ~24% of profit | Conservative; within RBI norms |
| Capital adequacy | CRAR 17.9% / CET1 15.6% | Ample buffer |
| Asset quality (NNPA) | 0.50% | Clears RBI dividend-eligibility bar |
Verdict: Sustainable — with watch flags
On coverage and capital, this dividend is clearly sustainable. RBI's dividend framework lets banks with NNPA below 1% and CRAR comfortably above the minimum pay dividends, and Central Bank clears both. Watch flags: (1) profitability leans on falling credit costs rather than rising core efficiency, which is finite; (2) the ₹7,000 cr capital raise and ongoing government stake sale will expand the share count, so future per-share dividends must be spread over more shares; (3) treasury income is volatile. The dividend is safe at current levels but its per-share growth is not guaranteed.
Peer Comparison
| Bank | FY26 Dividend/Share | ROA (FY26) | P/B | GNPA |
|---|---|---|---|---|
| Central Bank of India | ₹1.20 | 0.89% | ~0.72x | 2.67% |
| Indian Bank | ₹18.25 | >1% | — | — |
| Bank of Baroda | ₹8.50 (NIV) | >1% | 1.05x | — |
| Union Bank of India | ₹4.75 | >1% | 1.08x | — |
| Canara Bank | ₹4.20 | — | — | — |
| Punjab National Bank | ₹3.00 | 0.89% | — | — |
Blank cells and "(NIV)" = not independently verified from primary sources at time of writing. Peer dividends are FY26 totals as reported by exchanges/aggregators.
Where Central Bank sits: Among large PSU banks, Central Bank pays the lowest rupee dividend per share and sits in the sub-1% ROA tier (0.89%, alongside PNB, UCO and Punjab & Sind) — below the 1%+ ROA group of SBI, Bank of Baroda, Union Bank, Indian Bank and IOB. It also carries one of the sector's highest cost-to-income ratios (~58.6%), reflecting legacy branch and staffing overhang. Its optically high dividend yield is a function of the cheapest valuation (~0.72x book) in the pack, not superior distribution. The Nifty PSE basket yields ~3% versus ~1.4% for the Nifty 50, so PSU income premiums are a sector feature, not a Central Bank distinction.
Promoter Impact Analysis
Promoter (Government of India) holding
81.19% (May 2026)
Down from 89.27% in Mar 2026 — a stake sale just before the record date
Estimated dividend to the Government
~₹441 cr (this interim)
~₹882 cr for full-year ₹1.20 (at ~81% holding)
The non-obvious story: a dividend paid into a live dilution event
Because the Government owns ~81%, the vast majority of every rupee distributed flows back to the exchequer — of the ~₹1,086 cr FY26 payout, roughly ₹882 cr goes to the Government and only ~₹204 cr to all other shareholders combined. More importantly, this dividend lands in the middle of a forced reduction in that stake: SEBI's exemption allowing government banks to stay below 25% public float expires in August 2026. Government holding has already dropped from 93% (2023) to 89.27% (Mar 2026) to 81.19% (May 2026), and must fall further toward the 75% cap. Combined with the planned ₹7,000 cr capital raise, this means a steady supply of new/sold shares — an overhang that helps explain the weak share price and dilutes future per-share dividends.
Taxation Analysis
Since April 2020, dividends are taxed in the hands of the investor at their applicable income-tax slab rate (the company no longer pays Dividend Distribution Tax). Under Section 194, a company deducts TDS at 10% only if the total dividend paid to a resident shareholder in a financial year exceeds ₹5,000. Investors can file Form 15G/15H to avoid TDS if their income is below the taxable limit.
Worked example — retail investor holding 1,000 shares
| Gross dividend, this interim (1,000 × ₹0.60) | ₹600 |
| Gross dividend, full FY26 (1,000 × ₹1.20) | ₹1,200 |
| TDS under Sec. 194 (only if FY dividend > ₹5,000) | Nil (below threshold) |
| Tax at 30% slab + 4% cess on ₹1,200 | ₹374 |
| Net dividend in hand (30% slab) | ₹826 |
Post-tax effective yield for a 30%-slab investor at CMP ₹31.02 works out to ~2.66%. A lower-slab investor keeps more; a 0%-slab investor keeps the full ₹1,200.
Key Risks
- Dilution overhang. Government must cut its stake toward 75% (SEBI float exemption ends Aug 2026), plus a ₹7,000 cr capital raise is planned — both expand the share count and pressure per-share metrics.
- Profit quality depends on falling credit costs. With GNPA already at 2.67% and provision coverage ~96%, the tailwind from lower provisions is finite; future profit growth must come from core income and efficiency.
- High cost-to-income (~58.6%). Among the worst in the PSU pack — legacy branches, staffing and technology weigh on operating leverage.
- Treasury income volatility. Q4 FY26 treasury income collapsed from ₹409 cr to ₹9 cr on hardening bond yields — a swing factor for quarterly profits.
- Low ROA (0.89%). Below the 1% mark that peers like SBI, BoB and Indian Bank clear, indicating weaker per-rupee-of-assets returns.
- Interest-rate / margin risk. NIM (~2.96%) is sensitive to the rate cycle and deposit competition; CASA has eased slightly.
What To Monitor
- Timing and size of the government stake sale / QIP and its effect on the share count and price (float must widen before Aug 2026 or an extension is sought).
- Net interest margin trend — whether NIM holds near 3% as deposit costs move.
- Cost-to-income ratio — any structural improvement below ~55% would materially lift ROA.
- Slippages and fresh NPAs — the credit-cost tailwind only lasts while asset quality keeps improving.
- FY27 dividend cadence — whether the quarterly-interim pattern and the per-share amount are maintained after dilution.
- Return on assets crossing 1% — the key marker of Central Bank closing the gap with stronger PSU peers.
Conclusion
Positives
FY26 dividend up 6.4x to ₹1.20; profit +15% despite a ₹632 cr tax hit; asset quality (NNPA 0.50%, coverage ~96%) and capital (CRAR ~18%) at decade-best; payout conservative at ~24% with 4.2x earnings cover; cheapest valuation among PSU peers (~0.72x book).
Negatives & Caveats
Lowest rupee dividend and sub-1% ROA among large PSU banks; highest-in-class cost-to-income (~58.6%); optically high yield driven by a ~15% price fall, not generosity; heavy government ownership (~81%) means most of the payout returns to the exchequer; dilution overhang from the mandated stake sale and ₹7,000 cr raise.
Bottom line: The dividend is safe and the turnaround is real, but Central Bank remains an early-stage, improving payer rather than a dependable income compounder — and its headline yield says as much about a de-rated share price and dilution overhang as it does about shareholder generosity. This is an analysis, not advice; positives, negatives, risks and monitoring points are presented so readers can decide for themselves.
Frequently Asked Questions
What dividend has Central Bank of India announced?
What is the dividend yield on this payout?
What is the record date?
What is the ex-dividend date?
When will the dividend be paid?
Who is eligible to receive it?
How is this dividend taxed?
Is the dividend sustainable?
What is Central Bank of India's dividend history?
Why does most of the dividend go to the Government?
How does Central Bank compare with other PSU banks on dividends?
What should investors monitor going forward?
Why did Q4 FY26 profit fall even though full-year profit rose?
Disclaimer
This article is published by ShareBazaar Online for informational and educational purposes only and is not investment advice. It does not constitute a buy, sell or hold recommendation. ShareBazaar Online is not a SEBI-registered investment adviser. Financial figures are drawn from company filings and public sources believed to be reliable; certain items are inferred or not independently verified and are labelled accordingly. The current market price and dividend yield change continuously and must be re-verified before any decision. Dividend dates, taxation and eligibility are subject to statutory and company confirmation. Readers should consult a qualified financial adviser and conduct their own due diligence. Investments in securities are subject to market risks.