
Dividend Snapshot
Dividend Announcement Summary
At its Board Meeting held on 24 July 2026 (1:30 PM to 3:38 PM), the Board of Omax Autos Limited recommended a Final Dividend of ₹2.50 per equity share (25%) of face value ₹10, out of the profits for the financial year 2025–26.
The dividend is subject to shareholder approval at the 43rd Annual General Meeting scheduled for 29 August 2026. Under the Companies Act, 2013, the final dividend must be paid within 30 days of its declaration (i.e., of the AGM date).
Alongside the dividend, the Board approved unaudited Q1 FY27 results (quarter ended 30 June 2026), re-appointed cost auditors M/s JSN & Co. for FY27, and re-appointed Mr. Tavinder Singh (Whole-Time Director) and Mr. Nipun Khurana (Independent Director).
Regulatory basis: Declared under SEBI (LODR) Regulations 30 & 33; record date fixed under Regulation 42. Statutory auditors BGJC & Associates LLP issued an unmodified limited-review conclusion on the Q1 FY27 results.
Key Dates Timeline
† Ex-date is not separately disclosed by the company. Under the current T+1 settlement cycle, the ex-date typically coincides with the record date (21 August 2026). To be verified against the exchange corporate-action circular before publishing.
‡ Exact payment date Not Disclosed by Company. Figure shown is the statutory outer limit (30 days from AGM declaration).
Dividend Yield Analysis
Yield on the current final dividend (₹2.50)
Yield on FY26 total dividend (₹5.00)
Yield Reality Check — read this before quoting the headline number
Part of the “improvement” in yield is not because the dividend grew — it is because the share price fell. Omax closed at ₹226.42 on the 24 July announcement day but at roughly ₹181 on 4 August 2026 — a ~20% drop in about ten sessions, and roughly 32% below its 52-week high of ₹266. A rising yield driven by a falling price is a warning to inspect, not a reward to celebrate. The 2.76% trailing figure also blends two separate dividends (interim + final), so it overstates what a buyer today locks in on the current event alone.
Live CMP must be re-verified at publish time; yield figures become stale quickly. Prices sourced from NSE/Screener.in.
Dividend History Analysis
| Financial Year | Dividend / Share | % of Face Value | Payout Ratio |
|---|---|---|---|
| FY26 (current) | ₹5.00 (₹2.5 interim + ₹2.5 final) | 50% | ~29% |
| FY25 | ₹2.50 | 25% | 25% |
| FY24 | ~₹1.00 (dividend resumed) | 10% | 18% |
| FY17 – FY23 | NIL (7 years) | 0% | 0% |
| FY16 | ₹1.00 | 10% | 27% |
Payout ratios per Screener.in. Individual DPS split for FY24 partly inferred from payout ratio; record-date events cross-checked with TipRanks / exchange filings.
Classification: Irregular / Recently-Resumed Payer — not a consistent compounder. The most important fact in this table is the seven-year gap (FY17–FY23) when Omax paid no dividend at all while it restructured — a period that included the closure of its Automax Gurgaon unit (2017) and losses in FY21 and FY23. Dividends only resumed in FY24. The recent step-up to ₹5.00 is real and encouraging, but investors should treat the current generosity as a young, turnaround-driven policy rather than a two-decade track record.
Financial Performance Analysis
| ₹ Crore | FY24 | FY25 | FY26 | Growth (FY26) |
|---|---|---|---|---|
| Revenue from Operations | 355 | 369 | 484 | +31% |
| Operating Profit | 25 | 32 | 50 | +56% |
| Other Income | 40 | 42 | 35.5 | — |
| Net Profit (PAT) | 12 | 21.6 | 37.0 | +72% |
| EPS (₹) | 5.45 | 10.08 | 17.32 | +72% |
| Operating Margin | 7% | 9% | 10.3% | — |
The finding behind the headline: two-thirds of pre-tax profit is NOT from making auto parts
FY26 pre-tax profit (before exceptional items) was ₹51.5 crore — but ₹35.5 crore (69%) of that came from Other Income (treasury/interest/investment income), not from the core sheet-metal business. Strip it out and the operating business generated only about ₹16 crore of pre-tax profit. The same pattern repeats in Q1 FY27, where other income was 58% of pre-tax profit. The operational turnaround is genuine (margins have expanded from 7% to 10%+), but a large share of reported EPS depends on non-operating income that can be lumpy year to year. This is exactly why an independent research checklist flags Omax’s earnings quality.
Context matters: Omax is a turnaround story. Sales collapsed from ₹1,179 crore (FY18) to just ₹161 crore (FY21) as it exited its old two-wheeler component business, then rebuilt around commercial-vehicle, railway and heavy-fabrication customers. Today’s growth is off a low base — impressive in percentage terms, but the 10-year sales CAGR is still negative (~-7%).
Cash Flow Analysis
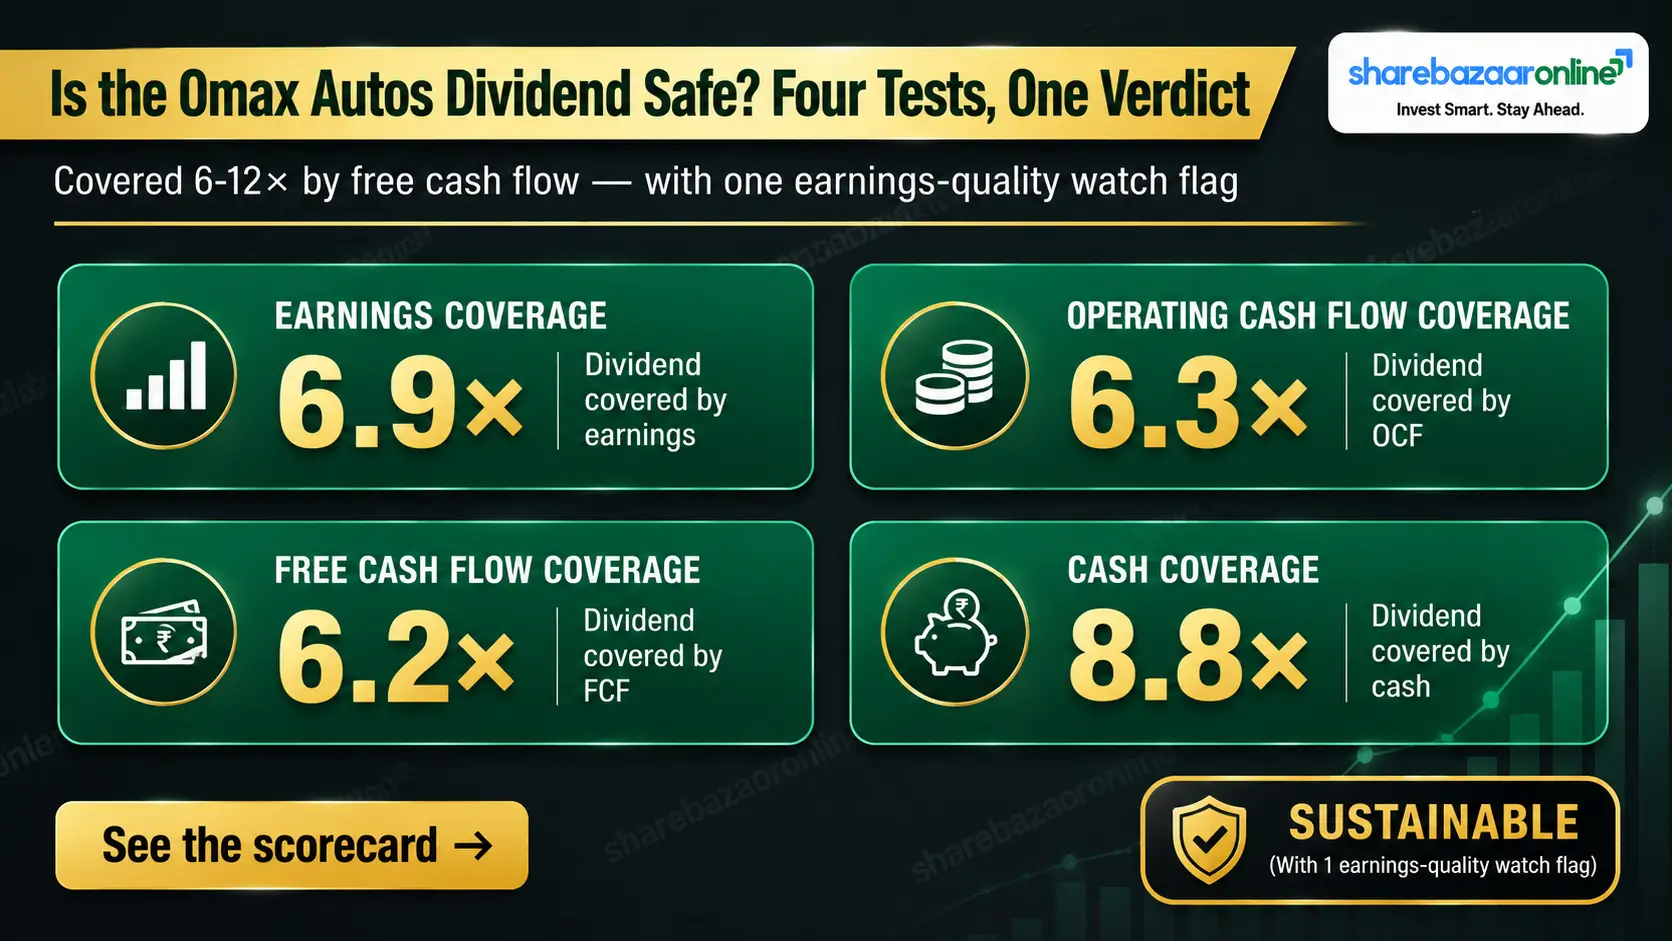
This is the genuinely strong part of the story. Unlike many companies whose profits are “paper”, Omax converts profit into cash: FY26 operating cash flow of ₹67 crore comfortably exceeded net profit of ₹37 crore (a CFO-to-operating-profit ratio of 126%). Capex is light, so free cash flow was ~₹66 crore. Even the full-year ₹5.00 dividend (₹10.7 crore) is covered 6–12 times over by free cash. The dividend is being funded from current cash generation, not borrowings or asset sales. Helped by negative working-capital days (supplier-financed), receivables are tightly controlled at just 11 debtor days.
Balance Sheet Strength
Omax has steadily deleveraged, cutting borrowings from ₹118 crore (FY24) to ₹53 crore (FY26). With cash and investments of about ₹94 crore exceeding debt, the company sits on a net-cash footing — the balance sheet can easily absorb the dividend. One watch item: contingent liabilities of ₹137 crore equal roughly 40% of net worth; while off-balance-sheet, these merit monitoring in the annual report notes.
Dividend Sustainability Analysis
Verdict: Sustainable — with one earnings-quality watch flag
On all four tests — earnings, operating cash flow, free cash flow and balance-sheet cash — the dividend clears with wide margins. The ~29% full-year payout ratio leaves ample room. The single caveat: a meaningful chunk of the earnings that fund the payout is Other Income, which is less predictable than core operating profit. If treasury income normalises lower and CV demand softens together, future growth in the dividend (not the current dividend) could slow.
Peer Comparison
| Company (CV / Sheet-Metal Ancillary) | Mkt Cap | Div Yield | ROCE | ROE | Net Debt |
|---|---|---|---|---|---|
| Omax Autos | ~₹382 cr | 2.76%* | 15.4% | 9.3% | Net cash |
| Jamna Auto Industries | ~₹5,600 cr | ~2.2% | NV | NV | ~Debt-free |
| Jay Bharat Maruti | ~₹1,227 cr | NV | NV | NV | NV |
*Omax yield on trailing FY26 total ₹5.0 at ₹181. “NV” = Not Independently Verified from primary sources at time of writing — cells intentionally left unfilled per sourcing discipline. Peer data: Screener.in / INDmoney / Value Research. Confirm each cell before publishing.
Within the commercial-vehicle ancillary space, Jamna Auto (leaf springs, ~62–65% domestic CV market share) is the quality benchmark and near debt-free; Jay Bharat Maruti is the closest sheet-metal comparable (also Gurugram-based). Omax screens cheap on valuation (P/E ~9–13, P/B ~1.1–1.4 vs peer medians well above), reflecting its smaller size, turnaround history and thinner trading liquidity rather than a pure bargain.
Promoter Impact Analysis
The promoter (Mehta family) holds 54.63%, so a majority of every dividend rupee flows to them — of the ₹5.35 crore final payout, roughly ₹2.92 crore is promoter income. This is normal for a promoter-led company; the relevant point is alignment: promoters increased their stake in the March 2026 quarter (from ~53.2% to ~54.9%), which is generally read as a confidence signal. Institutional ownership is negligible (<1% combined), so the stock trades largely on retail flow — a driver of its recent volatility.
Taxation Analysis
Since April 2020, dividends are taxed in the hands of the shareholder at their applicable income-tax slab rate (the company no longer pays Dividend Distribution Tax). Under Section 194, the company deducts 10% TDS if a resident’s total dividend from that company in the year exceeds ₹10,000 (submit Form 15G/15H to avoid TDS if eligible; PAN not linked → 20% TDS).
Worked example — retail investor, 1,000 shares, 30% slab
| Gross dividend (1,000 × ₹2.50) | ₹2,500 |
| TDS u/s 194 (below ₹10,000 threshold) | ₹0 |
| Tax at 30% + 4% cess (on filing) | ₹780 |
| Net in-hand after tax | ₹1,720 |
| Effective post-tax yield (@ ₹181) | ~0.95% |
A larger holder with 5,000 shares would receive ₹12,500 gross — crossing the ₹10,000 threshold, so ₹1,250 (10%) TDS would be deducted at source and adjusted against final tax. Illustrative only; consult a tax adviser.
Key Risks
1. Earnings quality: ~69% of FY26 pre-tax profit came from Other Income, which is lumpy and non-operating.
2. Cyber / ransomware exposure: Omax disclosed a ransomware attack on 26 March 2026; it reported containment and restoration with no data compromise, but was still assessing potential losses.
3. CV cyclicality & customer concentration: Revenue is tied to commercial-vehicle and railway order cycles and a narrow set of Tier-1/OEM customers.
4. Governance signal: The internal auditor (Singhi Chugh & Kumar) resigned in January 2026 — worth watching in context of the cyber event.
5. Share-price volatility & liquidity: Stock rose 100%+ then fell ~20% within days; thin institutional ownership and low volumes amplify swings.
6. Contingent liabilities: ~₹137 crore (~40% of net worth) sit off the balance sheet.
7. History of interruption: Dividends were suspended for seven years (FY17–FY23); the payer track record is short.
What To Monitor
1. Core operating margin: Can the sheet-metal business keep operating margins near/above 10% without leaning on Other Income?
2. Other-income mix: Track what share of PBT is treasury vs operations each quarter — falling reliance is the bullish signal.
3. Order book / CV & railway demand: New OEM orders, railway fabrication wins and CV production data.
4. AGM outcome (29 Aug 2026): Final dividend requires shareholder approval — confirm it passes.
5. Cyber-incident financial impact: Any disclosed loss quantification in upcoming filings/annual report.
6. Debt & cash trajectory: Continued deleveraging and growth in the investment book support future dividends.
Conclusion
The Positives
Omax has raised FY26 dividends to ₹5.00 per share (50%) — its most generous year in over a decade — funded by real free cash flow (₹66 crore), backed by a net-cash balance sheet, falling debt, expanding margins and rising ROCE (~15%). Promoters added to their stake. On all four sustainability tests, the current payout is well covered.
The Negatives & Risks
A large slice of reported profit rests on Other Income (~69% of pre-tax profit), not core operations. The dividend record is short and previously interrupted for seven years. A recent ransomware incident, an auditor resignation, sharp price volatility and ₹137 crore of contingent liabilities all warrant caution. The rising headline yield partly reflects a ~20% price fall, not a bigger dividend.
Omax Autos presents a cash-rich, deleveraging turnaround that is now sharing profits generously — but with earnings-quality and consistency questions that any reader should weigh for themselves. We present the facts; the decision is yours.
Frequently Asked Questions
1. What dividend has Omax Autos announced?
2. Wait — didn’t Omax already pay a dividend this year?
3. What is the dividend yield?
4. What is the record date?
5. What is the ex-date?
6. When will the dividend be paid?
7. Who is eligible for the dividend?
8. How is this dividend taxed?
9. Is the dividend sustainable?
10. What is Omax Autos’ dividend history?
11. Why has the share price fallen if the dividend went up?
12. What should investors monitor going forward?
13. Does Omax Autos have subsidiaries — consolidated or standalone?
Disclaimer
This article is published by ShareBazaar Online for informational and educational purposes only and does not constitute investment, financial, legal or tax advice, nor a buy/sell/hold recommendation. ShareBazaar Online is not a SEBI-registered investment adviser. Figures are drawn from the company’s exchange filings and public sources (NSE/BSE, Screener.in, TipRanks, INDmoney, Value Research) and may contain errors or become outdated; items marked “Not Disclosed by Company” or “Not Independently Verified” should be confirmed against primary sources. Live market price, ex-date and payment date must be re-verified before any decision. The final dividend is subject to shareholder approval at the AGM. Securities investments are subject to market risks; please consult a SEBI-registered adviser and read all related documents before investing. Past performance is not indicative of future results.