
Dividend Snapshot
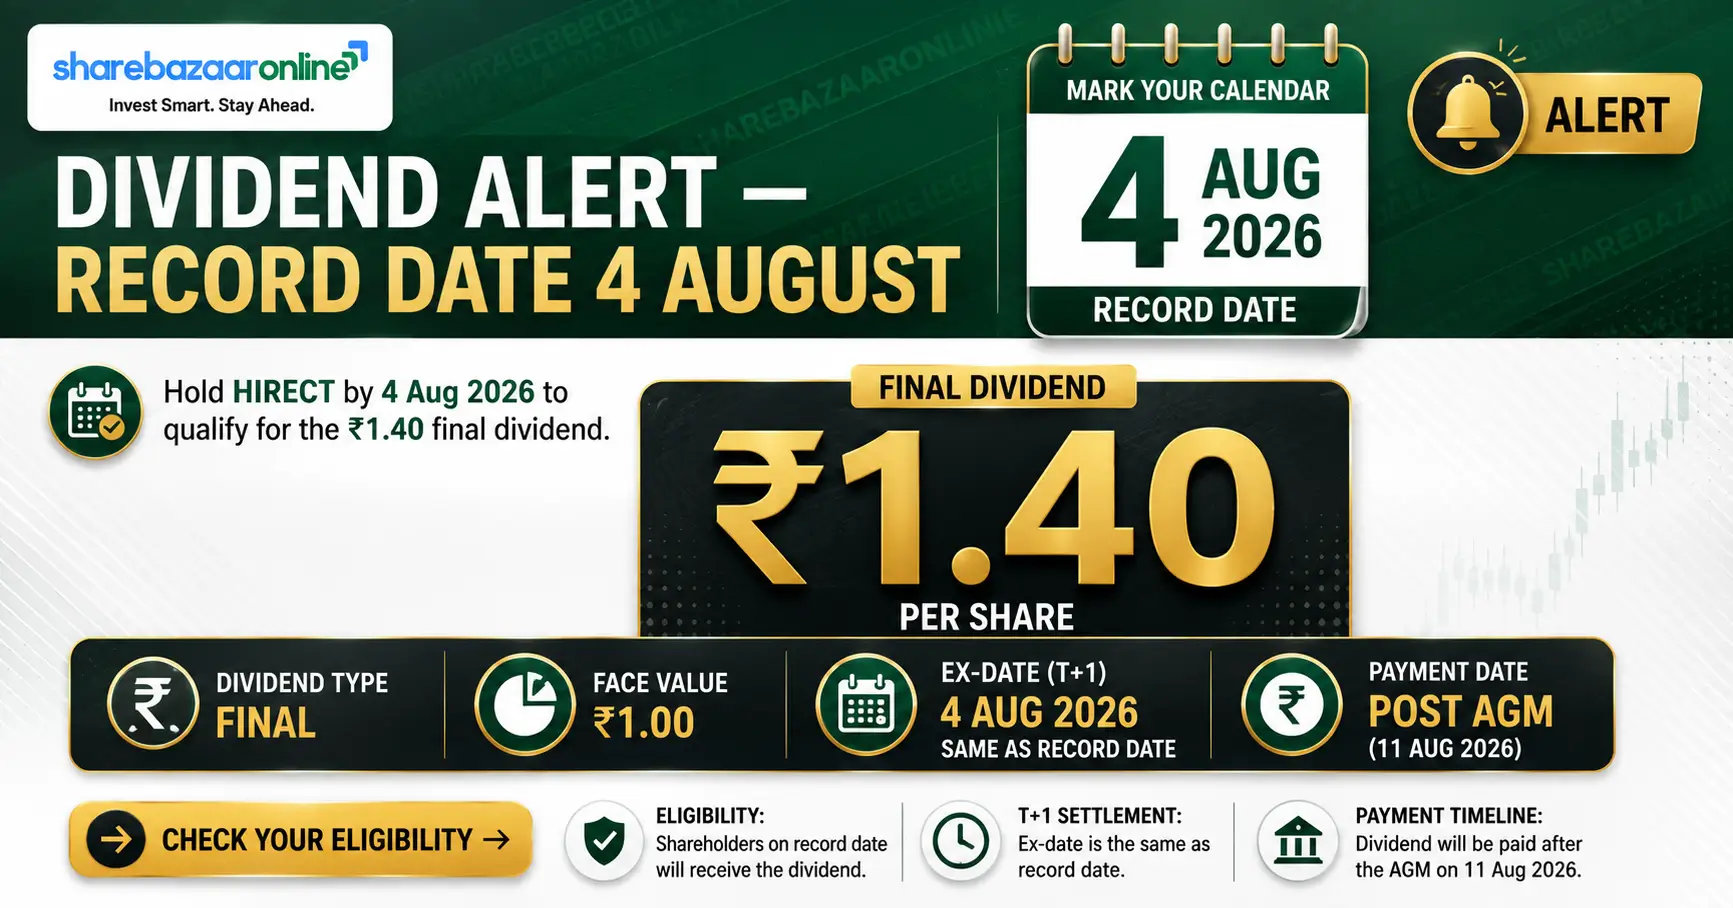
Dividend Per Share
₹1.40 (70% of ₹2 face value)
Type: Final Dividend for FY2025-26, subject to shareholder approval at the AGM.
Dividend Yield (at CMP ₹1,339)
≈ 0.10%
A token yield — this is a growth/capex stock, not an income stock. CMP must be re-verified at publish.
Record Date & Ex-Date
04 August 2026
Under T+1 settlement the ex-date coincides with the record date.
Total Dividend Outflow
≈ ₹4.81 crore
On 3,43,67,614 post-bonus shares. Payout is just ~8–11% of profit.
The finding aggregators miss
Headlines will call this a "cut" from last year's ₹2.00 to ₹1.40. It is not. Hirect issued a 1:1 bonus on 27 March 2026, doubling the share count. Adjusted to the same post-bonus base, last year's dividend equals ₹1.00 — so ₹1.40 is a 40% increase. A shareholder who held 100 shares last year (₹200) now holds 200 shares and receives ₹280.
Dividend Announcement Summary
At its board meeting on Saturday, 16 May 2026, the Board of Hind Rectifiers Limited recommended a final dividend of ₹1.40 per equity share (70% of the ₹2 face value) for the year ended 31 March 2026. The dividend is a recommendation only — it becomes payable after members approve it at the 68th Annual General Meeting, and the company has committed to pay within 30 days of that approval.
Company & Listing
- Company: Hind Rectifiers Limited (renaming to "Hirect Limited", approved by shareholders 10 Jul 2026)
- NSE Symbol: HIRECT | BSE Code: 504036
- ISIN: INE835D01023 | Face Value: ₹2
- Sector: Power electronics & railway transportation equipment
Key Terms
- Dividend: ₹1.40/share (Final)
- Prior year (FY2025): ₹2.00/share — pre-bonus base
- Bonus-adjusted prior year: ₹1.00/share
- Outflow: ≈ ₹4.81 crore
- Audit opinion: Unmodified (GMJ & Co)
Key Dates Timeline
Announcement (Board Meeting)
16-05-2026
Record Date
04-08-2026
Ex-Date (T+1 = record date)
04-08-2026
68th AGM
11-08-2026 (VC/OAVM)
Remote e-Voting Window
07-08-2026 to 10-08-2026
Payment Date
Within ~1 week of AGM
Statutory outer limit: 30 days from AGM approval
To be eligible, you must hold shares as of the record date, 04 August 2026. Because settlement is T+1, the ex-date and record date fall on the same day — buying on the ex-date does not qualify you for this dividend.
Dividend Yield Analysis
Yield at current price (₹1,339)
0.10%
₹1.40 ÷ ₹1,339. CMP as per Screener.in, ~31 Jul 2026 — re-verify at publish.
Yield at announcement price (₹945.30)
0.15%
₹1.40 ÷ ₹945.30 (NSE/BSE close 15 May 2026, last trading day before the board meeting).
Yield reality check
The yield fell from ~0.15% at announcement to ~0.10% today not because the dividend shrank, but because the share price rose ~42% between mid-May and end-July 2026. A yield this low tells you plainly: nobody owns Hirect for the dividend. The stock trades at roughly 100x earnings and 22x book value (Screener.in) — it is priced as a railway-capex growth story, and the dividend is a small signalling gesture, not a source of income.
Dividend History Analysis
| Financial Year | DPS as declared | Bonus-adjusted DPS* |
|---|---|---|
| FY2026 | ₹1.40 | ₹1.40 |
| FY2025 | ₹2.00 | ₹1.00 |
| FY2024 | ₹1.20 | ₹0.60 |
| FY2023 | Nil (skipped) | ₹0.00 |
| FY2022 | ₹0.40 | ₹0.20 |
| FY2021 | ₹0.40 | ₹0.20 |
| FY2020 | ₹0.80 | ₹0.40 |
| FY2019 | ₹0.40 | ₹0.20 |
*All pre-FY2026 figures halved to reflect the 1:1 bonus (27 Mar 2026) on a like-for-like post-bonus basis. Declared amounts and ex-dates sourced from TipRanks; FY2023 gap indicates a skipped year (Not Independently Verified as a formal suspension).
What the pattern shows
Historically irregular: payouts bounced between ₹0.20 and ₹0.40 (adjusted) through 2019–2022 and were skipped entirely in FY2023. But the last three years show a clear, rising trajectory on an adjusted basis: ₹0.60 → ₹1.00 → ₹1.40.
Classification
Irregular payer transitioning to a growing payer. The FY2023 skip means this is not yet a "consistent" dividend record, but the recent direction is unambiguously upward — and FY2026 is a genuine 40% raise, not the cut it superficially appears to be.
Financial Performance Analysis
Standalone (₹ crore) — the parent that actually pays the dividend
| Metric | FY2026 | FY2025 | Change |
|---|---|---|---|
| Revenue | 949.21 | 655.37 | +44.8% |
| Operating EBITDA | 102.50 | 70.47 | +45.5% |
| Net Profit (PAT) | 57.67 | 37.27 | +54.7% |
| Basic EPS (adj.) | ₹16.79 | ₹10.87 | +54.5% |
Look beneath the 55% profit jump
Standalone PAT grew 54.7%, but revenue and EBITDA both grew ~45%. The extra profit growth was not operational — it came largely from the tax line. Hirect adopted the concessional 25.168% regime (Section 115BAA) in FY2026, and its effective tax rate fell from ~25.9% to ~21.0%. Operating EBITDA margin was essentially flat at ~10.8% (FY2025: 10.75%). So the underlying business grew fast, but a chunk of the reported profit acceleration is a one-off tax benefit that will not repeat at the same magnitude.
The consolidated picture is materially weaker — and this is the biggest non-obvious flag
On a consolidated basis, group PAT was only ₹38.60 crore versus standalone ₹57.67 crore — a ₹19.07 crore drag from loss-making overseas subsidiaries (chiefly Elventive France / formerly Belink Hirect SAS). The consolidated fourth quarter was actually a net loss of ₹1.59 crore. Reported consolidated EPS attributable to owners was ₹13.10 — well below the standalone ₹16.79. The dividend is comfortably affordable from the standalone parent, but investors judging the "group" should note the subsidiaries are currently bleeding.
Cash Flow Analysis
Standalone (₹ crore)
- Operating cash flow: 90.68
- Capex (PPE + intangibles): (70.37)
- Free cash flow: +20.32
- Covers the ₹4.81 cr dividend: 4.2x
Consolidated (₹ crore)
- Operating cash flow: 85.81
- Capex (PPE + intangibles): (97.39)
- Free cash flow: −11.58 (negative)
- Covers the dividend: No
Cash is fact; profit is opinion
Here is the tension aggregators skip. Standalone OCF of ₹90.68 cr looks healthy — but note that operating cash was heavily drained by working capital: trade & other receivables consumed ₹136.97 cr during the year. Consolidated receivables ballooned ~125% (₹109.55 cr → ₹246.42 cr) while consolidated revenue grew only ~52%. Receivables growing more than twice as fast as sales is a cash-conversion warning: the company is booking rapid growth but collecting slowly, which is why consolidated free cash flow is negative and short-term borrowings are high.
So how is the dividend funded?
From standalone current earnings and operating cash, not from cash reserves (there are almost none) or asset sales. At the consolidated level the group is capex-negative on free cash flow and leaning on borrowings to fund growth — so the ₹4.81 cr dividend, while tiny and affordable at the parent, is being paid in a year when the group as a whole did not generate surplus cash after investment.
Balance Sheet Strength
Consolidated net worth (owners)
₹208.57 crore
Book value ≈ ₹60.7/share (Screener.in)
Consolidated total borrowings
₹236.71 crore
Of which current (short-term): ₹204.21 cr
Net debt (incl. leases)
≈ ₹239.53 crore
Cash + bank + investments only ≈ ₹5.11 cr
Return ratios (Screener.in, consol)
ROE 25.2% · ROCE 18.8%
Working-capital cycle improved to ~14.9 days from 21.3 days
Returns are genuinely strong — a ~25% ROE is excellent. But the balance sheet is working-capital heavy and thinly cushioned: net debt (~₹240 cr) now exceeds net worth, and cash on hand is negligible (₹5 cr consolidated, ₹1.4 cr standalone). The company is also raising fresh capital — a ₹100 cr preferential allotment to Tata Mutual Fund (Small Cap) at ₹920.5/share and a ₹27.36 cr convertible-warrant issue — which points to the balance sheet needing external funding to support its growth ambitions. This is a company investing aggressively, not one sitting on a cash pile.
Dividend Sustainability Analysis
| Sustainability Test | Result | Verdict |
|---|---|---|
| Earnings coverage (EPS ÷ DPS) | 12.0x standalone / 9.4x consol | Very strong |
| Payout ratio | ~8% standalone / ~11% consol | Very low (safe) |
| FCF coverage (standalone) | 4.2x | Covered |
| FCF coverage (consolidated) | Negative FCF | Not covered |
| Cash / balance-sheet coverage | Standalone liquidity ~0.3x outflow | Thin |
Overall verdict: Sustainable — but only because it is small
The dividend passes every earnings test with huge margin (a ~90% profit retention policy). It is affordable precisely because it is deliberately tiny — ₹4.81 cr against ₹57.67 cr of standalone profit. The one genuine caveat is that the group has negative consolidated free cash flow and near-zero cash reserves, so the token payout is being funded from current operating cash while the company borrows and raises equity for growth. There is no danger to this specific dividend; the watch-flag is that the group is not yet self-funding after capex.
Peer Comparison
| Company | Div. Yield | Payout | ROE | ROCE |
|---|---|---|---|---|
| Hind Rectifiers (HIRECT) | ~0.10% | ~10% | 25.2% | 18.8% |
| Transformers & Rectifiers India | ~0.08% | ~3% | 21.4% | — |
| TD Power Systems | ~0.15% | — | 24.7% | 33.4% |
| Voltamp Transformers | ~1.1% | ~31% | 21.5% | 22.9% |
Peer metrics as per Screener.in / ValueResearch / company disclosures (latest available, 2026). Blank cells = not independently verified from a primary source.
Hirect's ~0.10% yield is completely normal for this cohort. The transformer / railway power-electronics peer group — TARIL and TD Power — pays almost nothing (0.08–0.15%) because everyone is reinvesting into a booming order book. The lone genuine dividend payer here is Voltamp Transformers: debt-free, cash-rich, ~31% payout and ~1.1% yield. The contrast is instructive — Voltamp can afford a real dividend because it is net cash; Hirect cannot, because it is net debt of ~₹240 cr and pouring money into capacity. On returns, Hirect's ROE (25.2%) is best-in-peer, but TD Power's ROCE (33.4%) is higher, reflecting Hirect's heavier working-capital and debt load.
Promoter Impact Analysis
Shareholding (June 2026 quarter)
- Promoters: 43.92%
- FII / FPI: ~6.5%
- DII: ~0.2%
- Public / Retail: ~49.5%
Source: exchange shareholding pattern via Choice/Angel/Dhan.
Who gets the ₹4.81 cr
- To promoters (43.92%): ≈ ₹2.11 crore
- To public / minority (~56%): ≈ ₹2.70 crore
Promoters hold under half the company, so the majority of the payout flows to public shareholders.
Two governance points worth flagging, both neutral-to-mildly-cautionary: (1) promoter holding at 43.92% is below 50%, and part of it is pledged — promoters Suramya and Akshada Nevatia pledged 10,27,700 shares during FY26; and (2) the tiny dividend is not a promoter cash-extraction tool — at ₹2.11 cr it is immaterial, and the near-90% retention plus fresh equity raising shows management is prioritising reinvestment over promoter payouts. Notable public holders include investor Mukul Mahavir Agrawal (~1.5% as of mid-2025).
Taxation Analysis
Since the abolition of the Dividend Distribution Tax (FY2020-21), dividends in India are taxed in the hands of the shareholder at their applicable income-tax slab rate. The company deducts TDS under Section 194 at 10% — but only if your total dividend from that company in the financial year exceeds ₹5,000. (You can file Form 15G/15H to avoid TDS if your income is below the taxable limit.) For non-residents, TDS is 20% subject to DTAA relief.
Worked example — retail investor with 1,000 shares (30% slab)
| Gross dividend (1,000 × ₹1.40) | ₹1,400 |
| TDS under Section 194 | ₹0 (gross ≤ ₹5,000) |
| Tax payable at 30% slab (+ cess) | ₹420 |
| Net dividend in hand | ₹980 |
| Effective post-tax yield (at ₹1,339) | ≈ 0.073% |
Illustrative; excludes health & education cess and any surcharge. Not tax advice — consult a professional.
Key Risks
1. Loss-making subsidiaries
Overseas subsidiaries (Elventive France) dragged consolidated PAT ₹19 cr below standalone and pushed Q4 into a net loss. Until these turn around, group earnings understate the parent's performance.
2. Working-capital & cash conversion
Receivables grew ~125% vs ~52% revenue growth; consolidated free cash flow is negative and short-term borrowings are ₹204 cr. Rapid order-book growth is straining collections and liquidity.
3. Extreme valuation
At ~100x earnings and ~22x book, the stock prices in flawless execution. Any earnings disappointment (as in the Q4 consolidated loss) could trigger a sharp de-rating.
4. Customer concentration (Indian Railways)
A large share of the order book is railway/PSU-linked. Order timing, tender cycles and payment delays from a dominant customer create lumpy revenue and receivables risk.
5. Margin & input-cost pressure
EBITDA margin is thin (~10.8%). A one-time labour-code employee provision (₹2.0 cr exceptional) and rising employee/other costs show margins are vulnerable to cost inflation.
6. Equity dilution & promoter pledge
Fresh ₹100 cr preferential issue and ₹27.36 cr warrants dilute existing holders; promoters hold under 50% with a portion pledged. Growth is being part-funded by dilution.
What To Monitor
1. Subsidiary turnaround
Watch whether Elventive France / EMS subsidiaries move toward break-even and the gap between standalone and consolidated PAT narrows.
2. Receivable days & free cash flow
Track whether receivables growth re-aligns with revenue and consolidated FCF turns positive — the single most important sign of quality.
3. Order-book execution
New railway wins (Vande Metro / MEMU propulsion, CTC plant ramp-up) — conversion of order book to billed revenue and margin.
4. Debt & capital raises
Deployment of the ₹100 cr Tata MF allotment and warrant proceeds; whether net debt stabilises as capex peaks.
5. Margin trajectory
Whether the new CTC (copper conductor) backward-integration and Sinnar plant lift the ~10.8% EBITDA margin as management targets.
6. Dividend trajectory post-bonus
Whether the adjusted DPS keeps rising (₹0.60 → ₹1.00 → ₹1.40) or the FY2023-style skip recurs — the test of a durable payout policy.
Conclusion
Positives
- Dividend is a genuine 40% raise (bonus-adjusted), not a cut
- Standalone revenue +45%, PAT +55%; ROE ~25%
- Payout ~8–11% — extremely well covered by earnings
- Standalone FCF positive and covers the dividend 4.2x
- Strong railway order book and backward integration
Negatives
- Consolidated FCF negative; near-zero cash reserves
- Loss-making subsidiaries; Q4 consolidated net loss
- Receivables up ~125% vs ~52% revenue — weak cash conversion
- Net debt (~₹240 cr) exceeds net worth; ongoing dilution
- Valuation ~100x earnings leaves no room for error
The ₹1.40 dividend is safe, small, and mildly positive as a signal — but it is a footnote to the real story. Hirect is a high-growth, high-valuation railway-electronics play that is reinvesting nearly everything it earns, funding expansion partly through debt and equity, and carrying a group that is currently held back by loss-making overseas arms. Income seekers will find nothing here (0.10% yield); the case, if any, rests entirely on execution of the growth pipeline. We present the evidence; the decision is yours.
Frequently Asked Questions
What dividend has Hind Rectifiers announced for FY2026?
Is this a dividend cut from last year's ₹2.00?
What is the dividend yield?
What is the record date?
What is the ex-date?
When will the dividend be paid?
Who is eligible for the dividend?
How is the dividend taxed?
Is the dividend sustainable?
Why is consolidated profit lower than standalone profit?
What is Hind Rectifiers' dividend history?
How much does the dividend cost the company, and who benefits?
What should investors monitor going forward?
Does the AGM affect whether I get paid?
Disclaimer
This article is published by ShareBazaar Online for informational and educational purposes only. It is not investment advice and contains no buy, sell or hold recommendation. ShareBazaar Online is not a SEBI-registered investment adviser. Figures are drawn from Hind Rectifiers Limited's audited FY2026 results (16 May 2026 filing) and publicly available third-party sources (Screener.in, TipRanks, exchange filings and market data providers); some market figures such as the current market price are time-sensitive and must be re-verified before acting. Dividend, record date and payment details are subject to shareholder approval at the AGM and to any change by the company or exchanges. Securities markets are subject to market risks; please read all related documents carefully and consult a qualified financial adviser and tax professional before making any decision.