
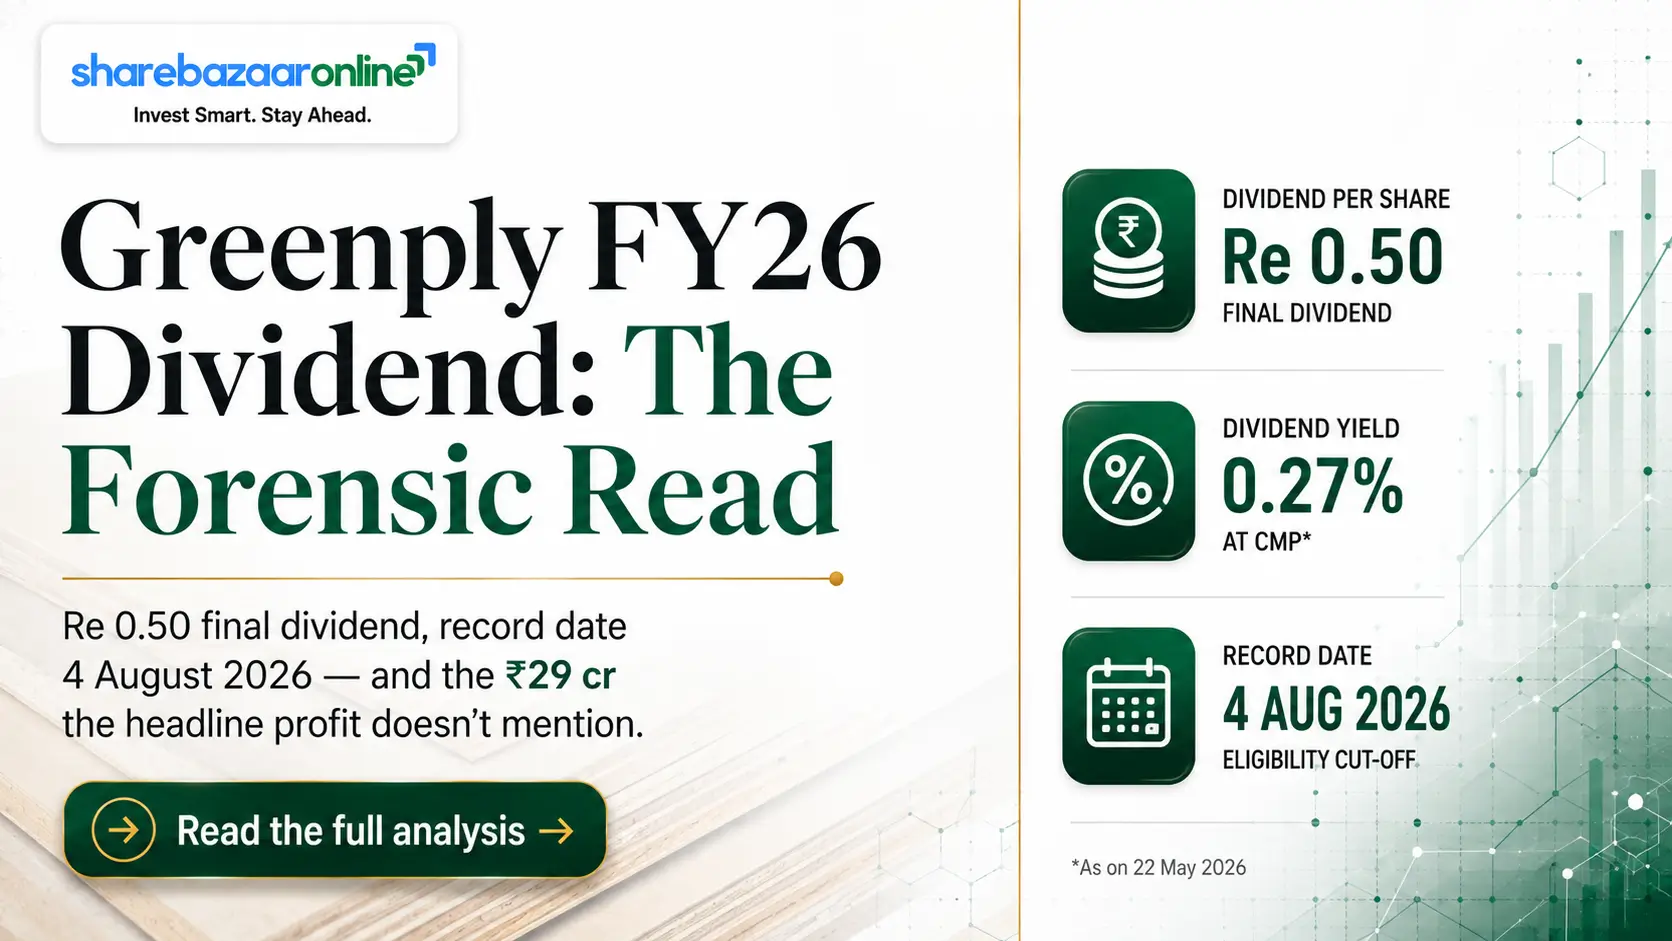
Dividend Snapshot
Company
Greenply Industries Limited
NSE: GREENPLY · BSE: 526797 · ISIN: INE461C01038
Dividend Declared
Final Dividend — Re 0.50 per share (50% of Re 1 face value)
For FY ended 31 March 2026 · Subject to AGM approval
Indicative Dividend Yield
~0.17% at CMP ~₹296
Yield moves with price — re-verify live CMP at publish
Payer Classification
Consistent Payer — but token & flat
Re 0.50 held unchanged for 5 straight years (FY22–FY26)
The one line the wire services miss: Greenply's headline consolidated profit rose to ₹119.18 cr in FY26, but the slice actually belonging to your shares — the EPS base — was only about ₹89.8 cr, and it fell 2.71% year-on-year. The dividend is backed by earnings that quietly shrank, not grew.
Dividend Announcement Summary
At its board meeting held on 28 April 2026 (11:45 a.m. to 3:55 p.m.), the Board of Directors of Greenply Industries recommended a final dividend of Re 0.50 per equity share of Re 1 each for the financial year ended 31 March 2026, under Regulation 30 of SEBI (LODR) Regulations, 2015 (company exchange filing).
Nature of dividend
Final (annual) — not interim, not special
This is the company's single yearly payout. There is no separate interim dividend history.
Approval status
Recommended — pending shareholder approval
A final dividend is only proposed by the board. It becomes payable only after members approve it at the AGM on 25 August 2026.
The company will pay the dividend within 15 days of AGM approval. Total cash going out is only about ₹6.25 cr (Re 0.50 × 12,49,02,045 shares) — a rounding error against the company's ₹2,739 cr revenue base.
Key Dates Timeline
Announcement (Board Meeting)
28 April 2026
Record Date
4 August 2026 (Tuesday)
Fixed by the company; confirm against the exchange corporate-action circular.
Ex-Date
4 August 2026
Under India's T+1 settlement, the ex-date coincides with the record date. Inferred under T+1 convention and consistent with last year's pattern.
AGM (36th)
25 August 2026, 11:00 a.m. (VC/OAVM)
Dividend is voted on here. Remote e-voting 21–24 Aug 2026.
Payment Date
Not fixed by company — "within 15 days of AGM approval"
Company commitment implies on/around early-to-mid September 2026. Statutory outer limit is 30 days from declaration. For reference, the FY25 dividend was paid 24 September 2025.
Dividend Yield Analysis
Yield at current price (~₹296)
~0.17%
Yield near announcement (~₹243, 28 Apr)
~0.21%
Yield reality check. This is a rounding-level yield. It is low for one simple reason: the payout itself is tiny (Re 0.50), not because the share price is inflated or because of any one-time distortion. A retail investor holding ₹1,00,000 of Greenply receives roughly ₹170 a year in dividend before tax. Greenply is unambiguously a growth / capital-appreciation stock, not an income stock. Live CMP must be re-checked at publish time because a rounding-level yield swings on small price moves.
Dividend History Analysis
| Financial Year | Dividend / Share | Type | Ex / Record Date |
|---|---|---|---|
| FY26 | Re 0.50 | Final | 4 Aug 2026 |
| FY25 | Re 0.50 | Final | 4 Aug 2025 |
| FY24 | Re 0.50 | Final | 5 Aug 2024 |
| FY23 | Re 0.50 | Final | 18–19 Aug 2023 |
| FY22 | Re 0.50 | Final | 18 Aug 2022 |
| FY21 | Re 0.40 | Final | 12 Aug 2021 |
| FY20 | Re 0.40 | Final | 27 Aug 2020 |
| FY19 | Re 0.40 | Final | 29 Aug 2019 |
Source: TipRanks / exchange corporate-action records. Per-share figures shown on the current Re 1 face-value basis (post the 2018–19 MDF demerger into Greenpanel Industries).
Consistency
Uninterrupted annual payer since at least FY19
No cuts, no suspensions, no skipped years in the recent record.
Growth trend
Frozen. Re 0.40 → Re 0.50 (FY22), flat since
Just one hike in eight years. The dividend has not tracked earnings, revenue, or MDF-led growth.
Verdict — Consistent Payer, but deliberately minimal. Reliability is real; generosity is not. An investor should read this dividend as a signalling gesture of shareholder friendliness, not as a meaningful cash return.
Financial Performance Analysis (Consolidated)
Revenue from operations FY26
₹2,739.04 cr (+10.11% YoY)
FY25: ₹2,487.58 cr. Total income ₹2,757.63 cr.
Reported profit for the year FY26
₹119.18 cr (+30% YoY, group)
FY25 ₹91.63 cr, FY24 ₹69.96 cr (Tijori / Screener).
The forensic catch (this is where we differ from the wires). That ₹119.18 cr "group profit" is not what accrues to a Greenply shareholder. Basic EPS is ₹7.19, which on 12,49,02,045 shares implies profit attributable to owners of the parent of only about ₹89.8 cr. The gap — roughly ₹29.4 cr, about 24.6% of group profit — belongs to minority (non-controlling) partners in Greenply's subsidiaries / JVs (notably its MDF and specialty-panel ventures). On the number that actually feeds your EPS and your dividend, Greenply's earnings fell 2.71% (EPS ₹7.39 → ₹7.19).
Operating leverage — revenue up, own-earnings flat/down. Revenue grew ~10% yet attributable EPS slipped. The drag came from (i) sharply higher interest cost as MDF/plywood capacity expansion was debt-funded, (ii) a share of loss from the wound-down Myanmar joint venture (~₹20.8 cr during the year, per company disclosure), and (iii) a larger minority slice as the specialty-panel subsidiaries turned profitable. Input-cost easing did lift gross margins, but it was not enough to offset the below-the-line pressure.
Cash Flow Analysis
Operating cash flow FY26
₹246.88 cr (+12.89% YoY)
OCF (₹247 cr) comfortably exceeds attributable PAT (₹90 cr) — a sign of healthy, non-cosmetic profits.
Free cash flow FY26
~₹142 cr (positive)
Aggregator-derived (TipRanks); not independently verified against the audited cash-flow statement.
Cash is the fact; profit is the opinion — and here the cash is strong. Unlike many mid-caps where reported profit outruns cash, Greenply's OCF of ₹247 cr is well above its attributable profit. The ₹6.25 cr dividend is funded many times over by current operating cash generation, not by reserves, asset sales, or fresh borrowing. Operating cash covers the dividend roughly 40 times; even conservative FCF covers it about 23 times.
Balance Sheet Strength
Net debt (Mar-26)
₹461 cr (up from ₹439 cr)
Debt-to-equity ~0.60x; total debt ~₹488 cr against equity ~₹809 cr.
Cash & short-term investments
Low (~₹25 cr)
Interest coverage ~4.5x (EBIT/interest).
A leveraged grower, not a cash fortress. Net debt is rising (₹439 cr → ₹461 cr) because Greenply is ploughing money into MDF and plywood capacity (Vadodara/Gujarat, a new Odisha plywood unit, and up to ₹125 cr of further equity into subsidiary Greenply Speciality Panels). This is the crucial context for the tiny dividend: with debt climbing and cash thin, management is (rationally) prioritising growth capex over payout. The ₹6.25 cr dividend is immaterial to the balance sheet either way, so it poses no solvency concern — but a bigger dividend clearly is not on the agenda while capex runs hot.
Dividend Sustainability Analysis
Test 1 — Earnings coverage
14.4x (EPS ₹7.19 vs DPS ₹0.50) ✓
Payout ratio only ~6.95% of attributable earnings.
Test 2 — OCF coverage
~40x ✓
₹247 cr OCF vs ₹6.25 cr outflow.
Test 3 — FCF coverage
~23x ✓ (FCF aggregator-derived)
Test 4 — Cash / balance-sheet coverage
~4x ✓ (cash thin, but outflow tiny)
Verdict: Sustainable — on all four tests. The Re 0.50 dividend is so small relative to earnings and cash flow that its continuation is close to certain barring a severe downturn. Watch flag: "sustainable" is not "growing." With attributable EPS having dipped and net debt rising, the realistic base case is a flat Re 0.50 payout for the foreseeable future, not a rising one.
Peer Comparison
| Company | Latest DPS | Div Yield | Payout | Note |
|---|---|---|---|---|
| Greenply Industries | Re 0.50 | ~0.17% | ~7% | Consistent, flat |
| Century Plyboards | ₹1.00 | ~0.13% | ~7% | Largest peer, semi-annual |
| Greenpanel Industries | — | ~0.17% | — | Demerged MDF sibling |
| Rushil Decor | — | Negligible | — | Small-cap, minimal payout |
Blank cells: not verifiable from primary sources at time of writing. Yields at respective recent prices. Sources: exchange filings, Screener.in, simplywall.st, INDmoney.
Context that reframes the "low yield" story. Token dividends are the norm across India's plywood / wood-panel sector, not a Greenply-specific weakness. Even sector heavyweight Century Plyboards yields only ~0.13% with a ~7% payout. This is a capex-hungry, growth-oriented industry where cash is reinvested, not distributed. Greenply's ~7% payout ratio sits right on the peer line.
Promoter Impact Analysis
Promoter holding (Jun-26)
51.9%
FIIs ~4.4%, DIIs ~31.5%, public ~12.2%.
Promoter share of the ₹6.25 cr dividend
~₹3.24 cr
Minority/public shareholders share the remaining ~₹3.01 cr.
Distribution is even-handed. With no differential/special class, the dividend is paid pro-rata; promoters take ~52% because they own ~52%. The token size means promoters are clearly not using the dividend as a cash-extraction lever — consistent with a "reinvest for growth" posture. Note also the recent DII build-up (mutual funds ~30%), which anchors the register with long-only institutional holders rather than yield-seekers.
Taxation Analysis
Since April 2020, dividends are taxed in the hands of the investor at their applicable income-tax slab rate (the old Dividend Distribution Tax is gone). The company deducts TDS at 10% under Section 194 only if a resident shareholder's total dividend from that company in the year exceeds ₹5,000 (10% threshold for resident individuals; higher/20% if PAN is not furnished). Investors with income below the taxable limit can file Form 15G/15H to avoid TDS. Non-residents are taxed per Section 195 / applicable DTAA.
Worked example — retail investor, 1,000 shares, 30% slab
| Gross dividend (1,000 × Re 0.50) | ₹500 |
| TDS @10% (dividend < ₹5,000, so none) | ₹0 |
| Tax payable @30% slab (+ applicable cess) | ₹150 |
| Net dividend in hand | ₹350 |
| Effective post-tax yield (on ~₹296 price) | ~0.12% |
Illustrative; excludes surcharge/cess nuances. Tax outcomes depend on your personal slab — consult a tax adviser.
Key Risks
1. Rising leverage against thin cash
Net debt has climbed to ~₹461 cr with cash of only ~₹25 cr and interest cover ~4.5x. Aggressive capex increases fixed-charge risk if demand softens.
2. Minority-interest dilution of headline profit
~25% of group profit already accrues to JV/subsidiary partners. As those ventures scale, reported "profit" can rise while attributable EPS lags.
3. MDF over-capacity & pricing
Industry-wide MDF capacity additions (including Greenply's own) risk margin pressure if the demand ramp lags the supply ramp.
4. Input-cost & timber-supply volatility
Gross margins swing with timber, chemical and freight costs; recent gains from easing inputs may not persist.
5. Execution & overseas / JV exposure
Multiple subsidiaries and JVs (Gabon, Singapore, ex-Myanmar) add execution and geopolitical risk; the Myanmar JV wind-down already dragged FY26. Leadership transition (CEO change) and pending litigation/tax orders (e.g., a ~₹1.67 cr WB GST demand) add minor but real noise.
What To Monitor
1. Attributable EPS, not group PAT
Track profit attributable to owners quarter-on-quarter; that is what backs the dividend and valuation.
2. MDF volume & margin ramp
Management's 25–30% MDF volume-growth and double-digit plywood-margin targets are the core thesis — watch delivery.
3. Net-debt trajectory & interest cover
Does capex-driven debt peak and roll over, or keep climbing? Interest coverage is the early-warning gauge.
4. Working-capital / receivables discipline
Screener flags inventory/working-capital heaviness; watch receivables growth vs revenue growth.
5. Any change in payout policy
A move off the frozen Re 0.50 — up or down — would be the clearest signal of how management sees its capex cycle winding down (or intensifying).
Conclusion
Greenply's FY26 final dividend of Re 0.50 is best understood as a reliability signal, not a cash return. On the positive side: an unbroken payout record, a payout consuming under 7% of earnings, operating cash flow covering the dividend ~40x, and a live growth story in MDF and plywood. On the cautious side: a rounding-level ~0.17% yield, a dividend frozen at Re 0.50 for five years, attributable EPS that actually fell 2.71% even as headline group profit jumped 30%, and net debt rising to fund capex.
The single most important takeaway — and the one most coverage misses — is that the ₹119 cr "profit" headline overstates what reaches Greenply's own shareholders by roughly ₹29 cr of minority interest. Judge the dividend, and the stock, on the ~₹90 cr attributable figure. We present the positives, negatives, risks and monitoring points; the decision is yours.
Frequently Asked Questions
What dividend has Greenply Industries announced for FY26?
What is the dividend yield?
What is the record date?
What is the ex-date?
When will the dividend be paid?
Who is eligible for the dividend?
How is this dividend taxed?
Is the dividend sustainable?
What is Greenply's dividend history?
Why did profit "rise 30%" but EPS fall?
How much dividend will I get per 100 shares?
Is Greenply a good stock for dividend income?
What should investors monitor going forward?
Disclaimer
This article is published by ShareBazaar Online for informational and educational purposes only and does not constitute investment, financial, legal or tax advice, nor a recommendation to buy, sell or hold any security. ShareBazaar Online is not a SEBI-registered investment adviser or research analyst. Dividend amounts and dates are as recommended by the board and remain subject to shareholder approval at the AGM; the ex-date is inferred under the T+1 convention and should be confirmed against the exchange corporate-action circular. Market price, yield, and financial figures are drawn from company filings and third-party sources (including Screener.in, exchange filings, TipRanks and others) believed reliable but not independently guaranteed, and can change without notice — live CMP must be re-verified before acting. Certain figures are labelled where inferred or not independently verified. Investors should conduct their own due diligence and consult a qualified adviser before making any decision. ShareBazaar Online accepts no liability for actions taken based on this content.