
Dividend Snapshot
Balkrishna Industries Limited (BKT), one of the world's leading makers of Off-Highway Tyres, has declared a Final Dividend of ₹4 per equity share (200% of the ₹2 face value) for the financial year ended 31 March 2026. The dividend was recommended by the Board on 8 May 2026 and approved by shareholders at the 64th AGM on 29 July 2026. With three interim payouts of ₹4 already made during the year, BKT's total FY26 dividend rises to ₹16 per share.
Company & Security
- CompanyBalkrishna Industries Ltd
- NSE SymbolBALKRISIND
- BSE Code502355
- ISININE787D01026
- SectorOff-Highway Tyres
- Face Value₹2
Dividend At A Glance
- Dividend TypeFinal Dividend
- Final Dividend / Share₹4 (200%)
- Total FY26 Dividend₹16 / share
- Yield (final, latest CMP)≈0.16%
- Yield (full-year FY26)≈0.65%
- Record Date17 Jul 2026
Latest CMP reference: ₹2,473.50 (NSE, 31 Jul 2026) — re-verify at publish time; yield figures move with price. Source: exchange/aggregator data, Not Independently Verified against a live terminal.
Dividend Announcement Summary
At its Board Meeting held on Friday, 8 May 2026, the Board of Directors of Balkrishna Industries approved the audited standalone and consolidated results for the quarter and year ended 31 March 2026 and recommended a final dividend of ₹4 per share (200% on ₹2 face value), subject to member approval. The auditors (Jayantilal Thakkar & Co.) issued an unmodified (clean) opinion. Shareholders ratified the dividend at the 64th AGM on 29 July 2026, alongside the appointment of Deloitte Haskins & Sells LLP as joint statutory auditor from the 64th to the 69th AGM.
What Was Approved
- Final dividend of ₹4/share for FY26.
- Audited FY26 standalone & consolidated results.
- Re-appointment of Mr. Vipul Shah as Whole-Time Director & Company Secretary (Feb 2027–Feb 2032).
- Additional capex of ₹2,000 crore for capacity, carbon-black and AI-enabled automation.
Why It Matters
The final dividend is small (₹4), but it caps a year in which BKT continued a consistent quarterly-plus-final payout rhythm even as reported profit fell. The bigger story sits alongside the payout: a ₹3,000 crore capex year that reshaped the company's near-term free-cash profile (see Cash Flow Analysis).
Key Dates Timeline
| Event | Date | Note |
|---|---|---|
| Board Announcement | 8 May 2026 | Final dividend recommended |
| Record Date | 17 Jul 2026 (Fri) | Confirmed via Reg. 42 intimation |
| Ex-Date | 17 Jul 2026 | Same as record date under T+1 settlement — confirm against exchange corporate-action circular |
| AGM (Approval) | 29 Jul 2026 (Wed) | Dividend approved by members |
| Payment Date | On/after 29 Jul 2026 | Within statutory 30 days of AGM (≈ by 28 Aug 2026) |
Under India's T+1 settlement, the ex-date and record date typically fall on the same trading day. Payment date is bounded by Section 124/127 of the Companies Act, 2013 (within 30 days of declaration). Exact credit date: Not Disclosed by Company.
Dividend Yield Analysis
Yield Maths
- Final ₹4 ÷ CMP ₹2,473.500.16%
- Full-year ₹16 ÷ CMP ₹2,473.500.65%
- Final ₹4 ÷ announce price ₹2,258.400.18%
- Full-year ₹16 ÷ announce price0.71%
The Reality Check
BKT is not a yield stock. Even counting the full ₹16 annual payout, the yield is well under 1%. That is by design: BKT trades at a growth-style multiple (P/E ≈ 33–35), so the price base is large relative to the dividend. The yield is low because the share price is high, not because the payout was cut — the ₹4 final has been steady for years.
CMP ₹2,473.50 (NSE, 31 Jul 2026) and announce-window price ₹2,258.40 (NSE close, 7 May 2026) sourced from exchange/aggregator data — re-verify live at publish. Yields computed by ShareBazaar Online.
Dividend History Analysis
| Financial Year | Total Dividend / Share | Structure |
|---|---|---|
| FY2025-26 | ₹16 | 3 interim ₹4 + final ₹4 |
| FY2024-25 | ₹16 | 4 payouts of ₹4 |
| FY2023-24 | ₹16 | Multiple interim + final |
| FY2022-23 | ≈₹15 | Interim + final (approx) |
| FY2020-21 | ₹17 | ₹12 interim + ₹5 final |
Recent years verified from company filings and dividend-history aggregators (TipRanks/Trendlyne/INDmoney). Some earlier-year totals marked "approx" / Not Independently Verified.
Classification: Consistent Payer
BKT is a Consistent Dividend Payer. It has paid a steady stream of quarterly-style interim dividends plus a final for many years, with no cuts or suspensions in the recent record and a broadly stable ₹15–₹17 annual band. Importantly, the FY26 payout was held flat even as profit fell ~25% — a signal of management's commitment to distribution stability rather than mechanically linking dividends to a soft profit year.
Financial Performance Analysis
| Consolidated (₹ Cr) | FY26 | FY25 | Change |
|---|---|---|---|
| Revenue from Operations | 10,823.08 | 10,446.95 | +3.6% |
| EBITDA | 2,300.43 | 2,457.60 | −6.4% |
| EBITDA Margin | 21.3% | 23.5% | −220 bps |
| Other Income | 251.83 | 538.79 | −53.3% |
| Profit Before Tax | 1,643.68 | 2,187.39 | −24.9% |
| Net Profit (PAT) | 1,243.10 | 1,654.96 | −24.9% |
| EPS (₹) | 64.30 | 85.61 | −24.9% |
Operating Leverage: Revenue Up, Profit Down — Here's Exactly Why
Revenue rose 3.6% yet PAT fell 24.9%. This is not a demand collapse — it is a margin + non-operating income story. Our reconstruction of the ₹543.7 Cr PBT decline:
- Other income −₹287 Cr — the single largest driver. Treasury/forex swung, including a ₹45 Cr Q4 mark-to-market investment loss and unrealised FX losses.
- Operating EBITDA −₹157 Cr — margin squeezed from 23.5% to 21.3% on higher input/other costs.
- Depreciation +₹94 Cr (−₹94 Cr to PBT) — the capex cycle is now flowing through the P&L.
- Finance cost −₹5 Cr impact — broadly stable.
Net takeaway: more than half the profit fall came from lower other income (treasury/FX), not from the tyre business weakening. The core operation still grew volumes and revenue.
Cash Flow Analysis
Reported profit is an opinion; cash is a fact. On the cash side, BKT's story is actually stronger than its P&L — but with one important caveat this year.
Cash Flow (Consolidated, ₹ Cr)
- Operating Cash Flow FY262,249.32
- Operating Cash Flow FY251,764.14
- OCF growth+27.5%
- Capex (PPE purchase)3,003.29
- Free Cash Flow FY26−753.97
- Free Cash Flow FY25+281.14
The Non-Obvious Finding
Despite PAT falling 25%, operating cash flow rose 27.5% — cash conversion (OCF ₹2,249 Cr vs PAT ₹1,243 Cr) is strong, confirming earnings quality. But FY26 free cash flow turned negative at −₹754 Cr because capex nearly doubled to ₹3,003 Cr. So the ₹309 Cr of dividends paid this year were funded from operating cash and reserves — not from free cash flow. This is affordability, not earned free cash, and it is the fact aggregator coverage tends to skip.
How the dividend was funded: from strong current earnings and cash reserves — and, this year, not from free cash flow, because heavy growth capex consumed all operating cash. Borrowings did rise during the year, largely to fund the expansion, not the payout.
Balance Sheet Strength
Key Balance Sheet Items (₹ Cr)
- Total Equity / Net Worth10,955.29
- Cash + Bank64.51
- Current + Non-current Investments3,123.96
- Total Investible Liquidity≈3,188
- Total Borrowings4,105.56
- Net Debt (incl. investments)≈917
Strength Ratios
- Debt-to-Equity0.37x
- ROE (FY26)11.35%
- ROCE (FY26, computed)≈11.8%
- Interest Service Coverage≈70x
- Current Ratio1.01x
The balance sheet remains comfortably solid: low leverage (D/E 0.37x), interest cover near 70x, and roughly ₹3,188 Cr of cash and investments against ₹4,106 Cr of borrowings — a modest net-debt position that becomes near net-cash once investments are counted. Watch flag: borrowings rose materially in FY26 (current borrowings alone climbed to ₹3,218 Cr from ₹2,875 Cr) to bankroll the capex programme, and ROE/ROCE have drifted into the low-11% range — below the company's historical double-digit-teens returns.
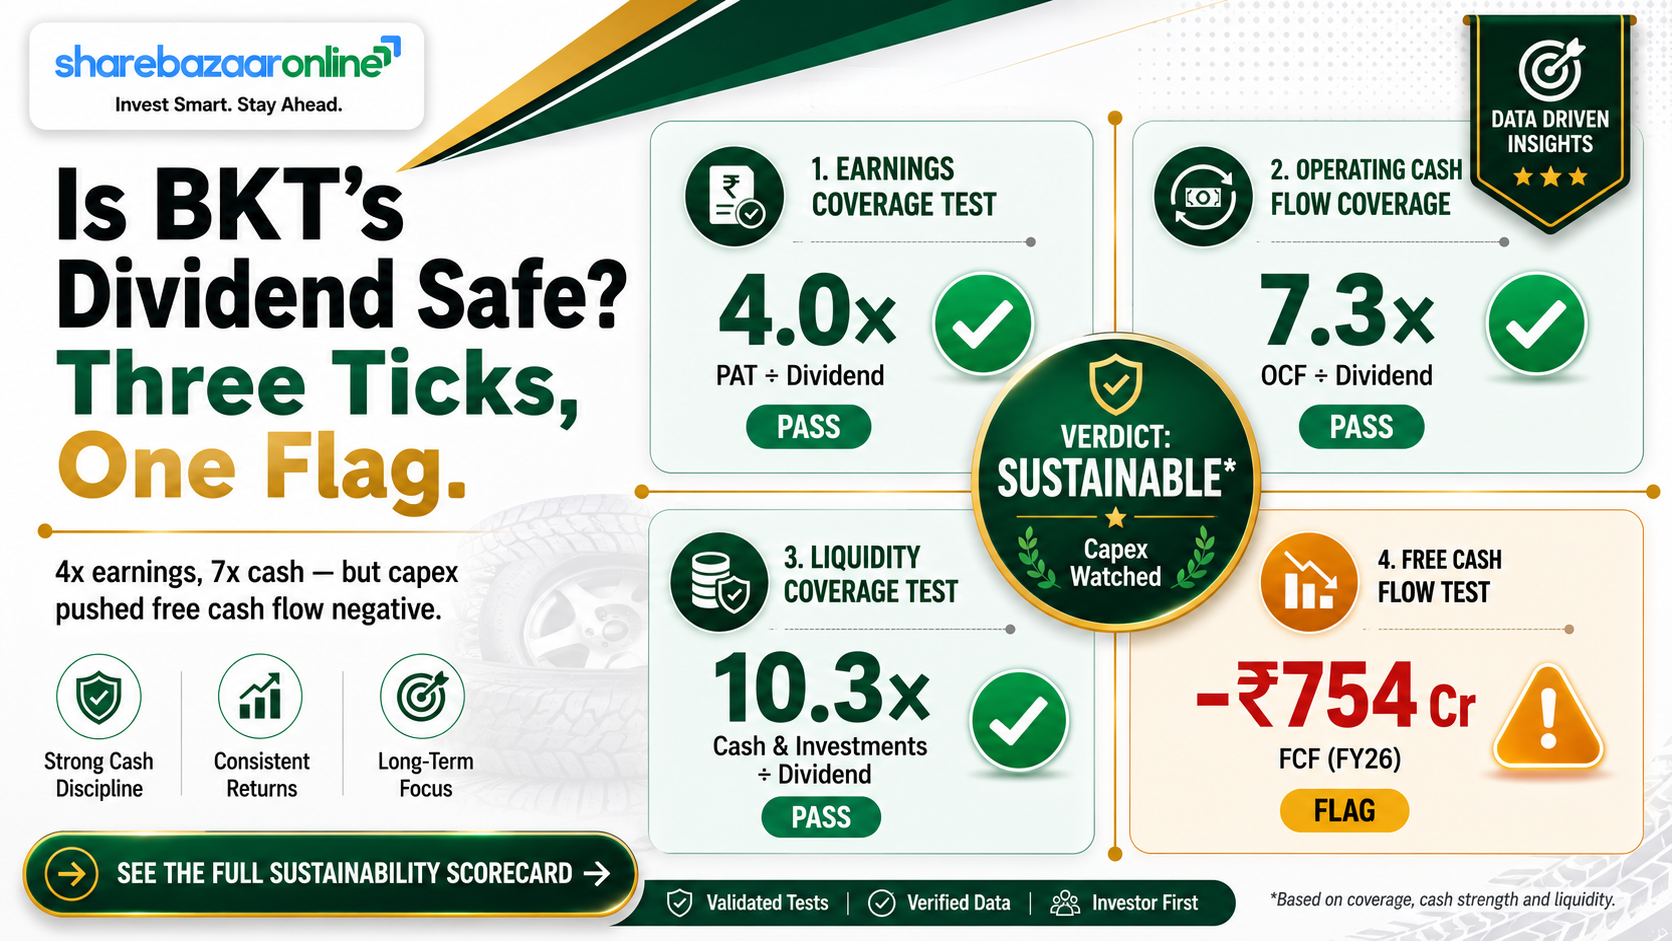
Dividend Sustainability Analysis
| Sustainability Test | Metric | Verdict |
|---|---|---|
| Earnings coverage (EPS vs total DPS) | ₹64.30 vs ₹16 → 4.0x | Strong |
| Payout ratio (total FY26) | 24.9% of PAT | Conservative |
| Operating cash coverage | OCF ₹2,249 Cr vs ₹309 Cr → 7.3x | Strong |
| Free cash flow coverage | FCF −₹754 Cr | Not covered (capex year) |
| Cash / balance-sheet coverage | ≈₹3,188 Cr liquidity → 10.3x | Strong |
Overall Verdict: Sustainable (with a capex watch-flag)
The ₹16 annual dividend passes three of four tests comfortably — it is covered 4x by earnings, 7x by operating cash and 10x by liquidity. The one caution is the negative FCF in FY26: while the payout is easily affordable today, a multi-year heavy-capex phase (a further ₹2,000 Cr approved) means the dividend is being met from cash generation and reserves rather than surplus free cash. As long as capex normalises and margins hold, the dividend looks Sustainable.
Peer Comparison
| Company | Latest Annual Div/Share | Div Yield | Payout | ROE |
|---|---|---|---|---|
| Balkrishna Industries | ₹16 | ≈0.65% | 24.9% | 11.4% |
| MRF | ₹235 | ≈0.2% | ≈5.3% | |
| Apollo Tyres | ₹5 | ≈0.97% | ≈28% | 5.8% |
| CEAT | ₹35 | ≈0.81% | 10.2% | |
| JK Tyre | ₹3 | ≈15.9% |
Peer figures from public aggregators/company disclosures; blank cells = Not Independently Verified from primary source. Face values differ (BKT/Apollo/CEAT/JK ₹2–₹10; MRF ₹10), so per-share dividends are not directly comparable — use yield and payout.
Across the tyre pack, dividend yields cluster below 1% — this is a capex-heavy, growth-reinvesting industry, not an income sector. BKT sits mid-pack on yield and payout, with a higher ROE than Apollo and roughly in line with CEAT. MRF's headline ₹235 dividend looks large but reflects its ₹10 face value and very high share price — its yield (≈0.2%) is the lowest and payout the thinnest.
Promoter Impact Analysis
Distribution Split
- Promoter holding58.29%
- Total FY26 dividend outflow₹309.28 Cr
- Promoter share (full year ₹16)≈₹180.3 Cr
- Promoter share (final ₹4 only)≈₹45.1 Cr
- Minority/public share (full year)≈₹129.0 Cr
Interpretation
With a 58.29% promoter stake, roughly ₹180 Cr of the ₹309 Cr full-year payout flows to the Poddar promoter group. This is pro-rata and non-discriminatory — every shareholder receives the same ₹16/share. Because the payout ratio is conservative (24.9%), the dividend is not a mechanism to strip cash; the bulk of profit is retained and reinvested into the capacity build-out that both promoters and minority holders benefit from.
Promoter holding ≈58.29% is consistent across sources; FII (~11%) and DII (~20%) splits vary by source/date and are Not Independently Verified against the exchange shareholding filing.
Taxation Analysis
Since the abolition of the Dividend Distribution Tax (FY21), dividends are taxable in the hands of the shareholder at their applicable income-tax slab rate. Under Section 194, the company deducts TDS at 10% if the total dividend paid to a resident shareholder in a financial year exceeds ₹5,000 (10% only where PAN is available; 20% otherwise). Investors below the taxable threshold can file Form 15G/15H to avoid TDS.
Worked Example — Retail Investor
Assume 1,000 BKT shares; 30% tax slab.
| Item | Final ₹4 only | Full-year ₹16 |
|---|---|---|
| Gross dividend | ₹4,000 | ₹16,000 |
| TDS @10% (if >₹5,000/yr) | ₹0 (below threshold) | ₹1,600 |
| Tax @30% slab | ₹1,200 | ₹4,800 |
| Net in hand (after slab tax) | ₹2,800 | ₹11,200 |
On the full ₹16,000 gross, a 30%-slab investor keeps ₹11,200 — an effective post-tax yield of only ≈0.45% on the current share price. TDS is an advance credit, adjustable against final tax liability at filing.
Key Risks
- Margin compression: EBITDA margin already slipped 220 bps to 21.3% on rising raw-material (natural rubber, carbon black, crude-linked) and energy costs; management flags further near-term input pressure.
- Heavy capex & negative FCF: ₹3,003 Cr spent in FY26 plus a further ₹2,000 Cr approved. Until this normalises, free cash flow stays pressured and borrowings can keep rising.
- Export/FX and tariff exposure: BKT sells in 160+ countries; ~80%+ of revenue is exports. Currency swings drove the FY26 other-income fall, and US reciprocal tariff developments add demand uncertainty.
- Earnings volatility: PAT fell ~25% in FY26 and a big chunk came from non-operating (treasury/FX) items — making reported profit lumpy quarter to quarter.
- Valuation risk: at a P/E of ~33–35 the stock is priced for consistent execution; any earnings miss risks a disproportionate de-rating and can further depress an already sub-1% yield.
What To Monitor
- Capex pace & FCF turn: when does the ₹3,000 Cr+ spend peak, and does free cash flow return to positive? This is the single biggest driver of future dividend headroom.
- EBITDA margin recovery: track whether margins claw back toward the historical 25–30% band as pricing offsets input costs.
- Volume growth & new segments: off-highway volume trajectory plus the on-highway/PCR and advanced carbon-black entries flagged in the FY27 outlook.
- Borrowings & net debt: watch whether the capex-driven debt build reverses once expansion completes.
- Payout policy in a soft year: whether BKT holds ₹16/share again if FY27 profit stays subdued — a test of dividend-stability intent.
Conclusion
Balkrishna Industries' ₹4 final dividend (₹16 for the full year) is a consistency signal, not an income opportunity. The yield is sub-1% because the stock is a growth-priced compounder, and the payout was held steady through a year when profit fell ~25%.
The positives: 4x earnings cover, 27.5% growth in operating cash flow, strong cash conversion, low leverage and a decade-plus record of uninterrupted payouts. The negatives/watch-items: a 24.9% PAT decline (largely treasury/FX-driven), a 220-bps margin squeeze, and — most notably — negative free cash flow of ‑₹754 Cr as capex nearly doubled, meaning this year's dividend was funded from operating cash and reserves rather than surplus free cash.
For dividend-focused readers, BKT is best understood as a Consistent Payer with a Sustainable-but-capex-watched dividend. The distribution is safe on today's numbers; its future growth depends on capex normalising and margins recovering.
Frequently Asked Questions
What dividend has Balkrishna Industries announced?
What is the dividend yield?
What is the record date for the dividend?
What is the ex-date?
When will the dividend be paid?
Who is eligible for the dividend?
How is the dividend taxed?
Is the dividend sustainable?
Why did profit fall while revenue rose?
What is BKT's dividend history?
How does BKT compare with MRF, Apollo and CEAT on dividends?
What should investors monitor going forward?
Disclaimer
This article is published by ShareBazaar Online for informational and educational purposes only and does not constitute investment, financial, legal or tax advice, nor any buy/sell/hold recommendation. ShareBazaar Online is not a SEBI-registered investment adviser. Financial data is drawn from Balkrishna Industries' audited FY26 results (Board Meeting outcome dated 8 May 2026) and its exchange filings; market prices, yields, shareholding and peer figures are sourced from public exchanges and aggregators and may be delayed, approximate or subject to revision — several are marked "Not Independently Verified." Live CMP, the exact ex-date and payment date must be confirmed against NSE/BSE corporate-action circulars before acting. Dividends are subject to shareholder approval, statutory deductions and applicable tax laws, which vary by individual. Securities investments are subject to market risks; please read all related documents carefully and consult a qualified professional before investing. ShareBazaar Online and its authors accept no liability for any loss arising from the use of this information.