
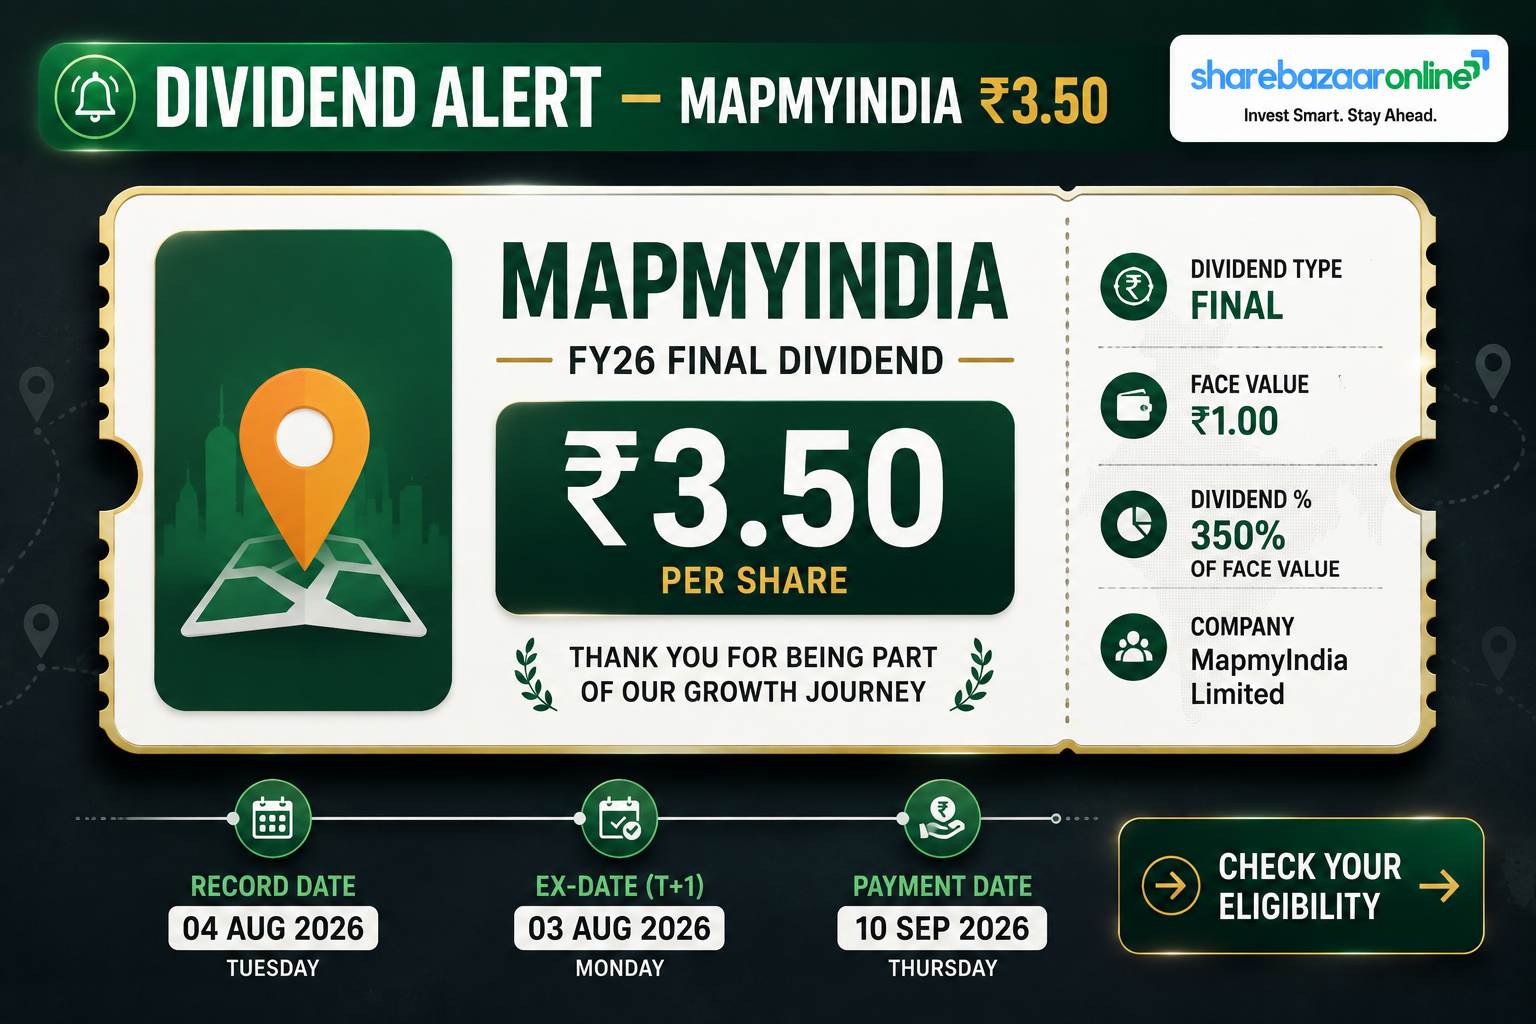
Dividend Snapshot
Company
C.E. Info Systems Limited (MapmyIndia / Mappls)
NSE: MAPMYINDIA · BSE: 543425 · ISIN: INE0BV301023
Dividend Declared
₹3.50 per share · 175% of face value ₹2
Final Dividend for FY2025-26 (subject to AGM approval)
Dividend Yield
~0.30% at CMP ₹1,181.65
CMP as on 03-Aug-2026 (NSE). Re-verify at publish — yields move with price.
Key Dates
Record & Ex-Date: 04 Aug 2026 · Payment: 10 Sep 2026
AGM: 11 Aug 2026 (VC/OAVM)
At a glance (Consolidated FY26)
Total Payout
₹19.16 cr
Payout Ratio
14.3%
EPS Cover
7.02x
Net Cash
₹594 cr
Classification: Consistent (flat) payer — token payout from a growth-stage, debt-free company. This is not a yield stock.
Dividend Announcement Summary
At its board meeting on 19 May 2026, the Board of C.E. Info Systems Limited (the company behind the MapmyIndia and Mappls brands) recommended a final dividend of ₹3.50 per equity share of face value ₹2 — a rate of 175% — for the financial year ended 31 March 2026.
The dividend is a final dividend and is subject to shareholder approval at the 31st Annual General Meeting scheduled for 11 August 2026. The Audit Committee reviewed and recommended the declaration, and the statutory auditors (MSKA & Associates LLP) issued an unmodified (clean) opinion on both standalone and consolidated results.
What the numbers say
The ₹3.50 payout is identical to FY23, FY24 and FY25. For a company that grew revenue at a 27%+ multi-year clip until recently, holding the dividend flat signals that management is deliberately retaining cash for reinvestment rather than returning it.
The context wire services miss
The dividend was declared in a year when consolidated net profit fell ~9% to ₹134.0 cr even as revenue edged up 2.3%. The payout is comfortably affordable, but it comes against a rare profit decline for this company — the real story sits in the P&L, not the dividend line.
Key Dates Timeline
Board / Announcement Date
19 May 2026
Record Date
04 August 2026
Ex-Date
04 August 2026
Under India's T+1 settlement, the ex-date is the same day as the record date.
AGM (approval)
11 August 2026
Final dividend payable only after shareholders approve it.
Payment Date
10 September 2026
Within the 30-day statutory limit after AGM approval.
Eligibility rule
To receive the dividend you must hold shares in your demat account as of the record date (04 Aug 2026). Buying on or after the ex-date means the seller keeps the dividend.
Dividend Yield Analysis
Yield at current price
₹3.50 ÷ ₹1,181.65 = 0.30%
CMP as on 03-Aug-2026 (NSE). Re-verify at publish time.
Yield on announcement day
₹3.50 ÷ ₹952.90 = 0.37%
NSE close on 19-May-2026 (announcement date).
Yield reality check
MapmyIndia's yield of roughly 0.3% is a fraction of the technology-sector average (~0.5%) and far below dividend-focused IT names like Infosys (~4%). Importantly, the yield only looks slightly higher than a year ago because the share price has fallen — the stock is down more than a third over 12 months, from a 52-week high of ~₹1,998 to ~₹1,182. A rising yield here reflects a falling denominator (price), not a rising dividend. This is a growth company that pays a symbolic dividend; it should be assessed on earnings and reinvestment, not on yield.
Dividend History Analysis
| Financial Year | Type | DPS (₹) | Rate | Ex/Record Date | Payment Date |
|---|---|---|---|---|---|
| FY26 | Final | 3.50 | 175% | 04 Aug 2026 | 10 Sep 2026 |
| FY25 | Final | 3.50 | 175% | 18 Jul 2025 | 24 Aug 2025 |
| FY24 | Final | 3.50 | 175% | 02 Aug 2024 | 09 Sep 2024 |
| FY23 | Final | 3.50 | 175% | 25 Aug 2023 | 30 Sep 2023 |
| FY22 | Interim | 2.00 | 100% | 15-16 Feb 2022 | 06 Mar 2022 |
Sources: exchange filings, TipRanks, Stockopedia. FY22 was the first payout after the December 2021 IPO.
Consistency
Since its IPO, the company has paid a dividend every year with no cuts, no suspensions and no special dividends. The final dividend has been held flat at ₹3.50 for four consecutive years.
Growth trend & classification
Zero dividend growth over four years while EPS roughly doubled from IPO levels. Verdict: a Consistent Payer with a fixed, token dividend — reliability is high, but income growth is nil.
Financial Performance Analysis
Consolidated results (₹ crore)
| Metric | FY26 | FY25 | Change |
|---|---|---|---|
| Revenue from operations | 474.10 | 463.25 | +2.3% |
| Total income | 526.50 | 515.69 | +2.1% |
| Total expenses | 330.79 | 306.09 | +8.1% |
| Profit before tax | 188.97 | 205.69 | −8.1% |
| Net profit (PAT) | 134.02 | 147.59 | −9.2% |
| EPS – Basic (₹) | 24.56 | 27.05 | −9.2% |
Operating leverage worked in reverse this year
Revenue grew just 2.3% while total expenses jumped 8.1% — the classic signature of negative operating leverage. The profit fall was driven by three cost lines, not a demand collapse:
- • Depreciation & amortisation +55.4% (₹19.58 cr → ₹30.42 cr) — the single biggest drag, reflecting heavy prior-year investment in map data, HD maps and intangibles now hitting the P&L.
- • Technical services / project software +18.7% (₹63.55 cr → ₹75.41 cr) — outsourcing and delivery costs rose far faster than revenue.
- • Employee benefits +8.7% (₹83.52 cr → ₹90.79 cr) — wage costs grew ~4x faster than revenue.
Widening losses from the associate & joint-venture line (−₹6.74 cr vs −₹3.91 cr) added a further ₹2.8 cr drag. Management flagged a sharp Q4 recovery (Q4 EBITDA margin ~44.6%) and an order book up 17% to ~₹1,754 cr, giving 3-4 years of revenue visibility — but the full-year print was a step down.
Quality-of-earnings flag
Of the ₹188.97 cr pre-tax profit, ₹52.40 cr (27.7%) came from other income — interest, fair-value gains on investments, and gains on sale of investments — not from the core mapping business. A meaningful slice of reported profit is treasury income on the company's large cash pile, which flatters headline PAT and is not a durable operating driver.
Cash Flow Analysis
Operating cash flow vs profit
Operating cash flow was ₹93.33 cr against PAT of ₹134.02 cr — a cash-conversion ratio of only ~70%. Reported profit is running well ahead of the cash actually collected.
Free cash flow
FCF (OCF − capex of ₹42.40 cr) was ₹50.93 cr. That covers the ₹19.16 cr dividend 2.66x — comfortable, but thinner than the headline cash pile suggests.
Why cash lags profit: the receivables red flag
Trade receivables jumped +32.6% (₹133.00 cr → ₹176.41 cr) while revenue grew only 2.3% — receivables expanded roughly 14 times faster than sales. Receivables now equal ~37% of a full year's operating revenue, up from ~29%. This working-capital build (Screener notes working-capital days rose from ~61 to ~93) absorbed ₹46.5 cr of operating cash and is the main reason cash conversion slipped. It is the kind of quiet balance-sheet drift that wire coverage rarely surfaces — worth watching for signs of aggressive revenue recognition or slower collections.
How is the dividend funded?
The dividend is funded from current-year free cash flow and existing cash reserves — not from borrowings or asset sales. In FY26 the company actually repaid ₹27.62 cr of borrowings and still paid dividends, ending the year with effectively no debt.
Balance Sheet Strength
Cash & equivalents
₹61.10 cr
Liquid investments*
₹332.50 cr
Cash + all investments
₹600.78 cr
Total borrowings
₹0 cr
The balance sheet is a fortress. Short-term borrowings are nil (down from ₹27.62 cr a year ago); the only debt-like items are lease liabilities of ~₹7.04 cr. Against ₹600.78 cr of cash and investments, the company is in a net-cash position of ~₹593.74 cr — roughly 31x the entire dividend outflow. Total equity attributable to owners stands at ~₹904.95 cr, and return on equity is ~15%.
*Liquid = cash & equivalents + other bank balances + current investments. "All investments" adds non-current investments. Verify whether any non-current investments are strategic/illiquid before treating them as dividend cover.
Dividend Sustainability Analysis
| Sustainability Test | Reading | Verdict |
|---|---|---|
| Earnings coverage (EPS ₹24.56 vs DPS ₹3.50) | 7.02x | Very strong |
| OCF coverage (₹93.33 cr vs ₹19.16 cr) | 4.87x | Strong |
| FCF coverage (₹50.93 cr vs ₹19.16 cr) | 2.66x | Comfortable |
| Cash coverage (₹600.78 cr vs ₹19.16 cr) | 31.4x | Fortress |
Verdict: Sustainable
On every test the ₹3.50 dividend is comfortably sustainable. With a 14% payout ratio, a net-cash balance sheet and 7x earnings cover, the payout could be maintained even through a materially worse year. The only watch flag is qualitative: earnings quality (treasury income at ~28% of PBT) and the receivables build mean investors should watch cash-backed profit, not just reported PAT. Sustainability of the dividend is not in doubt; the question is whether earnings and cash conversion re-accelerate.
Peer Comparison
| Company | Div Yield | Payout | ROE | Balance sheet |
|---|---|---|---|---|
| MapmyIndia (this co.) | ~0.30% | ~14% | ~15% | Net cash |
| Genesys International (geospatial peer) | ~0% (nil) | ~0% | Not verified | Low debt |
| Infosys (large-cap IT yield benchmark) | ~4.25% | ~68% | ~31% (3-yr) | Net cash |
ROCE and some peer cells left blank / unverified where they could not be confirmed from primary sources. Genesys is the closest listed geospatial peer; Infosys is included only as a dividend-policy benchmark, not an operational comparable.
Against its direct geospatial peer Genesys International — which pays essentially no dividend — MapmyIndia at least returns a token amount and sits on a stronger cash position. Against mature IT majors, its yield and payout are a fraction of theirs, which is appropriate: MapmyIndia is still in a reinvestment phase, and its capital-allocation choice to retain earnings mirrors its high-growth peers rather than its dividend-rich ones.
Promoter Impact Analysis
Promoter holding (Mar 2026)
51.41%
DII ~14.31% · FII ~3.15% · Public ~31%
Estimated promoter dividend income
~₹9.85 cr
Non-promoter shareholders share ~₹9.31 cr.
The Verma family promoters own 51.41%, so roughly half of every rupee of dividend flows to them — about ₹9.85 cr of the ₹19.16 cr outflow. Because promoter dividends are taxed at the individual's slab rate, the distribution is not a tax-efficient way for promoters to extract cash, which is consistent with the low, flat payout: the family appears to prioritise reinvestment and share-price value creation over dividend income. Promoter holding has been stable-to-rising (up 0.05% over the quarter), which is generally read as a sign of confidence.
Taxation Analysis
How dividends are taxed in India
Since the 2020 abolition of the Dividend Distribution Tax, dividends are taxable in the hands of the shareholder at their applicable income-tax slab rate. The company deducts TDS under Section 194 at 10% only if the aggregate dividend paid to a resident shareholder in a financial year exceeds ₹10,000 (threshold raised from ₹5,000 effective FY2025-26). Investors with income below the taxable limit can avoid TDS by submitting Form 15G/15H.
Worked example — retail investor holding 1,000 shares
| Item | 5% slab | 20% slab | 30% slab |
|---|---|---|---|
| Gross dividend (1,000 × ₹3.50) | ₹3,500 | ₹3,500 | ₹3,500 |
| TDS deducted (dividend < ₹10,000) | ₹0 | ₹0 | ₹0 |
| Tax incl. 4% cess | ₹182 | ₹728 | ₹1,092 |
| Net dividend in hand | ₹3,318 | ₹2,772 | ₹2,408 |
| Effective post-tax yield (@ ₹1,181.65) | 0.28% | 0.23% | 0.20% |
Even before tax the yield is ~0.30%; for a top-slab investor the post-tax yield is barely 0.20%. Illustrative only; not tax advice. Surcharge may apply at higher income levels.
Key Risks
1. Earnings momentum has stalled
FY26 saw the company's first full-year profit decline (−9.2%) as costs outran flat revenue. If negative operating leverage persists, EPS growth — the whole investment case — is at risk.
2. Receivables & working-capital drift
Receivables up 32.6% on 2.3% revenue growth, with working-capital days rising ~61 → ~93. This pressures cash conversion and could signal slower collections or concentration in a few large government/OEM contracts.
3. Earnings quality / reliance on other income
~28% of PBT is treasury/other income. A softer market or lower yields on the investment book would hit reported profit independent of the core business.
4. Rich valuation despite de-rating
Even after a ~40% one-year fall, the stock trades at a high P/E (~39x) and ~7x book. Any further earnings disappointment leaves little valuation cushion.
5. Customer & segment concentration
Revenue is a single "map data & related services" segment skewed toward automotive OEMs, enterprise and government. Loss or delay of a few marquee contracts can swing quarterly results, as Q1-Q3 FY26 softness showed.
6. Competitive & free-map threat
Global mapping platforms and free alternatives compete on price and data depth. Sustaining pricing power and JV execution (e.g., Indonesia PT Terra Link, currently loss-making) is not guaranteed.
What To Monitor
- • Revenue re-acceleration — whether the Q4 bounce (revenue +55% QoQ) and the ₹1,754 cr order book convert into double-digit annual growth in FY27.
- • Operating margin recovery — whether depreciation, technical-services and employee costs normalise so operating leverage turns positive again.
- • Receivables & cash conversion — whether working-capital days revert toward historic ~60 and OCF/PAT climbs back above ~85%.
- • Quality of profit — the share of PBT coming from core operations vs other income; a falling other-income mix is healthier.
- • JV / associate losses — the trajectory of the Indonesia JV and new associates, which dragged FY26 profit.
- • Capital-allocation signals — whether the flat ₹3.50 dividend, any future buyback, or a step-up in capex indicates management's read on growth runway.
Conclusion
Positives
A fourth straight year of a reliable ₹3.50 dividend; a fortress, net-cash balance sheet (₹600+ cr of cash and investments, zero borrowings); a payout covered 7x by earnings and 2.7x by free cash flow; a strong Q4 recovery; and a ₹1,754 cr order book offering multi-year revenue visibility.
Negatives & risks
The dividend accompanies the company's first annual profit decline (−9.2%), driven by negative operating leverage; cash conversion slipped to ~70% of PAT on a 32.6% receivables surge; ~28% of pre-tax profit is non-operating other income; and the yield of ~0.30% is negligible — and looks higher only because the stock has fallen ~40% in a year.
Net-net, the FY26 dividend is safe and sustainable, but it is a by-product of a cash-rich growth company, not an income proposition. For dividend-seekers the yield is immaterial; for growth-oriented readers, the more important signals are the margin and cash-conversion trends behind the payout, not the dividend itself. We present the evidence; readers should form their own view.
Frequently Asked Questions
What dividend has MapmyIndia (C.E. Info Systems) announced for FY26?
What is the dividend yield?
What is the record date for the dividend?
What is the ex-date?
When will the dividend be paid?
Who is eligible to receive it?
How is this dividend taxed?
Is the dividend sustainable?
What is the company's dividend history?
Why did net profit fall in FY26?
Is MapmyIndia a good stock for dividend income?
What should investors monitor after this dividend?
Disclaimer
This article is for informational and educational purposes only and does not constitute investment advice or a recommendation to buy, sell or hold any security. ShareBazaar Online is not a SEBI-registered investment adviser or research analyst. Financial figures are drawn from the company's audited FY26 results and publicly available sources; market price, record/ex-date and payment date should be independently re-verified against NSE/BSE corporate-action circulars and the company's filings before acting, as they may change. The final dividend is subject to shareholder approval at the AGM. Dividend yields and tax outcomes depend on the live share price and individual circumstances. Investments in securities are subject to market risks; please read all related documents carefully and consult a qualified financial adviser before making any investment decision.